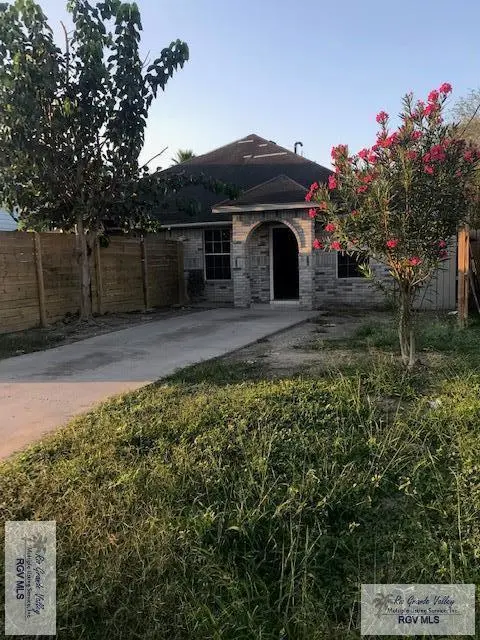
6369 Tecate Dr Unit A&B · Reid Hope King, TX
Flood risk 4/10 · Minor
- FEMA flood zone
- X (unshaded)
- Chance of flooding over 30 yrs
- 0.22%
- Est. flood insurance / yr
- $507 – $1,088
Fire risk 3/10 · Minor
- Est. fire insurance / yr
- $1,222 – $2,270
Heat risk 9/10 · Severe
- Hot days now (above 110°F)
- 7 days/yr
- Hot days in 30 yrs
- 24 days/yr
Wind risk 9/10 · Severe
- Chance of severe wind over 30 yrs
- 99.0%
Air-quality risk 2/10 · Minimal
- Unhealthy air days now
- 1 days/yr
- Unhealthy air days in 30 yrs
- 1 days/yr
Risk factors via First Street. Map © Google.
Why this score? — see what drove the F grade
The composite is a weighted blend of 9 inputs, each scored 0–100. Each bar is that input's sub-score; the figure is the points it added to the 100-point composite (weight × sub-score).
- ARV discount +7.5/15.0
- Cash flow +5.8/30.0
- Rent growth +4.5/5.0
- Livability +2.7/5.0
- Schools +2.2/10.0
- Condition / age +2.2/5.0
- 1% rule +1.2/10.0
- DSCR +0.2/10.0
- Appreciation +0.0/10.0
$226,000
🖨 Deal sheet 📄 Offer letter ✓ Due diligence
Listing remarks MLS
GREAT INVESTMENTS 3 BED ONE BATH
Key facts
- 6,717 sq ft lot
- 2 parking spots
- Built 2006
Neighborhood map
What this means for you Summary
Snapshot
- This is a condo listed at $226k. Condition is rated fair.
Deal economics
- At list price, monthly cash flow is $-451 ($-5k/yr) — negative.
- To cash-flow at today's rent, offer at most $161k (28.9% below list).
- To meet the 1% rule (rent ≥ 1% of price), the offer needs to be $141k (37.8% below list).
- Recommended offer: $141k (37.8% below list) — sets the bar for 1% rule.
Location & tenants
- Location reads 53/100 on livability (#1,440 in TX) — a working-class tenant base; expect higher turnover. Strengths: cost of living A+, housing A+, crime A; Watch: schools F, amenities F, commute F.
- Brownsville ISD (urban): math 20% / reading 34% proficiency, ranked #710 of 826 in TX (top 86%) — low school quality limits family demand, transient renter base, plan for 1-2y turnover; 83% free/reduced lunch — lower-income household profile, screen leases tightly.
- Market conditions: Rents rising fast (+8.2%/yr); 365 active listings in the ZIP; 2 comparable units currently listed for rent nearby; lower-income renter base — watch delinquency; 2,326 units permitted in Cameron County in 2024 (503 in 5+ unit buildings).
- This rent runs 38% of the median local income ($45k/yr) — at the standard rent-burdened threshold; future hikes will face affordability resistance.
Forward outlook
- Local home prices are declining (-3.0%/yr); year-one equity from $2k of loan paydown is wiped out by about $7k of value loss. Plan a longer hold.
- Cameron County population projected at +3% by 2050 — modest demand growth; plan on rents tracking national, not racing it.
Negotiation context
- It's been on market 254 days — a 12% lower offer ($199k) is reasonable based on typical stale-listing flexibility.
Risks & watch-outs
- Climate carrying-cost: severe wind risk, 99% chance of damaging wind over 30y; extreme-heat days projected 7→24/yr by 2055 (HVAC capex compounding) — expect insurance premiums to compound above CPI over the hold.
Questions for the listing agent
- What do current leases actually rent for vs. the listed asking? Can we see a recent rent roll and the last 12 months of T-12 income?
- It's been on market 254 days. Have you received any prior offers? Is the seller open to a 38% concession, seller financing, or rate buy-down credit?
- Have any recent inspections been done? Can we get a copy of the seller's disclosures and any deferred-maintenance estimates?
- Any open or pending special assessments — roof, HVAC, plumbing, elevator, façade? What's the per-unit balance and payoff schedule, and is the seller paying it off at close or rolling it to the buyer?
- Why hasn't it sold? Are there any deal-killer items the seller is aware of (foundation, flood, title, zoning, code violations)?
- Is there a deadline driving the sale (1031 exchange, divorce, estate, relocation)? That informs how much negotiation room exists.
- Schools are F-rated, which usually means shorter tenancies and higher turnover. Who's the typical renter profile here, and what's been the actual vacancy rate?
- The area grade is low — what's the realistic commute time and amenity access for the typical tenant pool here? Any planned neighborhood developments (good or bad) we should know about?
- What's the average days-on-market for RENTAL listings here right now (not sales)? A rising rental-DOM trend means longer vacancies and softer asking-rent achievability than the comps imply.
- What's the recent tenant-quality profile in this submarket — average credit score on applications, eviction rate, late-payment / NSF rate, and stable-employment percentage? A property-management company in the area should have these aggregated.
- How much new apartment / multifamily construction is in the pipeline within 1–3 miles? Heavy new supply (>2% of stock underway) typically softens rents 12–24 months out; light construction supports rent growth.
Investment metrics
- 1% rule
- 0.62% ✗
- Cap rate
- 3.90%
- Cash-on-cash
- -8.56%
- DSCR
- 0.62
- GRM
- 13.4
CMA / ARV
No comps found within radius.
Projected returns pro-forma
-3.0% appreciation · 8.0% rent growth · sell at horizon
- IRR
- -26.1%
- Equity multiple
- 0.08×
- Total profit
- $-57,923
- Equity at exit
- $33,697
- IRR
- -11.8%
- Equity multiple
- 0.15×
- Total profit
- $-53,565
- Equity at exit
- $19,540
Cash invested: $63,280 (down + closing). Projections, not guarantees.
Landlord ↔ Tenant lean methodology
- Overall (STATE)
- 87 Strongly Landlord-Friendly
- State Texas
- 87 Strongly Landlord-Friendly · R+5
- County
- — inherits STATE
- City
- — inherits STATE
ZIP-level market 78521
- Home prices YoY
- -26.0%
- Rents YoY
- 8.2%
- Active inventory
- 365
- Price-to-rent
- 13.4×
Monthly cashflow live
- Estimated rent
- $1,406 medium interval (Pro) →
- Mortgage (P&I)
- −$1,185
- Tax est. 1.5%
- −$282 /mo · $3,390/yr
- Insurance
- −$94
- HOA
- −$0
- Vacancy / Maint / Mgmt
- −$295
- Net cashflow
- $-451
Break-even live
UW: 25.0% down · 7.5% · 30yr · 1.5% tax · 5.0% vac · 8.0% maint · 8.0% mgmt
Financing live
Cash to close
- Down payment
- $56,500
- Closing costs
- $6,780
- Reserves months
- —
- Total cash needed
- —
Loan-product check · same deal, 3 products live
Conventional
25% down · 7.5% · 30yr
- Down + closing
- —
- Monthly P&I
- —
- Monthly cashflow
- —
- DSCR
- —
- Eligible?
- —
Personal DTI + credit; lowest rate.
DSCR
20% down · 8.5% · 30yr
- Down + closing
- —
- Monthly P&I
- —
- Monthly cashflow
- —
- DSCR
- —
- Eligible?
- —
No personal income docs; deal must DSCR.
Hard money
10% down · 12.0% · 12mo
- Down + closing
- —
- Monthly P&I
- —
- Monthly cashflow
- —
- DSCR
- —
- Eligible?
- —
Short-term bridge; refi at stabilization.
Rent comps 2 comps
| Address | Beds | Baths | Sqft | Rent | $/sqft | DOM | Units | Dist |
|---|---|---|---|---|---|---|---|---|
| 7100 Via Del Mar Cir Unit E-10 Brownsville, TX | 2.0 | 2.5 | 1247 | $1,500 | $1.20 | 21d | 1 | 0.80mi |
| 15 Corine Cir Brownsville, TX | 3.0 | 1.0 | 1337 | $1,200 | $0.90 | 13d | 1 | 1.35mi |
HOA detail condo
- Monthly dues
- $0 · $0/yr
- Assessments
- None detected in remarks — confirm with the listing agent.
Listing history 13 events
-
2026-06-18statusdays on market $226,000 Pending 254 DOM
-
2026-06-10days on market $226,000 Active 253 DOM
-
2026-06-09days on market $226,000 Active 252 DOM
-
2026-06-08days on market $226,000 Active 251 DOM
-
2026-06-07days on market $226,000 Active 250 DOM
-
2026-06-05days on market $226,000 Active 247 DOM
-
2026-06-03days on market $226,000 Active 246 DOM
-
2026-06-02days on market $226,000 Active 245 DOM
-
2026-06-01days on market $226,000 Active 244 DOM
-
2026-05-31days on market $226,000 Active 243 DOM
-
2026-05-30days on market $226,000 Active 242 DOM
-
2026-02-26price $226,000 32-char remark
Show marketing remark (32 chars)
GREAT INVESTMENTS 3 BED ONE BATH
-
2025-09-30$229,000 Active 32-char remark
Show marketing remark (32 chars)
GREAT INVESTMENTS 3 BED ONE BATH
ⓘ Source: listings_history table (triggers on properties + properties_extension) + one-shot
backfill from property_details.listing_events for pre-trigger history.
Climate risk First Street
- Flood 4/10 Moderate FEMA zone X (unshaded) · 22% chance over 30 yrs
- Wildfire 3/10 Moderate
- Heat 9/10 Extreme 7 d/yr ≥110°F today · 24 d/yr by 30 yrs out
- Wind 9/10 Extreme 99% chance of damaging wind over 30 yrs
- Air quality 2/10 Low 1 unhealthy d/yr today · 1 by 30 yrs out
Nearby sold comps map
Loading sold comps map…
Walkable amenities ~0.75 mi
Loading nearby amenities…
Taxation est. · year 1
- Rental income
- $16,867
- − Mortgage interest
- −$12,660
- − Property taxes
- −$3,390
- − Insurance
- −$1,130
- − Repairs & maintenance
- −$1,349
- − Management
- −$1,349
- − Depreciation
- −$6,575
- Taxable loss
- −$9,586
- Est. tax savings @ 24.0%
- +$2,301
- After-tax cash flow
- $-3,116/yr
For passive investors: Depreciation is non-cash, so a rental often shows a tax loss while cash-flowing — sheltering income. Rental losses are passive: they offset passive income freely, and up to $25,000/yr can offset ordinary (W-2) income if you actively participate and your MAGI is under $100k (phasing out to $0 by $150k); unused losses carry forward. On sale, claimed depreciation is recaptured at up to 25%, and gains may owe capital-gains tax (a 1031 exchange can defer both). Figures are a year-1 estimate at your 24.0% rate — not tax advice; consult a CPA.
Condition & rehab AI · 8 photos
The property requires significant landscaping and exterior paint work, as well as updates to the kitchen and bathroom to improve its overall appearance and functionality.
Repairs flagged
- Major Landscaping — Overgrown vegetation and unkempt lawn need significant attention.
- Minor Exterior paint — Neutral paint on exterior walls needs touch-up.
- Major Kitchen appliances — No appliances in the kitchen, indicating a need for updates.
- Major Bathroom fixtures — No visible fixtures or appliances in the bathroom, indicating a need for updates.
Value-add opportunities
- Both Landscaping and exterior paint — Improving curb appeal and exterior appearance would attract more buyers and renters.
- Both Kitchen appliances — Adding modern appliances would make the kitchen more functional and appealing to potential buyers and renters.
- Both Bathroom fixtures — Installing modern fixtures would make the bathroom more functional and appealing to potential buyers and renters.
Renovation cost estimate screening
| Repair item | Severity | Est. cost |
|---|---|---|
| Landscaping · Overgrown vegetation and unkempt lawn need significant attention. | Major | $15,000–50,000 |
| Exterior paint · Neutral paint on exterior walls needs touch-up. | Minor | $500–3,000 |
| Kitchen appliances · No appliances in the kitchen, indicating a need for updates. | Major | $15,000–50,000 |
| Bathroom fixtures · No visible fixtures or appliances in the bathroom, indicating a need for updates. | Major | $15,000–50,000 |
| Total estimated repair cost · 4 items | $45,500–153,000 |
Value-add ROI direction
- Both Landscaping and exterior paint — Improving curb appeal and exterior appearance would attract more buyers and renters. ↑
- Both Kitchen appliances — Adding modern appliances would make the kitchen more functional and appealing to potential buyers and renters. ↑
- Both Bathroom fixtures — Installing modern fixtures would make the bathroom more functional and appealing to potential buyers and renters. ↑
ⓘ Cost ranges are severity-bucket heuristics (US national rule-of-thumb). Get contractor quotes + a written scope before underwriting a rehab budget.
Schools (NCES district)
- District
- Brownsville ISD
- NCES district ID
- 4811680
- Math proficiency
- 20% ▼ -36.00%
- Reading proficiency
- 34% ▼ -13.00%
- Median HH income
- $30,490
- Composite
- 21.8/100
- National rank
- #8249
- State rank
- #710 of 826 in TX
Livability — Reid Hope King
- Score
- 53/100
- State rank
- #1440
- US rank
- #24573
Category grades
Schools grade is shown separately in the Schools card above.
Census & demographics
- County
- Cameron County · 310,734 people
- Metro
- Brownsville-Harlingen, TX
- Population (ZIP)
- 87,380
- Household income
- $44,509
- Rent vs Own
- Severe rent burden
- 2682.0
Population outlook (Cameron County) Hauer SSP2
- Today (2025)
- 441,603 people
- By 2030
- 448,113 · +1.5%
- By 2040
- 456,385 · +3.3%
- By 2050
- 456,294 · +3.3%
- By 2075
- 423,851 · -4.0%
- By 2100
- 342,787 · -22.4%
Race, ethnicity, and origin ACS 2023
- Neighborhood character
- Predominantly Hispanic (97%)
- Race & ethnicity
- Hispanic / Latino 97% Two or more races 45% White 3%
- Hispanic origin (detail)
- Mexican 91%
- Foreign-born
- 30% · Canada
- Languages at home
- 12% English-only · Spanish 88%
Political lean MEDSL · Cameron
- 2024 margin
- Lean R (+5.8) · D 46.7% · R 52.5%
- 2008→2024 swing
- -34.6pp toward R · 2008: 28.8pp · 2024: -5.8pp
- All cycles
- 2024: R+5.8 2020: D+13.2 2016: D+32.5 2012: D+32.4 2008: D+28.8
Not yet ingested
- Civics
- —
Market trends
- HPI YoY
- ▼ -81.45%
- Current HPI
- 232.1072
- Rent YoY
- ▲ 8.19%
- Metro
- Brownsville-Harlingen, TX
- State GDP YoY
- ▲ 3.95%
- F500 in state
- 110
Industry mix (Fortune 500 HQ in TX)
| Industry | F500 HQs | Revenue |
|---|---|---|
| Energy | 16 | $1,198B |
|
||
| Technology | 5 | $198B |
|
||
| Engineering / Construction | 4 | $72B |
|
||
| Energy Services | 3 | $60B |
|
||
| Utilities | 3 | $41B |
|
||
| Healthcare | 2 | $330B |
|
||
Price history
-1.3% since first listed2 events — show timeline
- 2026-02-26 Price Changed $226,000 RGVMLS
- 2025-09-30 Listed $229,000 RGVMLS
Cash-flow waterfall
monthlySold comps — $/sqft
last 12 mo · ≤1 miLoading sold comps…