10659 S Black Mesa Dr · Yucca, AZ
Flood risk 1/10 · Minimal
- FEMA flood zone
- X (unshaded)
- Chance of flooding over 30 yrs
- 0.0%
- Est. flood insurance / yr
- $507 – $1,088
Fire risk 2/10 · Minimal
- Est. fire insurance / yr
- $610 – $1,132
Heat risk 8/10 · Major
- Hot days now (above 108°F)
- 7 days/yr
- Hot days in 30 yrs
- 16 days/yr
Wind risk 1/10 · Minimal
- Chance of severe wind over 30 yrs
- —
Air-quality risk 1/10 · Minimal
- Unhealthy air days now
- 0 days/yr
- Unhealthy air days in 30 yrs
- 0 days/yr
Risk factors via First Street. Map © Google.
Why this score? — see what drove the D- grade
The composite is a weighted blend of 9 inputs, each scored 0–100. Each bar is that input's sub-score; the figure is the points it added to the 100-point composite (weight × sub-score).
- ARV discount +12.2/15.0
- Appreciation +9.9/10.0
- Cash flow +5.3/30.0
- Livability +2.8/5.0
- Rent growth +2.5/5.0
- Condition / age +2.5/5.0
- Schools +1.8/10.0
- 1% rule +0.9/10.0
- DSCR +0.0/10.0
$269,500
🖨 Deal sheet (PDF) 📄 Offer letter ✓ Due diligence
Listing remarks MLS
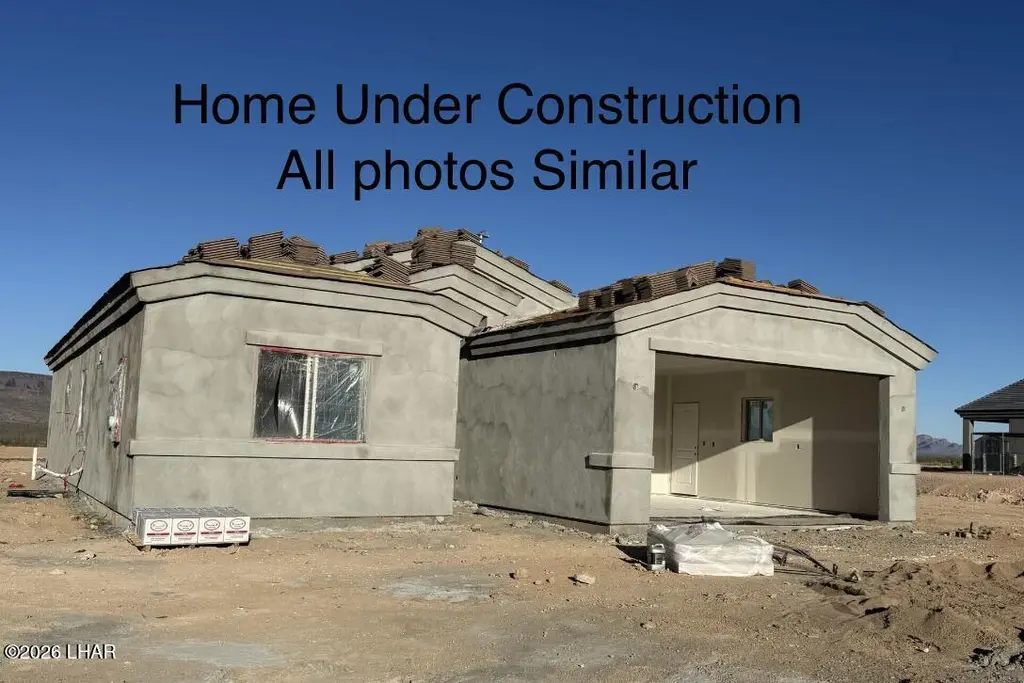
This brand-new Mesquite 1458 model features a two/ten-year new Home Buyer's Warranty. Featuring an open floor plan and split bedrooms, this home includes numerous upgrades such as granite countertops, an inside laundry room, a master suite walk-in closet, and a tile roof. Enjoy the convenience of front yard landscaping with an automatic watering system, along with many other desirable features. Please note that the broker is the owner/seller.
Key facts
- 0.5 acre lot
- 2 garage spots
- Built 2026
Neighborhood map
What this means for you Summary
Snapshot
- This is a 4-bed/2.0-bath single-family listed at $270k.
Deal economics
- At list price, monthly cash flow is $-603 ($-7k/yr) — negative.
- To cash-flow at today's rent, offer at most $182k (32.4% below list).
- To meet the 1% rule (rent ≥ 1% of price), the offer needs to be $159k (40.8% below list).
- Recommended offer: $159k (40.8% below list) — sets the bar for 1% rule.
- Cap rate 3.6% vs local median 2.5% in Yucca — top-decile yield for the area; either an underpriced asset or a hidden risk that comps aren't pricing in. Stress-test before assuming the spread holds.
Location & tenants
- Location reads 55/100 on livability (#260 in AZ) — a working-class tenant base; expect higher turnover. Strengths: cost of living A+, crime A; Watch: schools C-, health & safety C-, amenities F.
- Kingman Unified School District (79598) (town): math 19% / reading 24% proficiency, ranked #179 of 249 in AZ (top 72%) — low school quality limits family demand, transient renter base, plan for 1-2y turnover.
- Market conditions: 329 active listings in the ZIP; 2,543 units permitted in Mohave County in 2024 (33 in 5+ unit buildings).
Forward outlook
- In year one you build about $29k of equity ($2k loan paydown + $27k appreciation (9.9% local appreciation)).
- Mohave County population projected to shrink 6% by 2050 — rents likely to lag national; underwrite the cash flow, not the appreciation.
- By year 2, paydown + projected appreciation supports a ~$46k cash-out refi (75% LTV) — recoverable capital for the next deal without selling this one.
Negotiation context
- It's been on market 95 days — a 9% lower offer ($245k) is reasonable based on typical stale-listing flexibility.
- 3 sale attempts; this cycle's ask has dropped $17k (6%) from the opening price — seller is motivated, your offer sets the floor, not the list.
Risks & watch-outs
- Climate carrying-cost: extreme-heat days projected 7→16/yr by 2055 (HVAC capex compounding) — expect insurance premiums to compound above CPI over the hold.
Questions for the listing agent
- What do current leases actually rent for vs. the listed asking? Can we see a recent rent roll and the last 12 months of T-12 income?
- It's been on market 95 days. Have you received any prior offers? Is the seller open to a 41% concession, seller financing, or rate buy-down credit?
- Why hasn't it sold? Are there any deal-killer items the seller is aware of (foundation, flood, title, zoning, code violations)?
- Is there a deadline driving the sale (1031 exchange, divorce, estate, relocation)? That informs how much negotiation room exists.
- The area grade is low — what's the realistic commute time and amenity access for the typical tenant pool here? Any planned neighborhood developments (good or bad) we should know about?
- What's the average days-on-market for RENTAL listings here right now (not sales)? A rising rental-DOM trend means longer vacancies and softer asking-rent achievability than the comps imply.
- What's the recent tenant-quality profile in this submarket — average credit score on applications, eviction rate, late-payment / NSF rate, and stable-employment percentage? A property-management company in the area should have these aggregated.
- How much new for-sale + rental construction is in the pipeline within 1–3 miles? Heavy new supply typically softens prices + rents 12–24 months out; constrained supply supports both.
Investment metrics
- 1% rule
- 0.59% ✗
- Cap rate
- 3.61%
- Cash-on-cash
- -9.59%
- DSCR
- 0.57
- GRM
- 14.1
CMA / ARV
- ARV (median comp)
- $300,649
- List price
- $269,500
- Delta
- -10.36%
- Verdict
- UNDERPRICED
- Comps
- 4 within 1.0 mi
Show comp detail 3 sales within ~0.75 mi
| Address | Dist | Beds/Ba | Sqft | Sold | Price | $/sf | Match |
|---|---|---|---|---|---|---|---|
| 10643 S Black Mesa Dr | 0.04mi | 3/2.0 (-1) | 1,472 (+1%) | 4mo | $299,000 | $203 | 88 |
| 10651 S Black Mesa Dr | 0.02mi | 3/2.0 (-1) | 1,593 (+9%) | 9mo | $302,000 | $190 | 71 |
| 10712 S Black Mesa Dr | 0.15mi | 3/2.0 (-1) | 1,358 (-7%) | 14mo | $205,000 | $151 | 65 |
Match score weights: distance 35% · size 25% · config 20% · recency 20%. Top-matched comps best support the ARV.
Projected returns pro-forma
9.9% appreciation · 3.0% rent growth · sell at horizon
- IRR
- 17.3%
- Equity multiple
- 2.41×
- Total profit
- $106,476
- Equity at exit
- $240,727
- IRR
- 16.4%
- Equity multiple
- 5.55×
- Total profit
- $343,270
- Equity at exit
- $516,961
Cash invested: $75,460 (down + closing). Projections, not guarantees.
Landlord ↔ Tenant lean methodology
- Overall (STATE)
- 87 Strongly Landlord-Friendly
- State Arizona
- 87 Strongly Landlord-Friendly · R+3
- County
- — inherits STATE
- City
- — inherits STATE
ZIP-level market 86438
- Home prices YoY
- 3.6%
- Active inventory
- 329
- Price-to-rent
- 14.1×
Monthly cashflow live
- Estimated rent
- $1,595 medium interval (Pro) →
- Mortgage (P&I)
- −$1,413
- Tax est. 1.5%
- −$337 /mo · $4,042/yr
- Insurance
- −$112
- HOA
- −$0
- Vacancy / Maint / Mgmt
- −$335
- Net cashflow
- $-603
Break-even live
Sensitivity live
| Price | -10% $-416 | -5% $-510 | +0% $-603 | +5% $-696 | +10% $-789 |
|---|---|---|---|---|---|
| Rent | -10% $-729 | -5% $-666 | +0% $-603 | +5% $-540 | +10% $-477 |
| Rate | -1.0pp $-467 | -0.5pp $-534 | base $-603 | +0.5pp $-673 | +1.0pp $-744 |
UW: 25.0% down · 7.5% · 30yr · 1.5% tax · 5.0% vac · 8.0% maint · 8.0% mgmt
Financing live
Cash to close
- Down payment
- $67,375
- Closing costs
- $8,085
- Reserves months
- —
- Total cash needed
- —
Loan-product check · same deal, 3 products live
Conventional
25% down · 7.5% · 30yr
- Down + closing
- —
- Monthly P&I
- —
- Monthly cashflow
- —
- DSCR
- —
- Eligible?
- —
Personal DTI + credit; lowest rate.
DSCR
20% down · 8.5% · 30yr
- Down + closing
- —
- Monthly P&I
- —
- Monthly cashflow
- —
- DSCR
- —
- Eligible?
- —
No personal income docs; deal must DSCR.
Hard money
10% down · 12.0% · 12mo
- Down + closing
- —
- Monthly P&I
- —
- Monthly cashflow
- —
- DSCR
- —
- Eligible?
- —
Short-term bridge; refi at stabilization.
Listing history 23 events
-
2026-06-21days on market $269,500 Active 95 DOM
-
2026-06-18days on market $269,500 Active 92 DOM
-
2026-06-17days on market $269,500 Active 91 DOM
-
2026-06-16days on market $269,500 Active 90 DOM
-
2026-06-15days on market $269,500 Active 89 DOM
-
2026-06-14days on market $269,500 Active 87 DOM
-
2026-06-13days on market $269,500 Active 86 DOM
-
2026-06-10days on market $269,500 Active 84 DOM
-
2026-06-09days on market $269,500 Active 83 DOM
-
2026-06-08days on market $269,500 Active 82 DOM
-
2026-06-07days on market $269,500 Active 81 DOM
-
2026-06-05days on market $269,500 Active 78 DOM
-
2026-06-03days on market $269,500 Active 77 DOM
-
2026-06-02days on market $269,500 Active 76 DOM
-
2026-06-01days on market $269,500 Active 75 DOM
-
2026-05-31days on market $269,500 Active 74 DOM
-
2026-05-30days on market $269,500 Active 73 DOM
-
2026-04-30price $269,500 446-char remark
Show marketing remark (446 chars)
This brand-new Mesquite 1458 model features a two/ten-year new Home Buyer's Warranty. Featuring an open floor plan and split bedrooms, this home includes numerous upgrades such as granite countertops, an inside laundry room, a master suite walk-in closet, and a tile roof. Enjoy the convenience of front yard landscaping with an automatic watering system, along with many other desirable features. Please note that the broker is the owner/seller.
-
2026-04-30price $269,500
Show marketing remark (446 chars)
This brand-new Mesquite 1458 model features a two/ten-year new Home Buyer's Warranty. Featuring an open floor plan and split bedrooms, this home includes numerous upgrades such as granite countertops, an inside laundry room, a master suite walk-in closet, and a tile roof. Enjoy the convenience of front yard landscaping with an automatic watering system, along with many other desirable features. Please note that the broker is the owner/seller.
-
2026-04-29price $269,500
-
2026-03-18$286,500 Active
-
2025-10-24$286,500 Active 446-char remark
Show marketing remark (446 chars)
This brand-new Mesquite 1458 model features a two/ten-year new Home Buyer's Warranty. Featuring an open floor plan and split bedrooms, this home includes numerous upgrades such as granite countertops, an inside laundry room, a master suite walk-in closet, and a tile roof. Enjoy the convenience of front yard landscaping with an automatic watering system, along with many other desirable features. Please note that the broker is the owner/seller.
-
2025-10-10$286,500 Active
ⓘ Source: listings_history table (triggers on properties + properties_extension) + one-shot
backfill from property_details.listing_events for pre-trigger history.
Climate risk First Street
- Flood 1/10 Low FEMA zone X (unshaded) · 0% chance over 30 yrs
- Wildfire 2/10 Low
- Heat 8/10 Severe 7 d/yr ≥108°F today · 16 d/yr by 30 yrs out
- Wind 1/10 Low
- Air quality 1/10 Low 0 unhealthy d/yr today · 0 by 30 yrs out
Nearby sold comps map
Loading sold comps map…
Walkable amenities ~0.75 mi
Loading nearby amenities…
Taxation est. · year 1
- Rental income
- $19,135
- − Mortgage interest
- −$15,096
- − Property taxes
- −$4,042
- − Insurance
- −$1,348
- − Repairs & maintenance
- −$1,531
- − Management
- −$1,531
- − Depreciation
- −$7,840
- Taxable loss
- −$12,253
- Est. tax savings @ 24.0%
- +$2,941
- After-tax cash flow
- $-4,292/yr
For passive investors: Depreciation is non-cash, so a rental often shows a tax loss while cash-flowing — sheltering income. Rental losses are passive: they offset passive income freely, and up to $25,000/yr can offset ordinary (W-2) income if you actively participate and your MAGI is under $100k (phasing out to $0 by $150k); unused losses carry forward. On sale, claimed depreciation is recaptured at up to 25%, and gains may owe capital-gains tax (a 1031 exchange can defer both). Figures are a year-1 estimate at your 24.0% rate — not tax advice; consult a CPA.
Schools (NCES district)
- District
- Kingman Unified School District (79598)
- NCES district ID
- 0400295
- Math proficiency
- 19% ▼ -11.00%
- Reading proficiency
- 24% ▼ -9.00%
- Median HH income
- $36,760
- Composite
- 17.87/100
- National rank
- #9002
- State rank
- #179 of 249 in AZ
Livability — Yucca
- Score
- 55/100
- State rank
- #260
- US rank
- #23315
Category grades
Schools grade is shown separately in the Schools card above.
Census & demographics
- Population (ZIP)
- 692
Population outlook (Mohave County) Hauer SSP2
- Today (2025)
- 209,184 people
- By 2030
- 209,674 · +0.2%
- By 2040
- 205,897 · -1.6%
- By 2050
- 196,810 · -5.9%
- By 2075
- 169,454 · -19.0%
- By 2100
- 136,630 · -34.7%
Race, ethnicity, and origin ACS 2023
- Neighborhood character
- Predominantly White (80%)
- Race & ethnicity
- White 80% Hispanic / Latino 12% Two or more races 8% Black 2% Native American 2%
- Hispanic origin (detail)
- Mexican 6%
- Common ancestry
- Lithuanian 9% Slovak 7% Russian 4%
- Foreign-born
- 2% · Canada, Jamaica
- Languages at home
- 98% English-only · Spanish 2%
Political lean MEDSL · Mohave
- 2024 margin
- Solid R (+55.8) · D 21.8% · R 77.6%
- 2008→2024 swing
- -22.9pp toward R · 2008: -32.9pp · 2024: -55.8pp
- All cycles
- 2024: R+55.8 2020: R+51.3 2016: R+51.5 2012: R+42.6 2008: R+32.9
Not yet ingested
- Civics
- —
Market trends
- HPI YoY
- ▲ 9.90%
- Current HPI
- 283.2861
- Rent YoY
- —
- Metro
- —
- State GDP YoY
- ▲ 4.54%
- F500 in state
- 20
Industry mix (Fortune 500 HQ in AZ)
| Industry | F500 HQs | Revenue |
|---|---|---|
| Technology | 2 | $13B |
|
||
| Mining / Metals | 1 | $23B |
|
||
| Environmental Services | 1 | $16B |
|
||
| Metals / Steel | 1 | $14B |
|
||
| Technology Distribution | 1 | $9B |
|
||
| Homebuilding | 1 | $8B |
|
||
Price history
-5.9% since first listed6 events — show timeline
- 2026-04-30 Price Changed $269,500 WARDEX
- 2026-04-30 Price Changed $269,500 LHAR
- 2026-04-29 Price Changed $269,500 Zillow
- 2026-03-18 Listed $286,500 LHAR
- 2025-10-24 Listed $286,500 WARDEX
- 2025-10-10 Listed $286,500 Zillow
Cash-flow waterfall
monthlySold comps — $/sqft
last 12 mo · ≤1 miLoading sold comps…