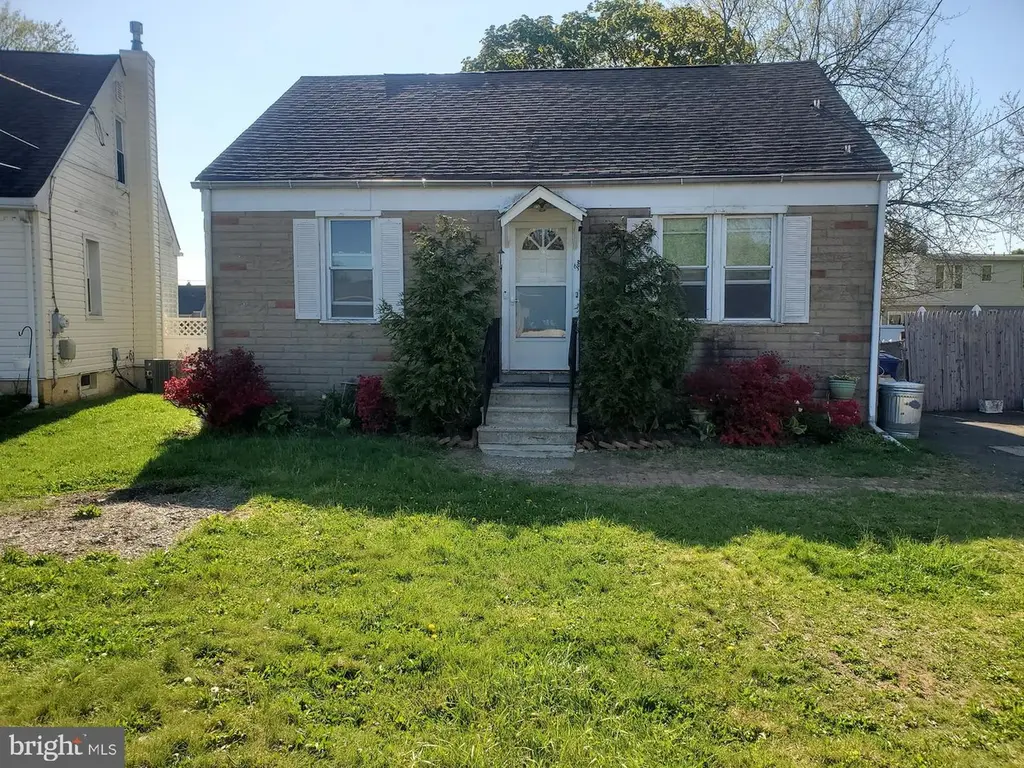
10 Thorntown Ln · Bordentown, NJ
Flood risk 1/10 · Minimal
- FEMA flood zone
- X (unshaded)
- Chance of flooding over 30 yrs
- 0.0%
- Est. flood insurance / yr
- $507 – $1,088
Fire risk 1/10 · Minimal
- Est. fire insurance / yr
- $526 – $976
Heat risk 6/10 · Moderate
- Hot days now (above 102°F)
- 7 days/yr
- Hot days in 30 yrs
- 15 days/yr
Wind risk 6/10 · Moderate
- Chance of severe wind over 30 yrs
- 27.0%
Air-quality risk 5/10 · Moderate
- Unhealthy air days now
- 6 days/yr
- Unhealthy air days in 30 yrs
- 8 days/yr
Risk factors via First Street. Map © Google.
Why this score? — see what drove the C grade
The composite is a weighted blend of 9 inputs, each scored 0–100. Each bar is that input's sub-score; the figure is the points it added to the 100-point composite (weight × sub-score).
- Cash flow +17.7/30.0
- ARV discount +15.0/15.0
- 1% rule +5.7/10.0
- DSCR +5.5/10.0
- Rent growth +4.0/5.0
- Livability +3.9/5.0
- Schools +3.8/10.0
- Condition / age +2.5/5.0
- Appreciation +0.0/10.0
$269,900
🖨 Deal sheet 📄 Offer letter ✓ Due diligence
Listing remarks
Bordentown Fixer-Upper Opportunity in Desirable Bossert Estates! Unlock the potential of this 4 bedroom Cape Cod. This home offers a fantastic opportunity for investors or ambitious buyers ready to build instant sweat equity. Featuring a full basement and a classic layout, this property is ready for your vision and updates to bring it back to life. Set on a quarter acre lot with road frontage at both the front and rear yards. With strong upside potential, it’s the perfect project for those looking to renovate and customize to their taste. Cash, hard money, or FHA 203K rehab financing preferred. Opportunities like this don’t come around often—act fast and make this property
Key facts
- Quarter acre lot
- Road frontage
- Full basement
Tags
Neighborhood map
What this means for you Summary
Snapshot
- This is a 4-bed/1.0-bath single-family listed at $270k.
Deal economics
- At list price, monthly cash flow is $219 ($3k/yr) — positive.
- The deal already cash-flows at list — no discount required.
- Meets the 1% rule at list price ($3k rent vs $270k).
- Cap rate 7.3% vs local median 3.3% in Bordentown — top-decile yield for the area; either an underpriced asset or a hidden risk that comps aren't pricing in. Stress-test before assuming the spread holds.
Location & tenants
- Location reads 77/100 on livability (#115 in NJ, #2,907 nationally) — a middle-class / working-renter tenant base. Strengths: crime A+, employment A+, housing A+; Watch: commute D+, amenities F, cost of living F.
- Bordentown Regional School District (suburban): math 29% / reading 53% proficiency, ranked #206 of 472 in NJ (top 44%) — families likely to look elsewhere, expect single-tenant / working-renter base with shorter leases; only 12% free/reduced lunch — higher-income household profile.
- Market conditions: Rents rising fast (+6.1%/yr); 97 active listings in the ZIP; 1 comparable units currently listed for rent nearby; high-income renter base; 2,161 units permitted in Burlington County in 2024 (988 in 5+ unit buildings).
- This rent runs 31% of the median local income ($113k/yr) — at the standard rent-burdened threshold; future hikes will face affordability resistance.
Forward outlook
- Local home prices are declining (-3.0%/yr); year-one equity from $2k of loan paydown is wiped out by about $8k of value loss. Plan a longer hold.
- Burlington County population projected to shrink 5% by 2050 — rents likely to lag national; underwrite the cash flow, not the appreciation.
Negotiation context
- Only 6 days on market — expect competitive offers; lowballing is unlikely to land.
- Current owner paid $80k; list at $270k implies a 237% gain — meaningful room to come down on a strong offer.
Risks & watch-outs
- Watch-outs: built in 1957 — expect roof / HVAC / electrical / plumbing capex.
- Climate carrying-cost: major wind risk, 27% chance of damaging wind over 30y; extreme-heat days projected 7→15/yr by 2055 (HVAC capex compounding) — expect insurance premiums to compound above CPI over the hold.
Questions for the listing agent
- Built in 1957 — when were the roof, HVAC, electrical panel, plumbing, and water heater last replaced?
- Is there a deadline driving the sale (1031 exchange, divorce, estate, relocation)? That informs how much negotiation room exists.
- Schools are B-rated — typically a magnet for longer-tenancy family renters. What's the average tenant stay here, and is there a school-zone premium baked into asking?
- What's the average days-on-market for RENTAL listings here right now (not sales)? A rising rental-DOM trend means longer vacancies and softer asking-rent achievability than the comps imply.
- What's the recent tenant-quality profile in this submarket — average credit score on applications, eviction rate, late-payment / NSF rate, and stable-employment percentage? A property-management company in the area should have these aggregated.
- How much new for-sale + rental construction is in the pipeline within 1–3 miles? Heavy new supply typically softens prices + rents 12–24 months out; constrained supply supports both.
Investment metrics
- 1% rule
- 1.07% ✓
- Cap rate
- 7.27%
- Cash-on-cash
- 3.48%
- DSCR
- 1.15
- GRM
- 7.8
CMA / ARV
- ARV (on-the-fly)
- $366,912
- Comps found
- 9
Show comp detail 9 sales within ~0.75 mi
| Address | Dist | Beds/Ba | Sqft | Sold | Price | $/sf | Match |
|---|---|---|---|---|---|---|---|
| 10 Thorntown Ln | 0.00mi | 4/1.0 | 1,248 (0%) | 1mo | $275,000 | $220 | 100 |
| 8 Thorntown Ln | 0.01mi | 3/1.0 (-1) | 1,248 (0%) | 20mo | $365,000 | $292 | 77 |
| 9 Butts Ave | 0.49mi | 3/2.0 (-1) | 1,276 (+2%) | 1mo | $399,900 | $313 | 64 |
| 283 Ward Ave | 0.22mi | 3/1.5 (-1) | 1,389 (+11%) | 3mo | $435,000 | $313 | 61 |
| 9 Charles Bossert Dr | 0.30mi | 3/2.0 (-1) | 1,095 (-12%) | 6mo | $400,000 | $365 | 51 |
| 23 Willow Rd | 0.41mi | 3/2.0 (-1) | 1,224 (-2%) | 21mo | $440,000 | $359 | 51 |
| 62 Elizabeth St | 0.64mi | 3/1.0 (-1) | 1,280 (+3%) | 13mo | $376,000 | $294 | 50 |
| 20 Brook Ln | 0.41mi | 3/1.0 (-1) | 1,332 (+7%) | 23mo | $330,000 | $248 | 46 |
| 22 Charles Bossert Dr | 0.33mi | 3/1.0 (-1) | 1,409 (+13%) | 24mo | $340,000 | $241 | 38 |
Match score weights: distance 35% · size 25% · config 20% · recency 20%. Top-matched comps best support the ARV.
Projected returns pro-forma
-3.0% appreciation · 6.07% rent growth · sell at horizon
- IRR
- -7.1%
- Equity multiple
- 0.73×
- Total profit
- $-20,449
- Equity at exit
- $40,243
- IRR
- 6.3%
- Equity multiple
- 1.54×
- Total profit
- $40,882
- Equity at exit
- $23,336
Cash invested: $75,572 (down + closing). Projections, not guarantees.
Landlord ↔ Tenant lean methodology
- Overall (STATE)
- 21 Tenant-Leaning
- State New Jersey
- 21 Tenant-Leaning · D+6
- County
- — inherits STATE
- City
- — inherits STATE
ZIP-level market 08505
- Home prices YoY
- -31.6%
- Rents YoY
- 6.1%
- Active inventory
- 97
- Price-to-rent
- 7.8×
Monthly cashflow live
- Estimated rent
- $2,879 medium interval (Pro) →
- Mortgage (P&I)
- −$1,415
- Tax from tax record
- −$527 /mo · $6,328/yr
- Insurance
- −$112
- HOA
- −$0
- Vacancy / Maint / Mgmt
- −$605
- Net cashflow
- $219
Break-even live
UW: 25.0% down · 7.5% · 30yr · 1.5% tax · 5.0% vac · 8.0% maint · 8.0% mgmt
Financing live
Cash to close
- Down payment
- $67,475
- Closing costs
- $8,097
- Reserves months
- —
- Total cash needed
- —
Loan-product check · same deal, 3 products live
Conventional
25% down · 7.5% · 30yr
- Down + closing
- —
- Monthly P&I
- —
- Monthly cashflow
- —
- DSCR
- —
- Eligible?
- —
Personal DTI + credit; lowest rate.
DSCR
20% down · 8.5% · 30yr
- Down + closing
- —
- Monthly P&I
- —
- Monthly cashflow
- —
- DSCR
- —
- Eligible?
- —
No personal income docs; deal must DSCR.
Hard money
10% down · 12.0% · 12mo
- Down + closing
- —
- Monthly P&I
- —
- Monthly cashflow
- —
- DSCR
- —
- Eligible?
- —
Short-term bridge; refi at stabilization.
Rent comps 1 comps
| Address | Beds | Baths | Sqft | Rent | $/sqft | DOM | Units | Dist |
|---|---|---|---|---|---|---|---|---|
| 151 2nd St Unit 2 Bordentown, NJ | 4.0 | 1.0 | 1300 | $2,150 | $1.65 | 24d | 1 | 0.79mi |
Listing history 4 events
-
2026-05-15status Pending
-
2026-04-28historical
-
2026-04-22$269,900 Active
-
1990-07-09soldstatus $80,000
ⓘ Source: listings_history table (triggers on properties + properties_extension) + one-shot
backfill from property_details.listing_events for pre-trigger history.
Tax reassessment forecast NJ · Partial reset (capped growth)
- Current annual tax
- $6,328 · $527/mo
- Projected year-2 tax
- $6,524 · $544/mo
- Expected delta
- +$196/yr (+$16/mo · 3.1%)
ⓘ Screening estimate from a state-policy table — verify with the county assessor before closing.
Climate risk First Street
- Flood 1/10 Low FEMA zone X (unshaded) · 0% chance over 30 yrs
- Wildfire 1/10 Low
- Heat 6/10 Major 7 d/yr ≥102°F today · 15 d/yr by 30 yrs out
- Wind 6/10 Major 27% chance of damaging wind over 30 yrs
- Air quality 5/10 Major 6 unhealthy d/yr today · 8 by 30 yrs out
Nearby sold comps map
Loading sold comps map…
Walkable amenities ~0.75 mi
Loading nearby amenities…
Taxation est. · year 1
- Rental income
- $34,547
- − Mortgage interest
- −$15,119
- − Property taxes
- −$6,328
- − Insurance
- −$1,350
- − Repairs & maintenance
- −$2,764
- − Management
- −$2,764
- − Depreciation
- −$7,852
- Taxable loss
- −$1,628
- Est. tax savings @ 24.0%
- +$391
- After-tax cash flow
- $3,021/yr
For passive investors: Depreciation is non-cash, so a rental often shows a tax loss while cash-flowing — sheltering income. Rental losses are passive: they offset passive income freely, and up to $25,000/yr can offset ordinary (W-2) income if you actively participate and your MAGI is under $100k (phasing out to $0 by $150k); unused losses carry forward. On sale, claimed depreciation is recaptured at up to 25%, and gains may owe capital-gains tax (a 1031 exchange can defer both). Figures are a year-1 estimate at your 24.0% rate — not tax advice; consult a CPA.
Schools (NCES district)
- District
- Bordentown Regional School District
- NCES district ID
- 3402030
- Math proficiency
- 29% ▼ -20.00%
- Reading proficiency
- 53% ▬ 0.00%
- Median HH income
- $78,817
- Composite
- 37.98/100
- National rank
- #4295
- State rank
- #206 of 472 in NJ
Livability — Bordentown
- Score
- 77/100
- State rank
- #115
- US rank
- #2907
Category grades
Schools grade is shown separately in the Schools card above.
Census & demographics
- County
- Burlington County · 323,710 people
- Metro
- Philadelphia-Camden-Wilmington, PA-NJ-DE-MD
- Population (ZIP)
- 19,142
- Household income
- $112,845
- Rent vs Own
- Severe rent burden
- 380.0
Population outlook (Burlington County) Hauer SSP2
- Today (2025)
- 453,425 people
- By 2030
- 452,359 · -0.2%
- By 2040
- 445,033 · -1.9%
- By 2050
- 431,760 · -4.8%
- By 2075
- 406,277 · -10.4%
- By 2100
- 364,732 · -19.6%
Race, ethnicity, and origin ACS 2023
- Neighborhood character
- Predominantly White (69%)
- Race & ethnicity
- White 69% Hispanic / Latino 11% Two or more races 11% Black 9% Asian 6%
- Hispanic origin (detail)
- Mexican 1% Puerto Rican 5% Dominican 1%
- Common ancestry
- Romanian 9% Lithuanian 2% Italian 2%
- Foreign-born
- 13% · Canada, Vietnam, China
- Languages at home
- 79% English-only · Other Asian/Pacific 7% Spanish 6% Other Indo-European 2%
Political lean MEDSL · Burlington
- 2024 margin
- D (+16.6) · D 57.6% · R 41.0% · Other 1.3%
- 2008→2024 swing
- -2.0pp toward R · 2008: 18.6pp · 2024: 16.6pp
- All cycles
- 2024: D+16.6 2020: D+19.5 2016: D+14.8 2012: D+18.7 2008: D+18.6
Not yet ingested
- Civics
- —
Market trends
- HPI YoY
- ▼ -129.01%
- Current HPI
- 279.5254
- Rent YoY
- ▲ 6.07%
- Metro
- Philadelphia-Camden-Wilmington, PA-NJ-DE-MD
- State GDP YoY
- ▲ 2.05%
- F500 in state
- 34
Industry mix (Fortune 500 HQ in NJ)
| Industry | F500 HQs | Revenue |
|---|---|---|
| Consumer Goods | 3 | $31B |
|
||
| Pharmaceuticals | 2 | $153B |
|
||
| Technology | 2 | $21B |
|
||
| Insurance | 2 | $20B |
|
||
| Healthcare | 2 | $19B |
|
||
| Financial Services | 1 | $70B |
|
||
Price history
+237.4% since first listed4 events — show timeline
- 2026-05-15 Pending — BRIGHT MLS
- 2026-04-28 Listing Removed — BRIGHT MLS
- 2026-04-22 Listed $269,900 BRIGHT MLS
- 1990-07-09 Sold (Public Records) $80,000 Public Records
Property tax history
+1.9%/yrLatest (2025): $6,328 · +3.4% YoY. Source: county tax records.
Cash-flow waterfall
monthlySold comps — $/sqft
last 12 mo · ≤1 miLoading sold comps…