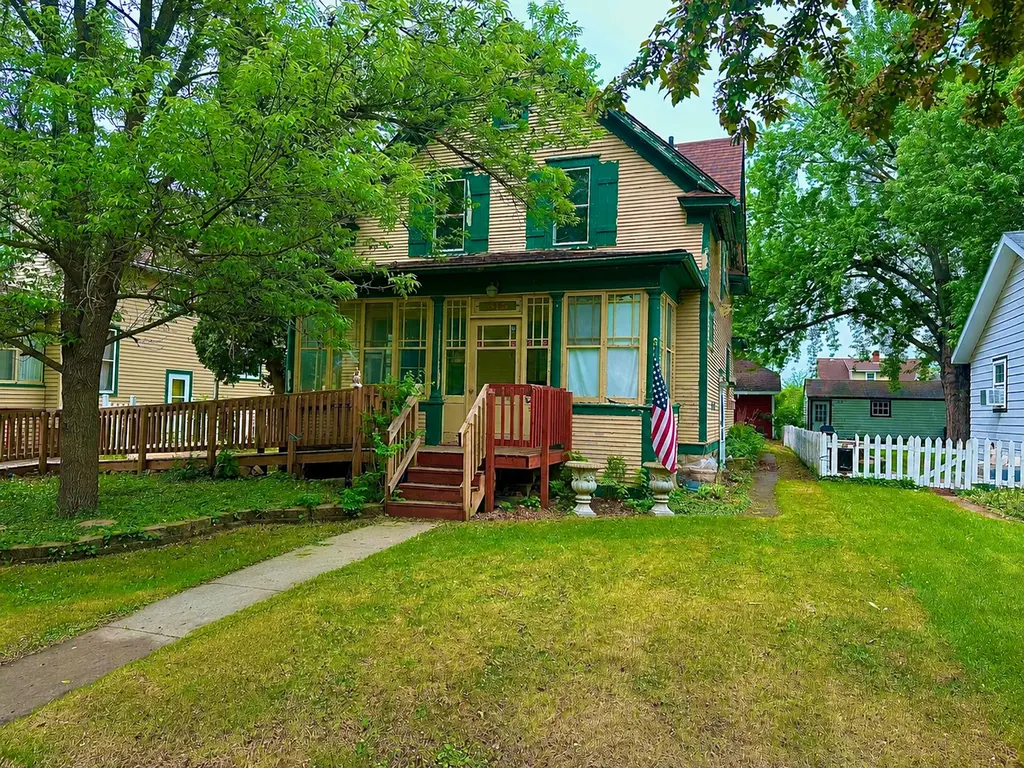
815 Main Ave N · Thief River Falls, MN
Flood risk 1/10 · Minimal
- FEMA flood zone
- X (unshaded)
- Chance of flooding over 30 yrs
- 0.0%
- Est. flood insurance / yr
- $473 – $860
Fire risk 1/10 · Minimal
- Est. fire insurance / yr
- $888 – $1,650
Heat risk 1/10 · Minimal
- Hot days now (above 94°F)
- 7 days/yr
- Hot days in 30 yrs
- 12 days/yr
Wind risk 1/10 · Minimal
- Chance of severe wind over 30 yrs
- —
Air-quality risk 3/10 · Minor
- Unhealthy air days now
- 2 days/yr
- Unhealthy air days in 30 yrs
- 2 days/yr
Risk factors via First Street. Map © Google.
Why this score? — see what drove the B- grade
The composite is a weighted blend of 9 inputs, each scored 0–100. Each bar is that input's sub-score; the figure is the points it added to the 100-point composite (weight × sub-score).
- Cash flow +29.1/30.0
- DSCR +10.0/10.0
- 1% rule +8.4/10.0
- ARV discount +7.5/15.0
- Schools +3.7/10.0
- Livability +3.7/5.0
- Rent growth +2.5/5.0
- Condition / age +2.5/5.0
- Appreciation +0.0/10.0
$110,000
🖨 Deal sheet 📄 Offer letter ✓ Due diligence
Listing remarks MLS
TURN OF THE CENTURY CHARMER! SHADY FRONT PORCH, 3 BEDMS, 3 BATHS, MAIN FLOOR FAM ROOM, HARDWOOD FLOORS ON BOTH FLOORS, OPEN OAK STAIRCASE, BUILT IN OAK HUTCH, NICE GAS FIREPLACE, PILLARS, LARGE KITCHEN, LOWER LEVEL IS UNFINISHED BUT HAS TILED FLOORS, PAINT ROOM, MAIN FLOOR LAUNDRY, GARAGE COULD FIT 2 SMALL CARS. 2 LARGE BEDMS WITH WI CLOSETS AND ANOTHER SMALLER BEDM.
Key facts
- Inviting front porch
- Newer roof
- Solid structure
Tags
Property features AI
Exterior
- Parking: 1-car garage (20x20)
- Utilities: City water (in street); City sewer connected; Natural gas
- Home design: Residential property; Two levels; Block foundation
- Construction: Asphalt roof; Block foundation; Foundation dimensions approximately 53x23
- Exterior features: Front porch; Wood exterior
Interior
- Kitchen: Range; Refrigerator
- Bedrooms: 4 bedrooms
- Bathrooms: Three 3/4 bathrooms; Main floor 1/2 bath
- Heating & cooling: Boiler heating; Fireplace heating; Window air conditioning units
- Interior features: Gas fireplace; Separate/formal dining room; Porch; Partial unfinished basement
- Laundry & utility: Washer hookup; Electric dryer hookup; Main level laundry; Tankless water heater
Neighborhood map
What this means for you Summary
Snapshot
- This is a 4-bed/3.0-bath single-family listed at $110k.
Deal economics
- At list price, monthly cash flow is $381 ($5k/yr) — positive.
- The deal already cash-flows at list — no discount required.
- Meets the 1% rule at list price ($1k rent vs $110k).
- Recommended offer: $108k (1.5% below list) — sets the bar for market timing.
- Cap rate 10.4% vs local median 5.5% in Thief River Falls — top-decile yield for the area; either an underpriced asset or a hidden risk that comps aren't pricing in. Stress-test before assuming the spread holds.
Location & tenants
- Location reads 74/100 on livability (#219 in MN, #4,606 nationally) — a middle-class / working-renter tenant base. Strengths: cost of living A+, housing A+, crime A; Watch: health & safety D+, amenities F, commute F.
- Thief River Falls School District (town): math 39% / reading 47% proficiency, ranked #201 of 301 in MN (top 67%) — families likely to look elsewhere, expect single-tenant / working-renter base with shorter leases.
- Market conditions: 102 active listings in the ZIP; 11 units permitted in Pennington County in 2024 (0 in 5+ unit buildings).
Forward outlook
- Local home prices are declining (-3.0%/yr); year-one equity from $761 of loan paydown is wiped out by about $3k of value loss. Plan a longer hold.
- Pennington County population projected at +5% by 2050 — modest demand growth; plan on rents tracking national, not racing it.
- At projected returns (-3.0% appreciation + 3.0% rent growth), your $31k cash investment doubles in ~8 years — after that, you're playing with house money.
Negotiation context
- It's been on market 17 days — a 2% lower offer ($108k) is reasonable based on typical stale-listing flexibility.
- 2 sale attempts since 10y ago with the ask held roughly flat each time — persistent listings suggest the price (not the market) is what's stuck; bring a comps-based counter.
Risks & watch-outs
- Watch-outs: built in 1910 — expect roof / HVAC / electrical / plumbing capex.
Questions for the listing agent
- Built in 1910 — when were the roof, HVAC, electrical panel, plumbing, and water heater last replaced?
- Is there a deadline driving the sale (1031 exchange, divorce, estate, relocation)? That informs how much negotiation room exists.
- Schools are B-rated — typically a magnet for longer-tenancy family renters. What's the average tenant stay here, and is there a school-zone premium baked into asking?
- What's the average days-on-market for RENTAL listings here right now (not sales)? A rising rental-DOM trend means longer vacancies and softer asking-rent achievability than the comps imply.
- What's the recent tenant-quality profile in this submarket — average credit score on applications, eviction rate, late-payment / NSF rate, and stable-employment percentage? A property-management company in the area should have these aggregated.
- How much new for-sale + rental construction is in the pipeline within 1–3 miles? Heavy new supply typically softens prices + rents 12–24 months out; constrained supply supports both.
Investment metrics
- 1% rule
- 1.34% ✓
- Cap rate
- 10.45%
- Cash-on-cash
- 14.83%
- DSCR
- 1.66
- GRM
- 6.2
CMA / ARV
- ARV (on-the-fly)
- $51,870
- Comps found
- 1
Show comp detail 1 sale within ~0.75 mi
| Address | Dist | Beds/Ba | Sqft | Sold | Price | $/sf | Match |
|---|---|---|---|---|---|---|---|
| 601 State Ave N | 0.33mi | 3/2.0 (-1) | 1,601 (-7%) | 21mo | $47,600 | $30 | 46 |
Match score weights: distance 35% · size 25% · config 20% · recency 20%. Top-matched comps best support the ARV.
Projected returns pro-forma
-3.0% appreciation · 3.0% rent growth · sell at horizon
- IRR
- 5.4%
- Equity multiple
- 1.21×
- Total profit
- $6,458
- Equity at exit
- $16,401
- IRR
- 14.8%
- Equity multiple
- 2.20×
- Total profit
- $36,992
- Equity at exit
- $9,511
Cash invested: $30,800 (down + closing). Projections, not guarantees.
Landlord ↔ Tenant lean methodology
- Overall (STATE)
- 46 Balanced
- State Minnesota
- 46 Balanced · D+2
- County
- — inherits STATE
- City
- — inherits STATE
ZIP-level market 56701
- Active inventory
- 102
- Price-to-rent
- 6.2×
Monthly cashflow live
- Estimated rent
- $1,473 medium interval (Pro) →
- Mortgage (P&I)
- −$577
- Tax from tax record
- −$160 /mo · $1,920/yr
- Insurance
- −$46
- HOA
- −$0
- Vacancy / Maint / Mgmt
- −$309
- Net cashflow
- $381
Break-even live
UW: 25.0% down · 7.5% · 30yr · 1.5% tax · 5.0% vac · 8.0% maint · 8.0% mgmt
Financing live
Cash to close
- Down payment
- $27,500
- Closing costs
- $3,300
- Reserves months
- —
- Total cash needed
- —
Loan-product check · same deal, 3 products live
Conventional
25% down · 7.5% · 30yr
- Down + closing
- —
- Monthly P&I
- —
- Monthly cashflow
- —
- DSCR
- —
- Eligible?
- —
Personal DTI + credit; lowest rate.
DSCR
20% down · 8.5% · 30yr
- Down + closing
- —
- Monthly P&I
- —
- Monthly cashflow
- —
- DSCR
- —
- Eligible?
- —
No personal income docs; deal must DSCR.
Hard money
10% down · 12.0% · 12mo
- Down + closing
- —
- Monthly P&I
- —
- Monthly cashflow
- —
- DSCR
- —
- Eligible?
- —
Short-term bridge; refi at stabilization.
Listing history 13 events
-
2026-06-18days on market $110,000 Active 17 DOM
-
2026-06-17days on market $110,000 Active 16 DOM
-
2026-06-16days on market $110,000 Active 15 DOM
-
2026-06-15days on market $110,000 Active 14 DOM
-
2026-06-13days on market $110,000 Active 12 DOM
-
2026-06-12days on market $110,000 Active 11 DOM
-
2026-06-09days on market $110,000 Active 8 DOM
-
2026-06-08days on market $110,000 Active 7 DOM
-
2026-06-07days on market $110,000 Active 6 DOM
-
2026-06-07days on market $110,000 Active 5 DOM
-
2026-06-04days on market $110,000 Active 2 DOM
-
2026-06-02remarks 699-char remark
-
2026-06-02$110,000 Active 1 DOM
ⓘ Source: listings_history table (triggers on properties + properties_extension) + one-shot
backfill from property_details.listing_events for pre-trigger history.
Tax reassessment forecast MN · Partial reset (capped growth)
- Current annual tax
- $1,920 · $160/mo
- Projected year-2 tax
- $1,920 · $160/mo
- Expected delta
- $0/yr ($0/mo · 0.0%)
ⓘ Screening estimate from a state-policy table — verify with the county assessor before closing.
Climate risk First Street
- Flood 1/10 Low FEMA zone X (unshaded) · 0% chance over 30 yrs
- Wildfire 1/10 Low
- Heat 1/10 Low 7 d/yr ≥94°F today · 12 d/yr by 30 yrs out
- Wind 1/10 Low
- Air quality 3/10 Moderate 2 unhealthy d/yr today · 2 by 30 yrs out
Nearby sold comps map
Loading sold comps map…
Walkable amenities ~0.75 mi
Loading nearby amenities…
Taxation est. · year 1
- Rental income
- $17,672
- − Mortgage interest
- −$6,162
- − Property taxes
- −$1,920
- − Insurance
- −$550
- − Repairs & maintenance
- −$1,414
- − Management
- −$1,414
- − Depreciation
- −$3,200
- Taxable income
- $3,013
- Est. tax owed @ 24.0%
- −$723
- After-tax cash flow
- $3,845/yr
For passive investors: Depreciation is non-cash, so a rental often shows a tax loss while cash-flowing — sheltering income. Rental losses are passive: they offset passive income freely, and up to $25,000/yr can offset ordinary (W-2) income if you actively participate and your MAGI is under $100k (phasing out to $0 by $150k); unused losses carry forward. On sale, claimed depreciation is recaptured at up to 25%, and gains may owe capital-gains tax (a 1031 exchange can defer both). Figures are a year-1 estimate at your 24.0% rate — not tax advice; consult a CPA.
Schools (NCES district)
- District
- Thief River Falls School District
- NCES district ID
- 2738850
- Math proficiency
- 39% ▼ -19.00%
- Reading proficiency
- 47% ▼ -13.00%
- Median HH income
- $49,239
- Composite
- 36.88/100
- National rank
- #4547
- State rank
- #201 of 301 in MN
Livability — Thief River Falls
- Score
- 74/100
- State rank
- #219
- US rank
- #4606
Category grades
Schools grade is shown separately in the Schools card above.
Census & demographics
- Census place
- Thief River Falls, MN
- City population
- 12,814
- Population (ZIP)
- 12,814
Population outlook (Pennington County) Hauer SSP2
- Today (2025)
- 14,800 people
- By 2030
- 15,030 · +1.6%
- By 2040
- 15,402 · +4.1%
- By 2050
- 15,601 · +5.4%
- By 2075
- 15,659 · +5.8%
- By 2100
- 14,231 · -3.8%
Race, ethnicity, and origin ACS 2023
- Neighborhood character
- Predominantly White (88%)
- Race & ethnicity
- White 88% Hispanic / Latino 5% Two or more races 4% Black 1% Asian 1%
- Hispanic origin (detail)
- Mexican 4%
- Common ancestry
- Portuguese 34% Romanian 4% Lithuanian 4%
- Foreign-born
- 3% · Canada
- Languages at home
- 94% English-only · Spanish 3% French/Haitian/Cajun 1% Russian/Polish/Slavic 1%
Political lean MEDSL · Pennington
- 2024 margin
- Solid R (+31.5) · D 33.1% · R 64.6% · Other 2.3%
- 2008→2024 swing
- -33.6pp toward R · 2008: 2.1pp · 2024: -31.5pp
- All cycles
- 2024: R+31.5 2020: R+27.0 2016: R+27.8 2012: R+4.3 2008: D+2.1
Not yet ingested
- Civics
- —
Market trends
- HPI YoY
- ▼ -123.53%
- Current HPI
- 136.4729
- Rent YoY
- —
- Metro
- —
- State GDP YoY
- ▲ 2.41%
- F500 in state
- 34
Industry mix (Fortune 500 HQ in MN)
| Industry | F500 HQs | Revenue |
|---|---|---|
| Healthcare | 2 | $407B |
|
||
| Retail | 2 | $150B |
|
||
| Consumer Goods | 2 | $32B |
|
||
| Industrial Machinery | 2 | $6B |
|
||
| Agriculture | 1 | $40B |
|
||
| Healthcare / Medical Devices | 1 | $32B |
|
||
Price history
+11.7% since first listed4 events — show timeline
- 2026-06-01 Listed $110,000 NORTHSTARMLS as Distributed by MLS Grid
- 2017-05-15 Sold (Public Records) $97,000 Public Records
- 2017-05-09 Sold (MLS) $97,000 NORTHSTARMLS as Distributed by MLS Grid
- 2016-09-08 Listed $98,500 NORTHSTARMLS as Distributed by MLS Grid
Property tax history
+3.1%/yrLatest (2026): $1,920 · -15.1% YoY. Source: county tax records.
Cash-flow waterfall
monthlySold comps — $/sqft
last 12 mo · ≤1 miLoading sold comps…