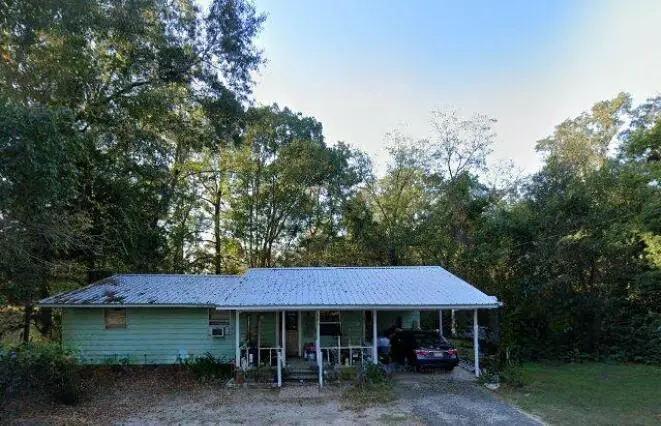
395 E Brock Ave · Bonifay, FL
Flood risk 1/10 · Minimal
- FEMA flood zone
- X (unshaded)
- Chance of flooding over 30 yrs
- 0.0%
- Est. flood insurance / yr
- $507 – $1,088
Fire risk 5/10 · Moderate
- Est. fire insurance / yr
- $947 – $1,759
Heat risk 8/10 · Major
- Hot days now (above 107°F)
- 7 days/yr
- Hot days in 30 yrs
- 19 days/yr
Wind risk 9/10 · Severe
- Chance of severe wind over 30 yrs
- 99.0%
Air-quality risk 2/10 · Minimal
- Unhealthy air days now
- 1 days/yr
- Unhealthy air days in 30 yrs
- 1 days/yr
Risk factors via First Street. Map © Google.
Why this score? — see what drove the B+ grade
The composite is a weighted blend of 9 inputs, each scored 0–100. Each bar is that input's sub-score; the figure is the points it added to the 100-point composite (weight × sub-score).
- Cash flow +30.0/30.0
- DSCR +10.0/10.0
- Appreciation +10.0/10.0
- 1% rule +9.7/10.0
- ARV discount +7.5/15.0
- Schools +3.7/10.0
- Livability +3.4/5.0
- Rent growth +2.5/5.0
- Condition / age +2.5/5.0
$50,000
🖨 Deal sheet 📄 Offer letter ✓ Due diligence
Listing remarks
Investor Alert -- Charming 2BR/1BA Rehab Opportunity with Flip Potential! Handy investor special in town of Bonifay -- solid 1 bed, 1 bath footprint ready for a full renovation. Clean layout, strong bones, and a blank canvas to add value with cosmetic upgrades, modern finishes, and smart staging. Ideal for first-time flippers or portfolio builders looking for a quick turnaround and strong ROI. tenants are family related so they are just paying utilities, no monthly rental fees. ($225-$250 for water, sewer, garbage and electric combined). Metal roof is 3 years old. Room measurements are not factual. Needs to be measured / verified
Key facts
- 0.25 acre lot
- Built 1971
- Listed 46 days
Property features AI
Exterior
- Parking: Attached covered carport
- Utilities: Electric service; Public water; Public sewer
- Home design: Single-story home; Architectural style: Other; Built in 1971
- Construction: Metal roof; Aluminum siding; Foundation off grade
- Exterior features: Covered attached carport; Lot approximately 0.25 acre (dimensions 104 x 75); Subdivision: none; Zoned for single-family residential
Interior
- Kitchen: Kitchen located on the first floor; Refrigerator included
- Bedrooms: 2 bedrooms (all on the first floor)
- Bathrooms: 1 full bathroom (first floor)
- Heating & cooling: Window/Wall AC
- Interior features: Window cooling (window/wall units); Electric water heater
Neighborhood map
What this means for you Summary
Snapshot
- This is a 2-bed/1.0-bath single-family listed at $50k.
Deal economics
- At list price, monthly cash flow is $206 ($2k/yr) — positive.
- The deal already cash-flows at list — no discount required.
- Meets the 1% rule at list price ($737 rent vs $50k).
- Recommended offer: $48k (3.0% below list) — sets the bar for market timing.
- Cap rate 11.2% vs local median 3.8% in Bonifay — top-decile yield for the area; either an underpriced asset or a hidden risk that comps aren't pricing in. Stress-test before assuming the spread holds.
Location & tenants
- Location reads 67/100 on livability (#577 in FL) — a middle-class / working-renter tenant base. Strengths: crime A+, cost of living A+, housing A+; Watch: amenities F, commute F, employment F.
- Holmes (rural): math 44% / reading 45% proficiency, ranked #53 of 73 in FL (top 73%) — families likely to look elsewhere, expect single-tenant / working-renter base with shorter leases.
- Zoned schools: Bonifay K-8 School (math 58% / reading 47%, grade C-, #976 of 2,144 statewide, top 46%, 1,192 students, 58% FRL); Holmes County High School (math 22% / reading 50%, grade F, #359 of 667 statewide, top 55%, 453 students, 49% FRL) — zoned schools at 54% FRL track the district average.
- Market conditions: 141 active listings in the ZIP; 3 comparable units currently listed for rent nearby; rentals at typical pace (median 22d on market — plan ~3-4 weeks tenant-placement turnaround); 12 units permitted in Holmes County in 2024 (0 in 5+ unit buildings).
Forward outlook
- In year one you build about $5k of equity ($346 loan paydown + $5k appreciation (10.0% local appreciation)).
- Holmes County population projected at -17% by 2050 — secular population decline; favor cash flow + early exit over multi-decade hold.
- At projected returns (10.0% appreciation + 3.0% rent growth), your $14k cash investment doubles in ~2 years — after that, you're playing with house money.
- By year 6, paydown + projected appreciation supports a ~$31k cash-out refi (75% LTV) — recoverable capital for the next deal without selling this one.
Negotiation context
- It's been on market 46 days — a 3% lower offer ($48k) is reasonable based on typical stale-listing flexibility.
Risks & watch-outs
- Climate carrying-cost: severe wind risk, 99% chance of damaging wind over 30y; moderate wildfire risk; extreme-heat days projected 7→19/yr by 2055 (HVAC capex compounding) — expect insurance premiums to compound above CPI over the hold.
Questions for the listing agent
- It's been on market 46 days. Have you received any prior offers? Is the seller open to a 3% concession, seller financing, or rate buy-down credit?
- Built in 1971 — when were the roof, HVAC, electrical panel, plumbing, and water heater last replaced?
- Is there a deadline driving the sale (1031 exchange, divorce, estate, relocation)? That informs how much negotiation room exists.
- Schools are D-rated, which usually means shorter tenancies and higher turnover. Who's the typical renter profile here, and what's been the actual vacancy rate?
- What's the average days-on-market for RENTAL listings here right now (not sales)? A rising rental-DOM trend means longer vacancies and softer asking-rent achievability than the comps imply.
- What's the recent tenant-quality profile in this submarket — average credit score on applications, eviction rate, late-payment / NSF rate, and stable-employment percentage? A property-management company in the area should have these aggregated.
- How much new for-sale + rental construction is in the pipeline within 1–3 miles? Heavy new supply typically softens prices + rents 12–24 months out; constrained supply supports both.
Investment metrics
- 1% rule
- 1.47% ✓
- Cap rate
- 11.25%
- Cash-on-cash
- 17.70%
- DSCR
- 1.79
- GRM
- 5.7
CMA / ARV
No comps found within radius.
Projected returns pro-forma
10.0% appreciation · 3.0% rent growth · sell at horizon
- IRR
- 37.4%
- Equity multiple
- 3.89×
- Total profit
- $40,411
- Equity at exit
- $45,044
- IRR
- 32.3%
- Equity multiple
- 8.77×
- Total profit
- $108,722
- Equity at exit
- $97,139
Cash invested: $14,000 (down + closing). Projections, not guarantees.
Landlord ↔ Tenant lean methodology
- Overall (STATE)
- 87 Strongly Landlord-Friendly
- State Florida
- 87 Strongly Landlord-Friendly · R+3
- County
- — inherits STATE
- City
- — inherits STATE
ZIP-level market 32425
- Home prices YoY
- 16.2%
- Active inventory
- 141
- Price-to-rent
- 5.7×
Monthly cashflow live
- Estimated rent
- $737 medium interval (Pro) →
- Mortgage (P&I)
- −$262
- Tax from tax record
- −$93 /mo · $1,110/yr
- Insurance
- −$21
- HOA
- −$0
- Vacancy / Maint / Mgmt
- −$155
- Net cashflow
- $206
Break-even live
UW: 25.0% down · 7.5% · 30yr · 1.5% tax · 5.0% vac · 8.0% maint · 8.0% mgmt
Financing live
Cash to close
- Down payment
- $12,500
- Closing costs
- $1,500
- Reserves months
- —
- Total cash needed
- —
Loan-product check · same deal, 3 products live
Conventional
25% down · 7.5% · 30yr
- Down + closing
- —
- Monthly P&I
- —
- Monthly cashflow
- —
- DSCR
- —
- Eligible?
- —
Personal DTI + credit; lowest rate.
DSCR
20% down · 8.5% · 30yr
- Down + closing
- —
- Monthly P&I
- —
- Monthly cashflow
- —
- DSCR
- —
- Eligible?
- —
No personal income docs; deal must DSCR.
Hard money
10% down · 12.0% · 12mo
- Down + closing
- —
- Monthly P&I
- —
- Monthly cashflow
- —
- DSCR
- —
- Eligible?
- —
Short-term bridge; refi at stabilization.
Rent comps 3 comps
| Address | Beds | Baths | Sqft | Rent | $/sqft | DOM | Units | Dist |
|---|---|---|---|---|---|---|---|---|
| 109 Hill Loop Bonifay, FL | 1.0 | 1.0 | 732 | $750 | $1.02 | 21d | 1 | 0.87mi |
| 117 Hill Loop Bonifay, FL | 1.0 | 1.0 | 702 | $750 | $1.07 | 21d | 1 | 0.88mi |
| 125 Hill Loop Bonifay, FL | 1.0 | 1.0 | 532 | $700 | $1.32 | 21d | 1 | 0.90mi |
Listing history 9 events
-
2026-06-02days on market $50,000 Active 46 DOM
-
2026-06-01days on market $50,000 Active 45 DOM
-
2026-05-31days on market $50,000 Active 44 DOM
-
2026-05-30days on market $50,000 Active 43 DOM
-
2026-05-16price $50,000
-
2026-05-08price $60,000
-
2026-04-30price $73,000
-
2026-04-22price $85,000
-
2026-04-17$95,000 Active
ⓘ Source: listings_history table (triggers on properties + properties_extension) + one-shot
backfill from property_details.listing_events for pre-trigger history.
Tax reassessment forecast FL · Resets to sale price
- Current annual tax
- $1,110 · $93/mo
- Projected year-2 tax
- $1,110 · $93/mo
- Expected delta
- $0/yr ($0/mo · 0.0%)
ⓘ Screening estimate from a state-policy table — verify with the county assessor before closing.
Climate risk First Street
- Flood 1/10 Low FEMA zone X (unshaded) · 0% chance over 30 yrs
- Wildfire 5/10 Major
- Heat 8/10 Severe 7 d/yr ≥107°F today · 19 d/yr by 30 yrs out
- Wind 9/10 Extreme 99% chance of damaging wind over 30 yrs
- Air quality 2/10 Low 1 unhealthy d/yr today · 1 by 30 yrs out
Nearby sold comps map
Loading sold comps map…
Walkable amenities ~0.75 mi
Loading nearby amenities…
Taxation est. · year 1
- Rental income
- $8,841
- − Mortgage interest
- −$2,801
- − Property taxes
- −$1,110
- − Insurance
- −$250
- − Repairs & maintenance
- −$707
- − Management
- −$707
- − Depreciation
- −$1,455
- Taxable income
- $1,811
- Est. tax owed @ 24.0%
- −$435
- After-tax cash flow
- $2,043/yr
For passive investors: Depreciation is non-cash, so a rental often shows a tax loss while cash-flowing — sheltering income. Rental losses are passive: they offset passive income freely, and up to $25,000/yr can offset ordinary (W-2) income if you actively participate and your MAGI is under $100k (phasing out to $0 by $150k); unused losses carry forward. On sale, claimed depreciation is recaptured at up to 25%, and gains may owe capital-gains tax (a 1031 exchange can defer both). Figures are a year-1 estimate at your 24.0% rate — not tax advice; consult a CPA.
Schools (NCES district)
- District
- Holmes
- NCES district ID
- 1200900
- Math proficiency
- 44% ▼ -5.00%
- Reading proficiency
- 45% ▼ -7.00%
- Median HH income
- $35,365
- Composite
- 36.83/100
- National rank
- #4558
- State rank
- #53 of 73 in FL
Livability — Bonifay
- Score
- 67/100
- State rank
- #577
- US rank
- #10976
Category grades
Schools grade is shown separately in the Schools card above.
Census & demographics
- Census place
- Bonifay, FL
- Population (ZIP)
- 13,944
Population outlook (Holmes County) Hauer SSP2
- Today (2025)
- 17,963 people
- By 2030
- 17,245 · -4.0%
- By 2040
- 15,970 · -11.1%
- By 2050
- 14,905 · -17.0%
- By 2075
- 12,327 · -31.4%
- By 2100
- 9,760 · -45.7%
Race, ethnicity, and origin ACS 2023
- Neighborhood character
- Predominantly White (81%)
- Race & ethnicity
- White 81% Black 9% Two or more races 6% Hispanic / Latino 4%
- Common ancestry
- Slovak 1% Iranian 1% Lithuanian 1%
- Foreign-born
- 2% · Canada
- Languages at home
- 94% English-only · Spanish 4% Russian/Polish/Slavic 1% French/Haitian/Cajun 1%
Political lean MEDSL · Holmes
- 2024 margin
- Solid R (+80.2) · D 9.7% · R 89.9%
- 2008→2024 swing
- -15.1pp toward R · 2008: -65.0pp · 2024: -80.2pp
- All cycles
- 2024: R+80.2 2020: R+78.9 2016: R+77.9 2012: R+68.3 2008: R+65.0
Not yet ingested
- Civics
- —
Market trends
- HPI YoY
- ▲ 44.87%
- Current HPI
- 322.29
- Rent YoY
- —
- Metro
- —
- State GDP YoY
- ▲ 3.28%
- F500 in state
- 36
Industry mix (Fortune 500 HQ in FL)
| Industry | F500 HQs | Revenue |
|---|---|---|
| Industrial Technology | 2 | $29B |
|
||
| Insurance | 2 | $17B |
|
||
| Retail | 1 | $60B |
|
||
| Technology Distribution | 1 | $58B |
|
||
| Homebuilding | 1 | $35B |
|
||
| Technology Manufacturing | 1 | $35B |
|
||
Price history
-47.4% since first listed5 events — show timeline
- 2026-05-16 Price Changed $50,000 ECAR
- 2026-05-08 Price Changed $60,000 ECAR
- 2026-04-30 Price Changed $73,000 ECAR
- 2026-04-22 Price Changed $85,000 ECAR
- 2026-04-17 Listed $95,000 ECAR
Property tax history
+17.8%/yrLatest (2025): $1,110 · +239.3% YoY. Source: county tax records.
Cash-flow waterfall
monthlySold comps — $/sqft
last 12 mo · ≤1 miLoading sold comps…