14392 County Road 6790 · South Fork, MO
Flood risk 7/10 · Major
- FEMA flood zone
- X (unshaded)
- Chance of flooding over 30 yrs
- 0.99%
- Est. flood insurance / yr
- $473 – $860
Fire risk 6/10 · Moderate
- Est. fire insurance / yr
- $1,054 – $1,958
Heat risk 4/10 · Minor
- Hot days now (above 106°F)
- 7 days/yr
- Hot days in 30 yrs
- 20 days/yr
Wind risk 2/10 · Minimal
- Chance of severe wind over 30 yrs
- 2.0%
Air-quality risk 1/10 · Minimal
- Unhealthy air days now
- 0 days/yr
- Unhealthy air days in 30 yrs
- 0 days/yr
Risk factors via First Street. Map © Google.
Why this score? — see what drove the C grade
The composite is a weighted blend of 9 inputs, each scored 0–100. Each bar is that input's sub-score; the figure is the points it added to the 100-point composite (weight × sub-score).
- Cash flow +22.9/30.0
- ARV discount +7.5/15.0
- DSCR +7.3/10.0
- Appreciation +5.0/10.0
- 1% rule +4.6/10.0
- Schools +3.4/10.0
- Rent growth +2.5/5.0
- Condition / age +2.5/5.0
- Livability +2.3/5.0
$115,000
🖨 Deal sheet (PDF) 📄 Offer letter ✓ Due diligence
Listing remarks
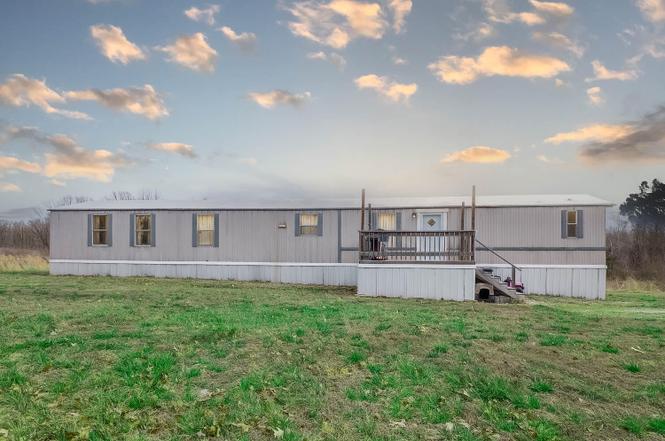
This beautifully maintained 3-bedroom, 2-bath home sits on 7 scenic acres, offering the perfect mix of comfort and space. Featuring all-new plank flooring throughout, a spacious kitchen and dining area, and a huge pantry, this home is designed for convenience. Stay comfortable year-round with central heat and air. The large yard provides plenty of space for outdoor enjoyment, while the additional acreage offers room to roam. A small pond adds to the peaceful country setting. Located in a quiet rural area yet within a short drive to West Plains, this property is ideal for those seeking tranquility without sacrificing convenience. Don't miss this opportunity for a move-in-ready home in the he
Key facts
- Huge pantry
- Central heat and air
- Spacious kitchen
Tags
Neighborhood map
What this means for you Summary
Snapshot
- This is a 3-bed/2.0-bath other listed at $115k.
Deal economics
- At list price, monthly cash flow is $146 ($2k/yr) — positive.
- The deal already cash-flows at list — no discount required.
- To meet the 1% rule (rent ≥ 1% of price), the offer needs to be $111k (3.8% below list).
- Recommended offer: $111k (3.8% below list) — sets the bar for 1% rule.
Location & tenants
- Location reads 46/100 on livability (#955 in MO) — a working-class tenant base; expect higher turnover. Strengths: cost of living A+, crime A; Watch: amenities F, commute F, employment F.
- West Plains R-VII (rural): math 36% / reading 46% proficiency, ranked #152 of 324 in MO (top 47%) — families likely to look elsewhere, expect single-tenant / working-renter base with shorter leases.
- Zoned schools: South Fork Elem. (math 57% / reading 52%, grade C, #190 of 1,115 statewide, top 19%, 159 students, 53% FRL); West Plains Sr. High (math 27% / reading 65%, grade D-, #170 of 521 statewide, top 33%, 1,162 students, 42% FRL).
- Market conditions: 3 active listings in the ZIP; 53 units permitted in Howell County in 2024 (0 in 5+ unit buildings).
Forward outlook
- In year one you build about $4k of equity ($795 loan paydown + $3k appreciation (3.0% local appreciation)).
- Howell County population projected at -18% by 2050 — secular population decline; favor cash flow + early exit over multi-decade hold.
- At projected returns (3.0% appreciation + 3.0% rent growth), your $32k cash investment doubles in ~5 years — after that, you're playing with house money.
- By year 8, paydown + projected appreciation supports a ~$31k cash-out refi (75% LTV) — recoverable capital for the next deal without selling this one.
Negotiation context
- It's been on market 19 days — a 2% lower offer ($113k) is reasonable based on typical stale-listing flexibility.
- 2 sale attempts; this cycle's ask is 10% above the opening price — seller raised mid-cycle; expect resistance to lowballs.
Risks & watch-outs
- Watch-outs: flood insurance adds $56/mo.
- Climate carrying-cost: major flood risk; major wildfire risk — expect insurance premiums to compound above CPI over the hold.
Questions for the listing agent
- What's the actual annual flood-insurance premium (NFIP or private), and is the property in a SFHA with mandatory coverage?
- Is there a deadline driving the sale (1031 exchange, divorce, estate, relocation)? That informs how much negotiation room exists.
- What's the average days-on-market for RENTAL listings here right now (not sales)? A rising rental-DOM trend means longer vacancies and softer asking-rent achievability than the comps imply.
- What's the recent tenant-quality profile in this submarket — average credit score on applications, eviction rate, late-payment / NSF rate, and stable-employment percentage? A property-management company in the area should have these aggregated.
- How much new for-sale + rental construction is in the pipeline within 1–3 miles? Heavy new supply typically softens prices + rents 12–24 months out; constrained supply supports both.
Investment metrics
- 1% rule
- 0.96% ✗
- Cap rate
- 8.39%
- Cash-on-cash
- 7.50%
- DSCR
- 1.33
- GRM
- 8.7
CMA / ARV
No comps found within radius.
Projected returns pro-forma
3.0% appreciation · 3.0% rent growth · sell at horizon
- IRR
- 12.6%
- Equity multiple
- 1.72×
- Total profit
- $23,107
- Equity at exit
- $51,709
- IRR
- 14.6%
- Equity multiple
- 3.15×
- Total profit
- $69,242
- Equity at exit
- $79,690
Cash invested: $32,200 (down + closing). Projections, not guarantees.
Landlord ↔ Tenant lean methodology
- Overall (STATE)
- 81 Strongly Landlord-Friendly
- State Missouri
- 81 Strongly Landlord-Friendly · R+10
- County
- — inherits STATE
- City
- — inherits STATE
ZIP-level market 65777
- Active inventory
- 3
- Price-to-rent
- 8.7×
Monthly cashflow live
- Estimated rent
- $1,106 medium interval (Pro) →
- Mortgage (P&I)
- −$603
- Tax from tax record
- −$22 /mo · $260/yr
- Insurance
- −$48
- Flood insurance flood zone
- −$56 /mo · $666/yr
- HOA
- −$0
- Vacancy / Maint / Mgmt
- −$232
- Net cashflow
- $146
Break-even live
Sensitivity live
| Price | -10% $211 | -5% $178 | +0% $146 | +5% $113 | +10% $81 |
|---|---|---|---|---|---|
| Rent | -10% $58 | -5% $102 | +0% $146 | +5% $189 | +10% $233 |
| Rate | -1.0pp $204 | -0.5pp $175 | base $146 | +0.5pp $116 | +1.0pp $86 |
UW: 25.0% down · 7.5% · 30yr · 1.5% tax · 5.0% vac · 8.0% maint · 8.0% mgmt
Financing live
Cash to close
- Down payment
- $28,750
- Closing costs
- $3,450
- Reserves months
- —
- Total cash needed
- —
Loan-product check · same deal, 3 products live
Conventional
25% down · 7.5% · 30yr
- Down + closing
- —
- Monthly P&I
- —
- Monthly cashflow
- —
- DSCR
- —
- Eligible?
- —
Personal DTI + credit; lowest rate.
DSCR
20% down · 8.5% · 30yr
- Down + closing
- —
- Monthly P&I
- —
- Monthly cashflow
- —
- DSCR
- —
- Eligible?
- —
No personal income docs; deal must DSCR.
Hard money
10% down · 12.0% · 12mo
- Down + closing
- —
- Monthly P&I
- —
- Monthly cashflow
- —
- DSCR
- —
- Eligible?
- —
Short-term bridge; refi at stabilization.
Listing history 7 events
-
2025-06-10status Pending
-
2025-06-06price $115,000
-
2025-05-28status Active
-
2025-03-24status Pending
-
2025-03-17$105,000 Active
-
2009-10-16soldstatus
-
1998-11-03soldstatus
ⓘ Source: listings_history table (triggers on properties + properties_extension) + one-shot
backfill from property_details.listing_events for pre-trigger history.
Tax reassessment forecast MO · Resets to sale price
- Current annual tax
- $260 · $22/mo
- Projected year-2 tax
- $1,116 · $93/mo
- Expected delta
- +$855/yr (+$71/mo · 328.5%)
ⓘ Screening estimate from a state-policy table — verify with the county assessor before closing.
Climate risk First Street
- Flood 7/10 Severe FEMA zone X (unshaded) · 99% chance over 30 yrs
- Wildfire 6/10 Major
- Heat 4/10 Moderate 7 d/yr ≥106°F today · 20 d/yr by 30 yrs out
- Wind 2/10 Low 2% chance of damaging wind over 30 yrs
- Air quality 1/10 Low 0 unhealthy d/yr today · 0 by 30 yrs out
Nearby sold comps map
Loading sold comps map…
Walkable amenities ~0.75 mi
Loading nearby amenities…
Taxation est. · year 1
- Rental income
- $13,274
- − Mortgage interest
- −$6,442
- − Property taxes
- −$260
- − Insurance
- −$1,242
- − Repairs & maintenance
- −$1,062
- − Management
- −$1,062
- − Depreciation
- −$3,345
- Taxable loss
- −$139
- Est. tax savings @ 24.0%
- +$33
- After-tax cash flow
- $1,781/yr
For passive investors: Depreciation is non-cash, so a rental often shows a tax loss while cash-flowing — sheltering income. Rental losses are passive: they offset passive income freely, and up to $25,000/yr can offset ordinary (W-2) income if you actively participate and your MAGI is under $100k (phasing out to $0 by $150k); unused losses carry forward. On sale, claimed depreciation is recaptured at up to 25%, and gains may owe capital-gains tax (a 1031 exchange can defer both). Figures are a year-1 estimate at your 24.0% rate — not tax advice; consult a CPA.
Schools (NCES district)
- District
- West Plains R-VII
- NCES district ID
- 2931680
- Math proficiency
- 36% ▼ -5.00%
- Reading proficiency
- 46% ▲ 1.00%
- Median HH income
- $32,206
- Composite
- 33.59/100
- National rank
- #5419
- State rank
- #152 of 324 in MO
Livability — South Fork
- Score
- 46/100
- State rank
- #955
- US rank
- #26479
Category grades
Schools grade is shown separately in the Schools card above.
Census & demographics
- Population (ZIP)
- 135
Population outlook (Howell County) Hauer SSP2
- Today (2025)
- 38,462 people
- By 2030
- 37,240 · -3.2%
- By 2040
- 34,495 · -10.3%
- By 2050
- 31,450 · -18.2%
- By 2075
- 23,660 · -38.5%
- By 2100
- 16,373 · -57.4%
Race, ethnicity, and origin ACS 2023
- Neighborhood character
- Highly diverse neighborhood (Simpson 0.83)
- Race & ethnicity
- Two or more races 59% White 41%
- Common ancestry
- Subsaharan African 14%
- Foreign-born
- 14%
Political lean MEDSL · Howell
- 2024 margin
- Solid R (+66.8) · D 16.2% · R 83.0%
- 2008→2024 swing
- -36.0pp toward R · 2008: -30.8pp · 2024: -66.8pp
- All cycles
- 2024: R+66.8 2020: R+64.2 2016: R+63.2 2012: R+43.8 2008: R+30.8
Not yet ingested
- Civics
- —
Market trends
- HPI YoY
- —
- Current HPI
- —
- Rent YoY
- —
- Metro
- —
- State GDP YoY
- ▲ 1.84%
- F500 in state
- 20
Industry mix (Fortune 500 HQ in MO)
| Industry | F500 HQs | Revenue |
|---|---|---|
| Healthcare | 1 | $163B |
|
||
| Insurance | 1 | $21B |
|
||
| Industrial Technology | 1 | $17B |
|
||
| Retail | 1 | $16B |
|
||
| Industrial Distribution | 1 | $10B |
|
||
| Utilities | 1 | $9B |
|
||
Price history
+9.5% since first listed7 events — show timeline
- 2025-06-10 Pending — SOMO
- 2025-06-06 Price Changed $115,000 SOMO
- 2025-05-28 Relisted — SOMO
- 2025-03-24 Pending — SOMO
- 2025-03-17 Listed $105,000 SOMO
- 2009-10-16 Sold (Public Records) — Public Records
- 1998-11-03 Sold (Public Records) — Public Records
Property tax history
+4.0%/yrLatest (2025): $260 · +9.6% YoY. Source: county tax records.
Cash-flow waterfall
monthlySold comps — $/sqft
last 12 mo · ≤1 miLoading sold comps…