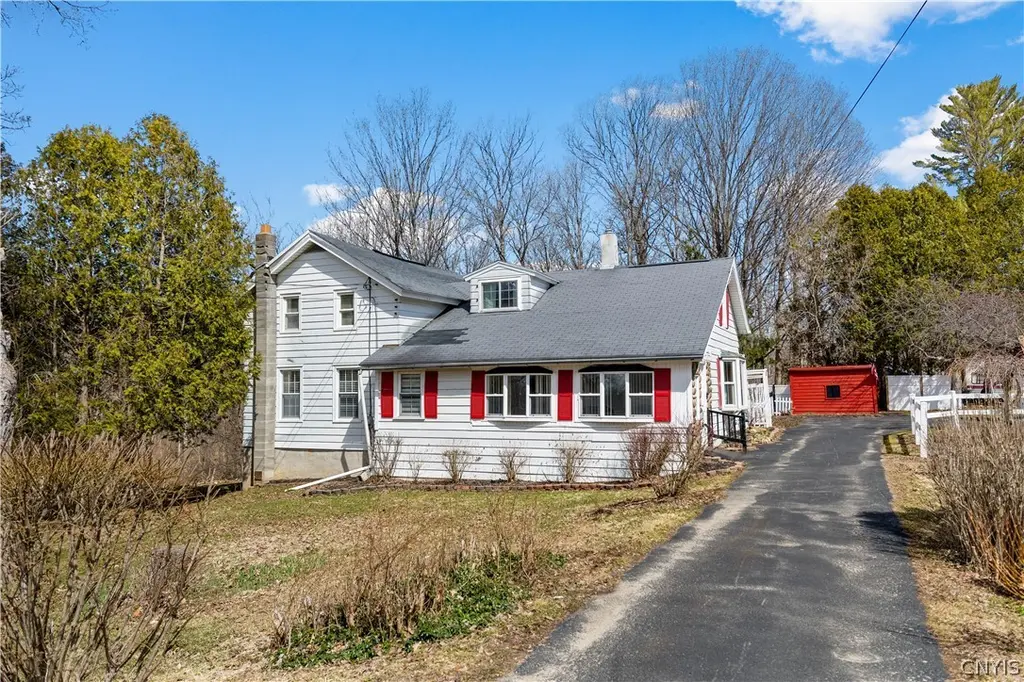
4450 Thieme Gulf Rd · Hamilton College, NY
Flood risk 1/10 · Minimal
- FEMA flood zone
- X (unshaded)
- Chance of flooding over 30 yrs
- 0.0%
- Est. flood insurance / yr
- $473 – $860
Fire risk 1/10 · Minimal
- Est. fire insurance / yr
- $691 – $1,283
Heat risk 2/10 · Minimal
- Hot days now (above 94°F)
- 7 days/yr
- Hot days in 30 yrs
- 17 days/yr
Wind risk 1/10 · Minimal
- Chance of severe wind over 30 yrs
- 0.0%
Air-quality risk 2/10 · Minimal
- Unhealthy air days now
- 0 days/yr
- Unhealthy air days in 30 yrs
- 2 days/yr
Risk factors via First Street. Map © Google.
Why this score? — see what drove the D grade
The composite is a weighted blend of 9 inputs, each scored 0–100. Each bar is that input's sub-score; the figure is the points it added to the 100-point composite (weight × sub-score).
- ARV discount +15.0/15.0
- Appreciation +6.7/10.0
- Schools +5.6/10.0
- Cash flow +4.7/30.0
- Rent growth +2.5/5.0
- Livability +2.5/5.0
- Condition / age +2.5/5.0
- 1% rule +1.3/10.0
- DSCR +0.0/10.0
$199,900
🖨 Deal sheet (PDF) 📄 Offer letter ✓ Due diligence
Listing remarks
Welcome to 4450 Thieme Gulf Road—this charming and well-maintained farmhouse offers the perfect blend of character and comfort. Featuring 4 bedrooms and 2 full bathrooms, including a convenient primary bedroom on the main floor, this home provides a flexible and functional layout. Upon entering, you’re welcomed into a cozy porch area that sets the tone for the warmth found throughout the home. The spacious open floor plan seamlessly connects the dining room and living room, complete with an electric fireplace—perfect for relaxing or entertaining. The kitchen is equipped with an electric freestanding range and refrigerator, offering both practicality and ease. New Water hea
Key facts
- Cozy porch area
- Private backyard
- Electric fireplace
Tags
Neighborhood map
What this means for you Summary
Snapshot
- This is a 3-bed/1.0-bath single-family listed at $200k.
Deal economics
- At list price, monthly cash flow is $-494 ($-6k/yr) — negative.
- To cash-flow at today's rent, offer at most $113k (43.6% below list).
- To meet the 1% rule (rent ≥ 1% of price), the offer needs to be $126k (37.0% below list).
- Recommended offer: $113k (43.6% below list) — sets the bar for cash-flow.
Location & tenants
- Location reads: area grade D — affects rentability + tenant quality, not the cash-flow math above.
- Westmoreland Central School District (rural): math 61% / reading 68% proficiency, ranked #173 of 590 in NY (top 29%) — acceptable for families but not a draw, mixed tenant base, ~2y average lease.
- Zoned schools: Deforest A Hill Primary School (169 students, 0% FRL); Westmoreland Upper Elementary School (math 60% / reading 68%, grade B, #658 of 2,108 statewide, top 31%, 237 students, 0% FRL); Donald H Crane Junior/Senior High School (math 62% / reading 67%, grade B-, #776 of 1,100 statewide, top 73%, 414 students, 0% FRL) — zoned schools average 0% FRL vs 24% district-wide (24 pts lower); this property's tenant base skews higher-income than the district average.
- Market conditions: 16 active listings in the ZIP; 204 units permitted in Oneida County in 2024 (68 in 5+ unit buildings).
Forward outlook
- In year one you build about $8k of equity ($1k loan paydown + $7k appreciation (3.4% local appreciation)).
- Oneida County population projected at -12% by 2050 — secular population decline; favor cash flow + early exit over multi-decade hold.
- By year 5, paydown + projected appreciation supports a ~$35k cash-out refi (75% LTV) — recoverable capital for the next deal without selling this one.
Negotiation context
- It's been on market 63 days — a 6% lower offer ($188k) is reasonable based on typical stale-listing flexibility.
- Current owner paid $155k; 29% above their basis — modest negotiation headroom, anchor on the comps not their cost.
Risks & watch-outs
- Watch-outs: built in 1790 — expect roof / HVAC / electrical / plumbing capex.
Questions for the listing agent
- What do current leases actually rent for vs. the listed asking? Can we see a recent rent roll and the last 12 months of T-12 income?
- It's been on market 63 days. Have you received any prior offers? Is the seller open to a 44% concession, seller financing, or rate buy-down credit?
- Built in 1790 — when were the roof, HVAC, electrical panel, plumbing, and water heater last replaced?
- Why hasn't it sold? Are there any deal-killer items the seller is aware of (foundation, flood, title, zoning, code violations)?
- Is there a deadline driving the sale (1031 exchange, divorce, estate, relocation)? That informs how much negotiation room exists.
- The area grade is low — what's the realistic commute time and amenity access for the typical tenant pool here? Any planned neighborhood developments (good or bad) we should know about?
- What's the average days-on-market for RENTAL listings here right now (not sales)? A rising rental-DOM trend means longer vacancies and softer asking-rent achievability than the comps imply.
- What's the recent tenant-quality profile in this submarket — average credit score on applications, eviction rate, late-payment / NSF rate, and stable-employment percentage? A property-management company in the area should have these aggregated.
- How much new for-sale + rental construction is in the pipeline within 1–3 miles? Heavy new supply typically softens prices + rents 12–24 months out; constrained supply supports both.
Investment metrics
- 1% rule
- 0.63% ✗
- Cap rate
- 3.33%
- Cash-on-cash
- -10.59%
- DSCR
- 0.53
- GRM
- 13.2
CMA / ARV
- ARV (median comp)
- $312,443
- List price
- $199,900
- Delta
- -36.02%
- Verdict
- UNDERPRICED
- Comps
- 11 within 1.0 mi
Show comp detail 1 sale within ~0.75 mi
| Address | Dist | Beds/Ba | Sqft | Sold | Price | $/sf | Match |
|---|---|---|---|---|---|---|---|
| 4450 Thieme Gulf Rd | 0.00mi | 4/2.0 (+1) | 1,539 (0%) | 18mo | $155,000 | $101 | 76 |
Match score weights: distance 35% · size 25% · config 20% · recency 20%. Top-matched comps best support the ARV.
Projected returns pro-forma
3.38% appreciation · 3.0% rent growth · sell at horizon
- IRR
- -1.0%
- Equity multiple
- 0.94×
- Total profit
- $-3,264
- Equity at exit
- $94,168
- IRR
- 3.1%
- Equity multiple
- 1.49×
- Total profit
- $27,702
- Equity at exit
- $148,548
Cash invested: $55,972 (down + closing). Projections, not guarantees.
Landlord ↔ Tenant lean methodology
- Overall (STATE)
- 15 Strongly Tenant-Friendly
- State New York
- 15 Strongly Tenant-Friendly · D+10
- County
- — inherits STATE
- City
- — inherits STATE
ZIP-level market 13476
- Home prices YoY
- 1.2%
- Active inventory
- 16
- Price-to-rent
- 13.2×
Monthly cashflow live
- Estimated rent
- $1,259 medium interval (Pro) →
- Mortgage (P&I)
- −$1,048
- Tax from tax record
- −$357 /mo · $4,281/yr
- Insurance
- −$83
- HOA
- −$0
- Vacancy / Maint / Mgmt
- −$264
- Net cashflow
- $-494
Break-even live
Sensitivity live
| Price | -10% $-381 | -5% $-437 | +0% $-494 | +5% $-550 | +10% $-607 |
|---|---|---|---|---|---|
| Rent | -10% $-593 | -5% $-544 | +0% $-494 | +5% $-444 | +10% $-394 |
| Rate | -1.0pp $-393 | -0.5pp $-443 | base $-494 | +0.5pp $-546 | +1.0pp $-598 |
UW: 25.0% down · 7.5% · 30yr · 1.5% tax · 5.0% vac · 8.0% maint · 8.0% mgmt
Financing live
Cash to close
- Down payment
- $49,975
- Closing costs
- $5,997
- Reserves months
- —
- Total cash needed
- —
Loan-product check · same deal, 3 products live
Conventional
25% down · 7.5% · 30yr
- Down + closing
- —
- Monthly P&I
- —
- Monthly cashflow
- —
- DSCR
- —
- Eligible?
- —
Personal DTI + credit; lowest rate.
DSCR
20% down · 8.5% · 30yr
- Down + closing
- —
- Monthly P&I
- —
- Monthly cashflow
- —
- DSCR
- —
- Eligible?
- —
No personal income docs; deal must DSCR.
Hard money
10% down · 12.0% · 12mo
- Down + closing
- —
- Monthly P&I
- —
- Monthly cashflow
- —
- DSCR
- —
- Eligible?
- —
Short-term bridge; refi at stabilization.
Listing history 14 events
-
2026-06-15status $199,900 Pending 63 DOM
-
2026-06-15days on market $199,900 Active 63 DOM
-
2026-06-14days on market $199,900 Active 61 DOM
-
2026-06-13days on market $199,900 Active 60 DOM
-
2026-06-10pricedays on market $199,900 Active 58 DOM
-
2026-06-09days on market $229,900 Active 57 DOM
-
2026-06-08days on market $229,900 Active 56 DOM
-
2026-06-07days on market $229,900 Active 55 DOM
-
2026-06-03days on market $229,900 Active 51 DOM
-
2026-06-02days on market $229,900 Active 50 DOM
-
2026-06-01pricestatusdays on market $229,900 Active 49 DOM
-
2026-05-14price $232,000
-
2026-03-31$249,500 Active
-
2024-12-23soldstatus $155,000
ⓘ Source: listings_history table (triggers on properties + properties_extension) + one-shot
backfill from property_details.listing_events for pre-trigger history.
Tax reassessment forecast NY · Partial reset (capped growth)
- Current annual tax
- $4,281 · $357/mo
- Projected year-2 tax
- $4,281 · $357/mo
- Expected delta
- $0/yr ($0/mo · 0.0%)
ⓘ Screening estimate from a state-policy table — verify with the county assessor before closing.
Climate risk First Street
- Flood 1/10 Low FEMA zone X (unshaded) · 0% chance over 30 yrs
- Wildfire 1/10 Low
- Heat 2/10 Low 7 d/yr ≥94°F today · 17 d/yr by 30 yrs out
- Wind 1/10 Low 0% chance of damaging wind over 30 yrs
- Air quality 2/10 Low 0 unhealthy d/yr today · 2 by 30 yrs out
Nearby sold comps map
Loading sold comps map…
Walkable amenities ~0.75 mi
Loading nearby amenities…
Taxation est. · year 1
- Rental income
- $15,105
- − Mortgage interest
- −$11,198
- − Property taxes
- −$4,281
- − Insurance
- −$1,000
- − Repairs & maintenance
- −$1,208
- − Management
- −$1,208
- − Depreciation
- −$5,815
- Taxable loss
- −$9,605
- Est. tax savings @ 24.0%
- +$2,305
- After-tax cash flow
- $-3,622/yr
For passive investors: Depreciation is non-cash, so a rental often shows a tax loss while cash-flowing — sheltering income. Rental losses are passive: they offset passive income freely, and up to $25,000/yr can offset ordinary (W-2) income if you actively participate and your MAGI is under $100k (phasing out to $0 by $150k); unused losses carry forward. On sale, claimed depreciation is recaptured at up to 25%, and gains may owe capital-gains tax (a 1031 exchange can defer both). Figures are a year-1 estimate at your 24.0% rate — not tax advice; consult a CPA.
Schools (NCES district)
- District
- Westmoreland Central School District
- NCES district ID
- 3631050
- Math proficiency
- 61% ▼ -1.00%
- Reading proficiency
- 68% ▲ 7.00%
- Median HH income
- $64,671
- Composite
- 56.19/100
- National rank
- #1176
- State rank
- #173 of 590 in NY
Livability — Hamilton College
No livability data for this city. (Only ~50 U.S. cities are tracked.)
Census & demographics
- Population (ZIP)
- 2,540
Population outlook (Oneida County) Hauer SSP2
- Today (2025)
- 225,223 people
- By 2030
- 220,384 · -2.1%
- By 2040
- 209,071 · -7.2%
- By 2050
- 197,920 · -12.1%
- By 2075
- 175,541 · -22.1%
- By 2100
- 148,491 · -34.1%
Race, ethnicity, and origin ACS 2023
- Neighborhood character
- Predominantly White (93%)
- Race & ethnicity
- White 93% Hispanic / Latino 2% Black 2% Two or more races 2%
- Common ancestry
- Romanian 4% Lithuanian 4% Scotch-Irish 2%
- Foreign-born
- 2% · China
- Languages at home
- 96% English-only · Spanish 2% Russian/Polish/Slavic 1% German/W. Germanic 1%
Political lean MEDSL · Oneida
- 2024 margin
- Strong R (+21.3) · D 39.4% · R 60.6%
- 2008→2024 swing
- -15.2pp toward R · 2008: -6.1pp · 2024: -21.3pp
- All cycles
- 2024: R+21.3 2020: R+15.5 2016: R+21.1 2012: R+5.3 2008: R+6.1
Not yet ingested
- Civics
- —
Market trends
- HPI YoY
- ▲ 3.38%
- Current HPI
- 293.015
- Rent YoY
- —
- Metro
- —
- State GDP YoY
- ▲ 2.60%
- F500 in state
- 92
Industry mix (Fortune 500 HQ in NY)
| Industry | F500 HQs | Revenue |
|---|---|---|
| Financial Services | 10 | $950B |
|
||
| Consumer Goods | 9 | $162B |
|
||
| Insurance | 4 | $225B |
|
||
| Telecommunications | 2 | $144B |
|
||
| Pharmaceuticals | 2 | $112B |
|
||
| Media / Entertainment | 2 | $69B |
|
||
Price history
+49.7% since first listed3 events — show timeline
- 2026-05-14 Price Changed $232,000 CNYIS
- 2026-03-31 Listed $249,500 CNYIS
- 2024-12-23 Sold (Public Records) $155,000 Public Records
Property tax history
+7.9%/yrLatest (2025): $4,281 · +14.5% YoY. Source: county tax records.
Cash-flow waterfall
monthlySold comps — $/sqft
last 12 mo · ≤1 miLoading sold comps…