700 Washington Ave N #615 · Minneapolis, MN
Flood risk 3/10 · Minor
- FEMA flood zone
- X (unshaded)
- Chance of flooding over 30 yrs
- 0.12%
- Est. flood insurance / yr
- $507 – $1,088
Fire risk 1/10 · Minimal
- Est. fire insurance / yr
- $888 – $1,650
Heat risk 2/10 · Minimal
- Hot days now (above 99°F)
- 7 days/yr
- Hot days in 30 yrs
- 14 days/yr
Wind risk 2/10 · Minimal
- Chance of severe wind over 30 yrs
- —
Air-quality risk 2/10 · Minimal
- Unhealthy air days now
- 1 days/yr
- Unhealthy air days in 30 yrs
- 1 days/yr
Risk factors via First Street. Map © Google.
Why this score? — see what drove the D grade
The composite is a weighted blend of 9 inputs, each scored 0–100. Each bar is that input's sub-score; the figure is the points it added to the 100-point composite (weight × sub-score).
- ARV discount +15.0/15.0
- Appreciation +4.8/10.0
- Cash flow +4.7/30.0
- Rent growth +3.9/5.0
- Livability +3.9/5.0
- 1% rule +3.6/10.0
- Schools +3.5/10.0
- Condition / age +2.5/5.0
- DSCR +0.0/10.0
$259,900
🖨 Deal sheet (PDF) 📄 Offer letter ✓ Due diligence
Listing remarks MLS
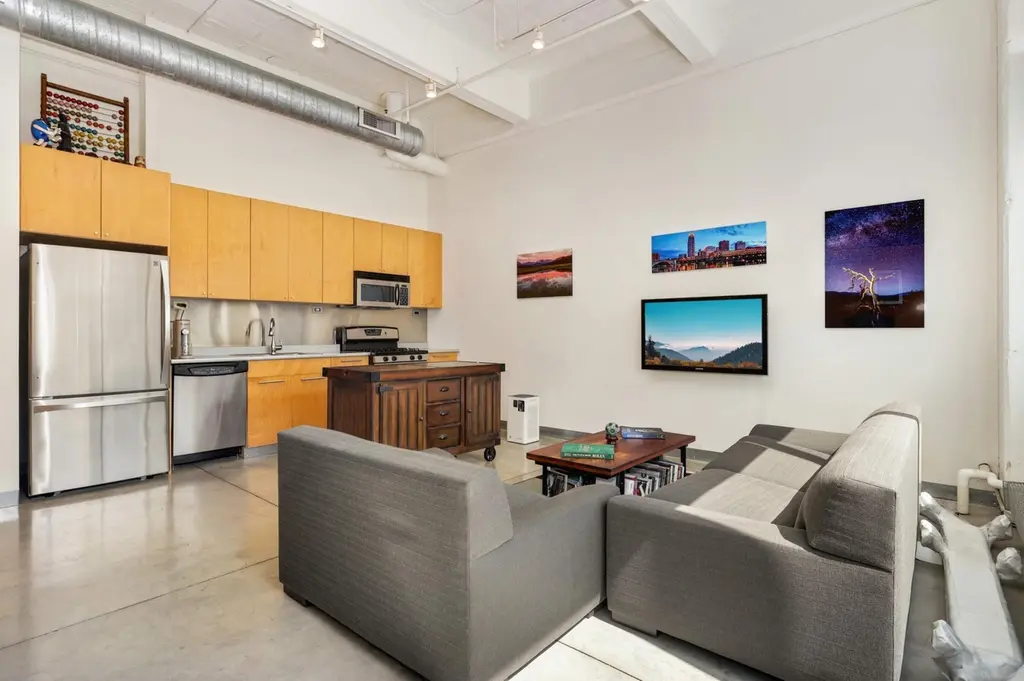
Immerse yourself in the epitome of urban living at Tower Lofts, a stunning loft-style condo nestled in the heart of the Historic North Loop. This exceptional residence seamlessly blends industrial chic with modern sophistication, creating a unique and captivating atmosphere that's sure to impress. Bask in the breathtaking skyline views from the rooftop terrace, where you can relax by the crackling firepits or lounge in the plush seating areas, taking in the vibrant atmosphere of the North Loop neighborhood. Enjoy direct access to the best of the North Loop, with award-winning restaurants, boutique shops, and world-class breweries just steps away. Catch a Twins game at Target Field, or explore the neighborhood's many entertainment options. With heated underground parking, an on-site caretaker, and guest parking, you'll have everything you need to live life to the fullest.
Key facts
- $642 HOA
- Garage
- Built 2004
Neighborhood map
What this means for you Summary
Snapshot
- This is a 1-bed/1.0-bath condo listed at $260k.
Deal economics
- At list price, monthly cash flow is $-649 ($-8k/yr) — negative.
- To cash-flow at today's rent, offer at most $145k (44.1% below list).
- To meet the 1% rule (rent ≥ 1% of price), the offer needs to be $225k (13.5% below list).
- Recommended offer: $145k (44.1% below list) — sets the bar for cash-flow.
Location & tenants
- Location reads 78/100 on livability (#110 in MN, #2,525 nationally) — a middle-class / working-renter tenant base. Strengths: amenities A+, commute A+, housing A+; Watch: cost of living C-, crime F.
- Minneapolis Public School District (urban): math 35% / reading 46% proficiency, ranked #217 of 301 in MN (top 72%) — families likely to look elsewhere, expect single-tenant / working-renter base with shorter leases.
- Zoned schools: Las Estrellas Elementary (math 15% / reading 12%, grade F, #797 of 857 statewide, top 93%, 336 students, 75% FRL); Northeast Middle (math 13% / reading 31%, grade F, #225 of 258 statewide, top 89%, 501 students, 65% FRL); Edison High (math 24% / reading 50%, grade F, #282 of 471 statewide, top 63%, 896 students, 76% FRL).
- Zoned-school proficiency averages 24% at this address vs 40% district-wide (-16 pts) — the specific schools serving this property underperform the Minneapolis Public School District average; the district grade overstates school quality for this exact location.
- Market conditions: Rents rising fast (+5.5%/yr); 159 active listings in the ZIP; 40 comparable units currently listed for rent nearby; rentals leasing fast (median 4d on market — plan ~1-2 weeks tenant-placement turnaround); high-income renter base; 4,651 units permitted in Hennepin County in 2024 (2,443 in 5+ unit buildings).
Forward outlook
- In year one you build about $710 of equity ($2k loan paydown + $-1k appreciation (-0.4% local appreciation)).
- Hennepin County population projected at +30% by 2050 — long-run rental-demand tailwind backs the buy-and-hold thesis.
Negotiation context
- It's been on market 402 days — a 12% lower offer ($229k) is reasonable based on typical stale-listing flexibility.
- 3 sale attempts since 22y ago; this cycle's ask has dropped $50k (16%) from the opening price — seller is motivated, your offer sets the floor, not the list.
- Current owner paid $173k; list at $260k implies a 50% gain — meaningful room to come down on a strong offer.
Risks & watch-outs
- Watch-outs: HOA is 29% of rent.
Questions for the listing agent
- What do current leases actually rent for vs. the listed asking? Can we see a recent rent roll and the last 12 months of T-12 income?
- It's been on market 402 days. Have you received any prior offers? Is the seller open to a 44% concession, seller financing, or rate buy-down credit?
- What does the HOA fee cover, when was the last increase, and are there any pending special assessments or reserve-fund shortfalls?
- Any open or pending special assessments — roof, HVAC, plumbing, elevator, façade? What's the per-unit balance and payoff schedule, and is the seller paying it off at close or rolling it to the buyer?
- Why hasn't it sold? Are there any deal-killer items the seller is aware of (foundation, flood, title, zoning, code violations)?
- Is there a deadline driving the sale (1031 exchange, divorce, estate, relocation)? That informs how much negotiation room exists.
- Crime grade is F in this area — have there been break-ins, vandalism, or insurance claims at this property in the last 3 years? What carrier currently insures it and at what premium?
- The area grade is low — what's the realistic commute time and amenity access for the typical tenant pool here? Any planned neighborhood developments (good or bad) we should know about?
- What's the average days-on-market for RENTAL listings here right now (not sales)? A rising rental-DOM trend means longer vacancies and softer asking-rent achievability than the comps imply.
- What's the recent tenant-quality profile in this submarket — average credit score on applications, eviction rate, late-payment / NSF rate, and stable-employment percentage? A property-management company in the area should have these aggregated.
- How much new apartment / multifamily construction is in the pipeline within 1–3 miles? Heavy new supply (>2% of stock underway) typically softens rents 12–24 months out; light construction supports rent growth.
Investment metrics
- 1% rule
- 0.86% ✗
- Cap rate
- 3.30%
- Cash-on-cash
- -10.70%
- DSCR
- 0.52
- GRM
- 9.6
CMA / ARV
- ARV (median comp)
- $401,551
- List price
- $259,900
- Delta
- -35.28%
- Verdict
- UNDERPRICED
- Comps
- 3 within 1.0 mi
Projected returns pro-forma
-0.42% appreciation · 5.49% rent growth · sell at horizon
- IRR
- -14.4%
- Equity multiple
- 0.34×
- Total profit
- $-47,800
- Equity at exit
- $70,076
- IRR
- -5.1%
- Equity multiple
- 0.45×
- Total profit
- $-39,724
- Equity at exit
- $80,046
Cash invested: $72,772 (down + closing). Projections, not guarantees.
Landlord ↔ Tenant lean methodology
- Overall (CITY)
- 34 Tenant-Leaning
- State Minnesota
- 46 Balanced · D+2
- County
- — inherits STATE
- City Minneapolis
- 34 Tenant-Leaning · D+50
ZIP-level market 55401
- Home prices YoY
- -0.2%
- Rents YoY
- 5.5%
- Active inventory
- 159
- Price-to-rent
- 9.6×
Monthly cashflow live
- Estimated rent
- $2,248 high interval (Pro) →
- Mortgage (P&I)
- −$1,363
- Tax from tax record
- −$311 /mo · $3,734/yr
- Insurance
- −$108
- HOA
- −$642
- Vacancy / Maint / Mgmt
- −$472
- Net cashflow
- $-649
Break-even live
Sensitivity live
| Price | -10% $-502 | -5% $-575 | +0% $-649 | +5% $-722 | +10% $-796 |
|---|---|---|---|---|---|
| Rent | -10% $-826 | -5% $-738 | +0% $-649 | +5% $-560 | +10% $-471 |
| Rate | -1.0pp $-518 | -0.5pp $-583 | base $-649 | +0.5pp $-716 | +1.0pp $-785 |
UW: 25.0% down · 7.5% · 30yr · 1.5% tax · 5.0% vac · 8.0% maint · 8.0% mgmt
Financing live
Cash to close
- Down payment
- $64,975
- Closing costs
- $7,797
- Reserves months
- —
- Total cash needed
- —
Loan-product check · same deal, 3 products live
Conventional
25% down · 7.5% · 30yr
- Down + closing
- —
- Monthly P&I
- —
- Monthly cashflow
- —
- DSCR
- —
- Eligible?
- —
Personal DTI + credit; lowest rate.
DSCR
20% down · 8.5% · 30yr
- Down + closing
- —
- Monthly P&I
- —
- Monthly cashflow
- —
- DSCR
- —
- Eligible?
- —
No personal income docs; deal must DSCR.
Hard money
10% down · 12.0% · 12mo
- Down + closing
- —
- Monthly P&I
- —
- Monthly cashflow
- —
- DSCR
- —
- Eligible?
- —
Short-term bridge; refi at stabilization.
Rent comps 40 comps
| Address | Beds | Baths | Sqft | Rent | $/sqft | DOM | Units | Dist |
|---|---|---|---|---|---|---|---|---|
| 616 N Washington Ave Unit 1571257P Minneapolis, MN | 1.0 | 1.0 | 742 | $4,392 | $5.92 | 0d | 1 | 0.05mi |
| 616 N Washington Ave Unit 1014635P Minneapolis, MN | 1.0 | 1.0 | 742 | $4,168 | $5.62 | 9d | 1 | 0.05mi |
| 616 N Washington Ave Unit 1014633P Minneapolis, MN | 1.0 | 1.0 | 742 | $3,776 | $5.09 | 45d | 1 | 0.05mi |
| 616 N Washington Ave Unit 1014615P Minneapolis, MN | 2.0 | 1.0 | 990 | $4,785 | $4.83 | 5d | 1 | 0.05mi |
| 730 Washington Ave N Minneapolis, MN | 1.0–2.0 | 1.0 | 913 | $2,195 | $2.40 | 5d | 2 | 0.06mi |
| 607 N Washington Ave Minneapolis, MN | 1.0–2.0 | 1.0–2.0 | 845 | $1,855 | $2.20 | 4d | 4 | 0.07mi |
| 608 N 3rd St Minneapolis, MN | 2.0 | 1.0–2.0 | 746 | $2,446 | $3.28 | 1d | 62 | 0.10mi |
| 721 N 3rd St Minneapolis, MN | 3.0 | 1.0–2.0 | 972 | $2,458 | $2.53 | 1d | 12 | 0.11mi |
| 528 Washington Ave N Minneapolis, MN | 1.0 | 1.0 | 543 | $2,629 | $4.84 | 0d | 20 | 0.12mi |
| 815 N 2nd St Minneapolis, MN | 2.0 | 1.0–2.0 | 721 | $1,985 | $2.75 | 3d | 26 | 0.12mi |
| 800 3rd St N Minneapolis, MN | 1.0 | 1.0 | 607 | $1,849 | $3.04 | 3d | 7 | 0.16mi |
| 756 N 4th St Minneapolis, MN | 1.0 | 1.0 | 551 | $1,436 | $2.60 | 3d | 6 | 0.17mi |
| 614 N 1st St Minneapolis, MN | 1.0 | 1.0 | 920 | $1,818 | $1.98 | 9d | 6 | 0.17mi |
| 315 N 7th Ave Minneapolis, MN | 1.0 | 1.0 | 625 | $2,666 | $4.27 | 0d | 12 | 0.18mi |
| 360 N 5th Ave Minneapolis, MN | 2.0 | 1.0–2.5 | 1185 | $4,452 | $3.75 | 0d | 77 | 0.19mi |
| 254 9th Ave N Minneapolis, MN | 1.0 | 1.0 | 922 | $1,937 | $2.10 | 5d | 1 | 0.20mi |
| 432 N 1st St Minneapolis, MN | 1.0–2.0 | 1.0–2.0 | 1067 | $1,395 | $1.31 | 4d | 6 | 0.20mi |
| 915 Washington Ave N Minneapolis, MN | 2.0 | 2.0–2.5 | 1215 | $2,549 | $2.10 | 3d | 5 | 0.21mi |
| 404 Washington Ave N #404 Minneapolis, MN | 1.0 | 1.0 | 1108 | $2,750 | $2.48 | 45d | 1 | 0.21mi |
| 600 N 5th St Minneapolis, MN | 1.0 | 1.0 | 625 | $1,540 | $2.46 | 0d | 10 | 0.25mi |
| 401 N 1st St Minneapolis, MN | — | 1.0 | 531 | $1,282 | $2.41 | 45d | 1 | 0.26mi |
| 337 N Washington Ave Minneapolis, MN | 2.0 | 1.0–2.0 | 796 | $2,114 | $2.65 | 3d | 30 | 0.26mi |
| 1020 N 3rd St Minneapolis, MN | 1.0 | 1.0 | 549 | $1,295 | $2.36 | 1d | 4 | 0.27mi |
| 643 N 5th St Minneapolis, MN | 2.0 | 1.0–2.0 | 796 | $2,073 | $2.60 | 1d | 10 | 0.28mi |
| 316 N 2nd St Minneapolis, MN | 1.0–2.0 | 1.0–2.0 | 795 | $1,417 | $1.78 | 1d | 8 | 0.31mi |
| 360 1st St N Minneapolis, MN | 1.0–2.0 | 1.0–2.0 | 889 | $1,835 | $2.06 | 1d | 10 | 0.32mi |
| 212 N 2nd St Minneapolis, MN | 1.0–2.0 | 1.0–2.0 | 1039 | $2,995 | $2.88 | 26d | 2 | 0.38mi |
| 280 N 2nd St Minneapolis, MN | 1.0 | 1.0 | 1072 | $1,836 | $1.71 | 19d | 2 | 0.40mi |
| 200 2nd Ave N Minneapolis, MN | 2.0 | 1.0 | 994 | $3,135 | $3.15 | 23d | 1 | 0.41mi |
| 120 N 2nd St Minneapolis, MN | 1.0–2.0 | 1.0–2.5 | 1039 | $1,591 | $1.53 | 0d | 17 | 0.44mi |
| 110 N 1st St Minneapolis, MN | 1.0–2.0 | 1.0–2.0 | 885 | $1,719 | $1.94 | 0d | 20 | 0.49mi |
| 270 Hennepin Ave Minneapolis, MN | 3.0 | 1.0–3.0 | 1505 | $4,088 | $2.72 | 1d | 53 | 0.56mi |
| 120 Hennepin Ave Minneapolis, MN | 2.0 | 1.0–2.0 | 960 | $2,590 | $2.70 | 9d | 10 | 0.56mi |
| 111 S Marquette Ave Minneapolis, MN | 1.0–2.0 | 1.0–2.0 | 955 | $1,516 | $1.59 | 1d | 13 | 0.69mi |
| 365 Nicollet Mall Minneapolis, MN | 3.0 | 1.0–3.5 | 1656 | $4,354 | $2.63 | 0d | 35 | 0.72mi |
| 400 Marquette Ave Minneapolis, MN | 3.0 | 1.0–2.0 | 1103 | $2,462 | $2.23 | 0d | 11 | 0.73mi |
| 188 Glenwood Ave Minneapolis, MN | 1.0–3.0 | 1.0–2.0 | 924 | $1,038 | $1.12 | 1d | 5 | 0.73mi |
| 465 Nicollet Mall Minneapolis, MN | 2.0 | 1.0–3.0 | 1153 | $3,050 | $2.65 | 0d | 14 | 0.74mi |
| 829 Marshall St NE Minneapolis, MN | 2.0 | 1.0–2.0 | 697 | $1,925 | $2.76 | 15d | 8 | 0.75mi |
| 115 2nd Ave S Minneapolis, MN | 1.0 | 1.0 | 508 | $1,371 | $2.70 | 0d | 21 | 0.76mi |
HOA detail condo
- Monthly dues
- $642 · $7,704/yr
- Assessments
- None detected in remarks — confirm with the listing agent.
Listing history 25 events
-
2026-06-21days on market $259,900 Active 402 DOM
-
2026-06-18days on market $259,900 Active 399 DOM
-
2026-06-17days on market $259,900 Active 398 DOM
-
2026-06-16days on market $259,900 Active 397 DOM
-
2026-06-15days on market $259,900 Active 396 DOM
-
2026-06-13days on market $259,900 Active 394 DOM
-
2026-06-09days on market $259,900 Active 390 DOM
-
2026-06-08days on market $259,900 Active 389 DOM
-
2026-06-07days on market $259,900 Active 388 DOM
-
2026-06-04days on market $259,900 Active 385 DOM
-
2026-06-03days on market $259,900 Active 384 DOM
-
2026-06-02days on market $259,900 Active 383 DOM
-
2026-06-01days on market $259,900 Active 382 DOM
-
2026-05-31days on market $259,900 Active 381 DOM
-
2026-05-08price $259,900 884-char remark
Show marketing remark (884 chars)
Immerse yourself in the epitome of urban living at Tower Lofts, a stunning loft-style condo nestled in the heart of the Historic North Loop. This exceptional residence seamlessly blends industrial chic with modern sophistication, creating a unique and captivating atmosphere that's sure to impress. Bask in the breathtaking skyline views from the rooftop terrace, where you can relax by the crackling firepits or lounge in the plush seating areas, taking in the vibrant atmosphere of the North Loop neighborhood. Enjoy direct access to the best of the North Loop, with award-winning restaurants, boutique shops, and world-class breweries just steps away. Catch a Twins game at Target Field, or explore the neighborhood's many entertainment options. With heated underground parking, an on-site caretaker, and guest parking, you'll have everything you need to live life to the fullest.
-
2025-09-30price $275,000 884-char remark
Show marketing remark (884 chars)
Immerse yourself in the epitome of urban living at Tower Lofts, a stunning loft-style condo nestled in the heart of the Historic North Loop. This exceptional residence seamlessly blends industrial chic with modern sophistication, creating a unique and captivating atmosphere that's sure to impress. Bask in the breathtaking skyline views from the rooftop terrace, where you can relax by the crackling firepits or lounge in the plush seating areas, taking in the vibrant atmosphere of the North Loop neighborhood. Enjoy direct access to the best of the North Loop, with award-winning restaurants, boutique shops, and world-class breweries just steps away. Catch a Twins game at Target Field, or explore the neighborhood's many entertainment options. With heated underground parking, an on-site caretaker, and guest parking, you'll have everything you need to live life to the fullest.
-
2025-05-16$309,900 Active 884-char remark
Show marketing remark (884 chars)
Immerse yourself in the epitome of urban living at Tower Lofts, a stunning loft-style condo nestled in the heart of the Historic North Loop. This exceptional residence seamlessly blends industrial chic with modern sophistication, creating a unique and captivating atmosphere that's sure to impress. Bask in the breathtaking skyline views from the rooftop terrace, where you can relax by the crackling firepits or lounge in the plush seating areas, taking in the vibrant atmosphere of the North Loop neighborhood. Enjoy direct access to the best of the North Loop, with award-winning restaurants, boutique shops, and world-class breweries just steps away. Catch a Twins game at Target Field, or explore the neighborhood's many entertainment options. With heated underground parking, an on-site caretaker, and guest parking, you'll have everything you need to live life to the fullest.
-
2025-05-15historical $309,900 884-char remark
Show marketing remark (884 chars)
Immerse yourself in the epitome of urban living at Tower Lofts, a stunning loft-style condo nestled in the heart of the Historic North Loop. This exceptional residence seamlessly blends industrial chic with modern sophistication, creating a unique and captivating atmosphere that's sure to impress. Bask in the breathtaking skyline views from the rooftop terrace, where you can relax by the crackling firepits or lounge in the plush seating areas, taking in the vibrant atmosphere of the North Loop neighborhood. Enjoy direct access to the best of the North Loop, with award-winning restaurants, boutique shops, and world-class breweries just steps away. Catch a Twins game at Target Field, or explore the neighborhood's many entertainment options. With heated underground parking, an on-site caretaker, and guest parking, you'll have everything you need to live life to the fullest.
-
2010-08-03soldstatus $173,000
-
2010-07-30soldstatus $173,000 204-char remark
Show marketing remark (204 chars)
Only a few blocks from light rail, bus rout, twin stadium and steps to restaurant this top floor, true historic loft offers 13 ft ceilings, exposed brick and large expansive windows. Low association fees.
-
2010-07-12historical 204-char remark
Show marketing remark (204 chars)
Only a few blocks from light rail, bus rout, twin stadium and steps to restaurant this top floor, true historic loft offers 13 ft ceilings, exposed brick and large expansive windows. Low association fees.
-
2010-03-19$174,900 204-char remark
Show marketing remark (204 chars)
Only a few blocks from light rail, bus rout, twin stadium and steps to restaurant this top floor, true historic loft offers 13 ft ceilings, exposed brick and large expansive windows. Low association fees.
-
2005-08-30soldstatus $198,700
-
2004-11-02historical
-
2004-11-02$198,700
ⓘ Source: listings_history table (triggers on properties + properties_extension) + one-shot
backfill from property_details.listing_events for pre-trigger history.
Tax reassessment forecast MN · Partial reset (capped growth)
- Current annual tax
- $3,734 · $311/mo
- Projected year-2 tax
- $3,734 · $311/mo
- Expected delta
- $0/yr ($0/mo · 0.0%)
ⓘ Screening estimate from a state-policy table — verify with the county assessor before closing.
Climate risk First Street
- Flood 3/10 Moderate FEMA zone X (unshaded) · 12% chance over 30 yrs
- Wildfire 1/10 Low
- Heat 2/10 Low 7 d/yr ≥99°F today · 14 d/yr by 30 yrs out
- Wind 2/10 Low
- Air quality 2/10 Low 1 unhealthy d/yr today · 1 by 30 yrs out
Nearby sold comps map
Loading sold comps map…
Walkable amenities ~0.75 mi
Loading nearby amenities…
Taxation est. · year 1
- Rental income
- $26,972
- − Mortgage interest
- −$14,558
- − Property taxes
- −$3,734
- − Insurance
- −$1,300
- − Repairs & maintenance
- −$2,158
- − Management
- −$2,158
- − HOA
- −$7,704
- − Depreciation
- −$7,561
- Taxable loss
- −$12,201
- Est. tax savings @ 24.0%
- +$2,928
- After-tax cash flow
- $-4,857/yr
For passive investors: Depreciation is non-cash, so a rental often shows a tax loss while cash-flowing — sheltering income. Rental losses are passive: they offset passive income freely, and up to $25,000/yr can offset ordinary (W-2) income if you actively participate and your MAGI is under $100k (phasing out to $0 by $150k); unused losses carry forward. On sale, claimed depreciation is recaptured at up to 25%, and gains may owe capital-gains tax (a 1031 exchange can defer both). Figures are a year-1 estimate at your 24.0% rate — not tax advice; consult a CPA.
Schools (NCES district)
- District
- Minneapolis Public School District
- NCES district ID
- 2721240
- Math proficiency
- 35% ▼ -7.00%
- Reading proficiency
- 46% ▼ -1.00%
- Median HH income
- $50,521
- Composite
- 34.92/100
- National rank
- #5067
- State rank
- #217 of 301 in MN
Livability — Minneapolis
- Score
- 78/100
- State rank
- #110
- US rank
- #2525
Category grades
Schools grade is shown separately in the Schools card above.
Census & demographics
- Census place
- Minneapolis, MN
- County
- Hennepin County · 1,150,272 people
- City population
- 417,555
- Metro
- Minneapolis-St. Paul-Bloomington, MN-WI
- Population (ZIP)
- 11,816
- Household income
- $113,522
- Rent vs Own
- Severe rent burden
- 610.0
Population outlook (Hennepin County) Hauer SSP2
- Today (2025)
- 1,405,227 people
- By 2030
- 1,492,650 · +6.2%
- By 2040
- 1,660,157 · +18.1%
- By 2050
- 1,823,498 · +29.8%
- By 2075
- 2,221,283 · +58.1%
- By 2100
- 2,509,976 · +78.6%
Race, ethnicity, and origin ACS 2023
- Neighborhood character
- Predominantly White (75%)
- Race & ethnicity
- White 75% Asian 9% Hispanic / Latino 8% Two or more races 6% Black 5%
- Hispanic origin (detail)
- Mexican 4%
- Common ancestry
- Portuguese 10% Romanian 7% Lithuanian 5%
- Foreign-born
- 13% · Canada, China, South Korea
- Languages at home
- 86% English-only · Spanish 6% Other Indo-European 3% Chinese 2%
Political lean MEDSL · Hennepin
- 2024 margin
- Solid D (+42.6) · D 70.2% · R 27.5% · Other 2.3%
- 2008→2024 swing
- +14.0pp toward D · 2008: 28.6pp · 2024: 42.6pp
- All cycles
- 2024: D+42.6 2020: D+43.2 2016: D+35.3 2012: D+27.1 2008: D+28.6
Not yet ingested
- Civics
- —
Market trends
- HPI YoY
- ▼ -0.42%
- Current HPI
- 233.936
- Rent YoY
- ▲ 5.49%
- Metro
- Minneapolis-St. Paul-Bloomington, MN-WI
- State GDP YoY
- ▲ 2.41%
- F500 in state
- 34
Industry mix (Fortune 500 HQ in MN)
| Industry | F500 HQs | Revenue |
|---|---|---|
| Healthcare | 2 | $407B |
|
||
| Retail | 2 | $150B |
|
||
| Consumer Goods | 2 | $32B |
|
||
| Industrial Machinery | 2 | $6B |
|
||
| Agriculture | 1 | $40B |
|
||
| Healthcare / Medical Devices | 1 | $32B |
|
||
Price history
+30.8% since first listed11 events — show timeline
- 2026-05-08 Price Changed $259,900 NORTHSTARMLS as Distributed by MLS Grid
- 2025-09-30 Price Changed $275,000 NORTHSTARMLS as Distributed by MLS Grid
- 2025-05-16 Listed $309,900 NORTHSTARMLS as Distributed by MLS Grid
- 2025-05-15 Coming Soon $309,900 NORTHSTARMLS as Distributed by MLS Grid
- 2010-08-03 Sold (Public Records) $173,000 Public Records
- 2010-07-30 Sold (MLS) $173,000 NORTHSTARMLS as Distributed by MLS Grid
- 2010-07-12 Listing Removed — NORTHSTARMLS as Distributed by MLS Grid
- 2010-03-19 Listed $174,900 NORTHSTARMLS as Distributed by MLS Grid
- 2005-08-30 Sold (MLS) $198,700 NORTHSTARMLS as Distributed by MLS Grid
- 2004-11-02 Listed $198,700 NORTHSTARMLS as Distributed by MLS Grid
- 2004-11-02 Listing Removed — NORTHSTARMLS as Distributed by MLS Grid
Property tax history
+3.0%/yrLatest (2025): $3,734 · +7.5% YoY. Source: county tax records.
Cash-flow waterfall
monthlySold comps — $/sqft
last 12 mo · ≤1 miLoading sold comps…