 Multi-family
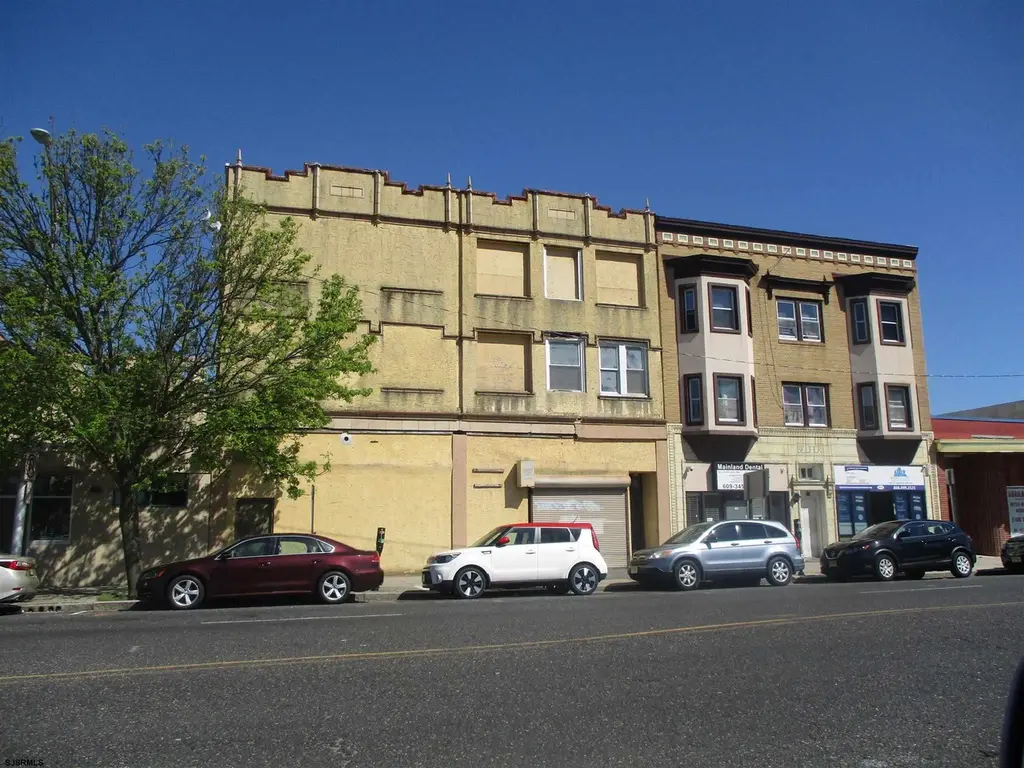
925 Atlantic Ave · Atlantic City, NJ
Flood risk 8/10 · Major
- FEMA flood zone
- AE
- Chance of flooding over 30 yrs
- 0.99%
- Est. flood insurance / yr
- $1,737 – $8,500
Fire risk 1/10 · Minimal
- Est. fire insurance / yr
- $526 – $976
Heat risk 9/10 · Severe
- Hot days now (above 94°F)
- 8 days/yr
- Hot days in 30 yrs
- 18 days/yr
Wind risk 8/10 · Major
- Chance of severe wind over 30 yrs
- 80.0%
Air-quality risk 3/10 · Minor
- Unhealthy air days now
- 2 days/yr
- Unhealthy air days in 30 yrs
- 3 days/yr
Risk factors via First Street. Map © Google.
Why this score? — see what drove the C+ grade
The composite is a weighted blend of 9 inputs, each scored 0–100. Each bar is that input's sub-score; the figure is the points it added to the 100-point composite (weight × sub-score).
- Cash flow +27.9/30.0
- DSCR +9.9/10.0
- 1% rule +7.6/10.0
- ARV discount +7.5/15.0
- Rent growth +3.9/5.0
- Livability +2.8/5.0
- Condition / age +2.5/5.0
- Schools +1.4/10.0
- Appreciation +0.0/10.0
$1,350,000
🖨 Deal sheet 📄 Offer letter ✓ Due diligence
Multi-family units
County records classify this as Multi-Family (5+ Unit). Listing-text estimate: 1 unit. estimate disagrees with records
5+ unit building — per-unit beds/baths from public records are typically unavailable; the breakdown below (if shown) is an estimate from the listing text.
Listing remarks MLS
Approved Green Zone! 1 Block to new Indoor Island Waterpark! Massive building with limitless potential, Super LOW Taxes! Located in the CBD zone, in the very heart of the city! Just one block to the Hardrock, Steel Pier, Ocean Casino, Resorsts, Margaritaville, and Showboat Casinos, and just 2 blocks to the worlds most famous beach and boardwalk! Close to Tanger Outlets, Gardners Basin, Borgate, Harrahs, Golden Nugget, Little Water Distillery, Back Bay Alehouse, The Seed Brewery, & Farley Marina. Building features two commercial spaces each of which are over 3000 square feet, over 6000 sqft combined. The top two floors are framed up to fit 8 three bedrooms and 4 one bedroom residential units. All the heavy lifting has been done, the property has been fully gutted done to the brickwork, all asbestos removed, the building is structurally sound, all new windows throughout, all new flooring joists, all floors are level, and all framed up for 12 residential units. Pro-forma and floor plans are available upon request. Private financing available to Investors with appropriate collateral!! Showings can be on Thursday afternoons only. Buy now with a few Bitcoins!
Key facts
- 3 parking spots
- Listed 818 days
Neighborhood map
What this means for you Summary
Snapshot
- This is a multifamily listed at $1.35M.
Deal economics
- At list price, monthly cash flow is $4k ($45k/yr) — positive.
- The deal already cash-flows at list — no discount required.
- Meets the 1% rule at list price ($17k rent vs $1.35M).
- Recommended offer: $1.19M (12.0% below list) — sets the bar for market timing.
- Cap rate 10.0% vs local median 3.7% in Atlantic City — top-decile yield for the area; either an underpriced asset or a hidden risk that comps aren't pricing in. Stress-test before assuming the spread holds.
Location & tenants
- Location reads 55/100 on livability (#525 in NJ) — a working-class tenant base; expect higher turnover. Strengths: health & safety A; Watch: commute D, schools F, crime F.
- Atlantic City School District (urban): math 9% / reading 26% proficiency, ranked #454 of 472 in NJ (top 96%) — low school quality limits family demand, transient renter base, plan for 1-2y turnover; 85% free/reduced lunch — lower-income household profile, screen leases tightly.
- Market conditions: Rents rising fast (+5.5%/yr); 482 active listings in the ZIP; lower-income renter base — watch delinquency; 672 units permitted in Atlantic County in 2024 (258 in 5+ unit buildings).
- At $17,072/mo this rent would consume 498% of the median local household income ($41k/yr) (locally 3414% of renters already pay >50% of income on rent) — very limited rent-growth headroom before tenants either downsize or default.
Forward outlook
- Local home prices are declining (-3.0%/yr); year-one equity from $9k of loan paydown is wiped out by about $40k of value loss. Plan a longer hold.
- Atlantic County population projected at -12% by 2050 — secular population decline; favor cash flow + early exit over multi-decade hold.
- At projected returns (-3.0% appreciation + 5.5% rent growth), your $378k cash investment doubles in ~8 years — after that, you're playing with house money.
Negotiation context
- It's been on market 819 days — a 12% lower offer ($1.19M) is reasonable based on typical stale-listing flexibility.
- 5 sale attempts since 5y ago; this cycle's ask has dropped $150k (10%) from the opening price — seller is motivated, your offer sets the floor, not the list.
- Current owner paid $205k; list at $1.35M implies a 559% gain — meaningful room to come down on a strong offer.
Risks & watch-outs
- Watch-outs: flood insurance adds $427/mo; built in 1920 — expect roof / HVAC / electrical / plumbing capex.
- Climate carrying-cost: in FEMA flood zone AE (mandatory federal flood insurance); severe wind risk, 80% chance of damaging wind over 30y; extreme-heat days projected 8→18/yr by 2055 (HVAC capex compounding) — expect insurance premiums to compound above CPI over the hold.
Questions for the listing agent
- It's been on market 819 days. Have you received any prior offers? Is the seller open to a 12% concession, seller financing, or rate buy-down credit?
- Built in 1920 — when were the roof, HVAC, electrical panel, plumbing, and water heater last replaced?
- What's the actual annual flood-insurance premium (NFIP or private), and is the property in a SFHA with mandatory coverage?
- Why hasn't it sold? Are there any deal-killer items the seller is aware of (foundation, flood, title, zoning, code violations)?
- Is there a deadline driving the sale (1031 exchange, divorce, estate, relocation)? That informs how much negotiation room exists.
- Schools are F-rated, which usually means shorter tenancies and higher turnover. Who's the typical renter profile here, and what's been the actual vacancy rate?
- Crime grade is F in this area — have there been break-ins, vandalism, or insurance claims at this property in the last 3 years? What carrier currently insures it and at what premium?
- What's the average days-on-market for RENTAL listings here right now (not sales)? A rising rental-DOM trend means longer vacancies and softer asking-rent achievability than the comps imply.
- What's the recent tenant-quality profile in this submarket — average credit score on applications, eviction rate, late-payment / NSF rate, and stable-employment percentage? A property-management company in the area should have these aggregated.
- How much new apartment / multifamily construction is in the pipeline within 1–3 miles? Heavy new supply (>2% of stock underway) typically softens rents 12–24 months out; light construction supports rent growth.
Investment metrics
- 1% rule
- 1.26% ✓
- Cap rate
- 9.99%
- Cash-on-cash
- 13.20%
- DSCR
- 1.59
- GRM
- 6.6
CMA / ARV
No comps found within radius.
Projected returns pro-forma
-3.0% appreciation · 5.52% rent growth · sell at horizon
- IRR
- 4.2%
- Equity multiple
- 1.17×
- Total profit
- $63,753
- Equity at exit
- $201,289
- IRR
- 16.0%
- Equity multiple
- 2.47×
- Total profit
- $555,343
- Equity at exit
- $116,723
Cash invested: $378,000 (down + closing). Projections, not guarantees.
Landlord ↔ Tenant lean methodology
- Overall (STATE)
- 21 Tenant-Leaning
- State New Jersey
- 21 Tenant-Leaning · D+6
- County
- — inherits STATE
- City
- — inherits STATE
ZIP-level market 08401
- Home prices YoY
- -7.0%
- Rents YoY
- 5.5%
- Active inventory
- 482
- Price-to-rent
- 45.4×
Monthly cashflow live
- Estimated rent
- $17,072 high interval (Pro) →
- Mortgage (P&I)
- −$7,080
- Tax est. 1.5%
- −$1,688 /mo · $20,250/yr
- Insurance
- −$562
- Flood insurance flood zone
- −$427 /mo · $5,118/yr
- HOA
- −$0
- Vacancy / Maint / Mgmt
- −$3,585
- Net cashflow
- $3,731
Break-even live
8-unit breakdown (identical units grouped — click to expand)
| Units | Beds | Baths | Est. rent |
|---|---|---|---|
| 4× units | 3 | 1 | $9,904 |
| #1 | 3 | 1 | $2,476 |
| #2 | 3 | 1 | $2,476 |
| #3 | 3 | 1 | $2,476 |
| #4 | 3 | 1 | $2,476 |
| 4× units | 1 | 1 | $7,168 |
| #5 | 1 | 1 | $1,792 |
| #6 | 1 | 1 | $1,792 |
| #7 | 1 | 1 | $1,792 |
| #8 | 1 | 1 | $1,792 |
| Total (8 units) | $17,072 | ||
UW: 25.0% down · 7.5% · 30yr · 1.5% tax · 5.0% vac · 8.0% maint · 8.0% mgmt
Financing live
Cash to close
- Down payment
- $337,500
- Closing costs
- $40,500
- Reserves months
- —
- Total cash needed
- —
Loan-product check · same deal, 3 products live
Conventional
25% down · 7.5% · 30yr
- Down + closing
- —
- Monthly P&I
- —
- Monthly cashflow
- —
- DSCR
- —
- Eligible?
- —
Personal DTI + credit; lowest rate.
DSCR
20% down · 8.5% · 30yr
- Down + closing
- —
- Monthly P&I
- —
- Monthly cashflow
- —
- DSCR
- —
- Eligible?
- —
No personal income docs; deal must DSCR.
Hard money
10% down · 12.0% · 12mo
- Down + closing
- —
- Monthly P&I
- —
- Monthly cashflow
- —
- DSCR
- —
- Eligible?
- —
Short-term bridge; refi at stabilization.
Listing history 28 events
-
2026-06-19days on market $1,350,000 Active 819 DOM
-
2026-06-18days on market $1,350,000 Active 818 DOM
-
2026-06-17days on market $1,350,000 Active 817 DOM
-
2026-06-16days on market $1,350,000 Active 816 DOM
-
2026-06-15days on market $1,350,000 Active 815 DOM
-
2026-06-14days on market $1,350,000 Active 813 DOM
-
2026-06-13days on market $1,350,000 Active 812 DOM
-
2026-06-10days on market $1,350,000 Active 810 DOM
-
2026-06-09days on market $1,350,000 Active 809 DOM
-
2026-06-08days on market $1,350,000 Active 808 DOM
-
2026-06-07days on market $1,350,000 Active 807 DOM
-
2026-06-02days on market $1,350,000 Active 802 DOM
-
2026-06-01days on market $1,350,000 Active 801 DOM
-
2026-05-31days on market $1,350,000 Active 800 DOM
-
2026-05-30days on market $1,350,000 Active 799 DOM
-
2025-12-03price $1,350,000 1176-char remark
Show marketing remark (1176 chars)
Approved Green Zone! 1 Block to new Indoor Island Waterpark! Massive building with limitless potential, Super LOW Taxes! Located in the CBD zone, in the very heart of the city! Just one block to the Hardrock, Steel Pier, Ocean Casino, Resorsts, Margaritaville, and Showboat Casinos, and just 2 blocks to the worlds most famous beach and boardwalk! Close to Tanger Outlets, Gardners Basin, Borgate, Harrahs, Golden Nugget, Little Water Distillery, Back Bay Alehouse, The Seed Brewery, & Farley Marina. Building features two commercial spaces each of which are over 3000 square feet, over 6000 sqft combined. The top two floors are framed up to fit 8 three bedrooms and 4 one bedroom residential units. All the heavy lifting has been done, the property has been fully gutted done to the brickwork, all asbestos removed, the building is structurally sound, all new windows throughout, all new flooring joists, all floors are level, and all framed up for 12 residential units. Pro-forma and floor plans are available upon request. Private financing available to Investors with appropriate collateral!! Showings can be on Thursday afternoons only. Buy now with a few Bitcoins!
-
2024-03-22$1,500,000 Active 1176-char remark
Show marketing remark (1176 chars)
Approved Green Zone! 1 Block to new Indoor Island Waterpark! Massive building with limitless potential, Super LOW Taxes! Located in the CBD zone, in the very heart of the city! Just one block to the Hardrock, Steel Pier, Ocean Casino, Resorsts, Margaritaville, and Showboat Casinos, and just 2 blocks to the worlds most famous beach and boardwalk! Close to Tanger Outlets, Gardners Basin, Borgate, Harrahs, Golden Nugget, Little Water Distillery, Back Bay Alehouse, The Seed Brewery, & Farley Marina. Building features two commercial spaces each of which are over 3000 square feet, over 6000 sqft combined. The top two floors are framed up to fit 8 three bedrooms and 4 one bedroom residential units. All the heavy lifting has been done, the property has been fully gutted done to the brickwork, all asbestos removed, the building is structurally sound, all new windows throughout, all new flooring joists, all floors are level, and all framed up for 12 residential units. Pro-forma and floor plans are available upon request. Private financing available to Investors with appropriate collateral!! Showings can be on Thursday afternoons only. Buy now with a few Bitcoins!
-
2023-09-01historical 1047-char remark
Show marketing remark (1047 chars)
Approved Green Zone! 1 Block to new Waterpark! Massive building with limitless potential, Super LOW Taxes! Located in the CBD zone, in the very heart of the city! Just one block to the Hardrock, Ocean, and Showboat Casinos and the site of the new Indoor Waterpark coming soon and just 2 blocks to the worlds most famous beach and boardwalk! Building features two commercial spaces each of which are over 3000 square feet, over 6000 sqft combined. The top two floors are framed up to fit 8 three bedrooms and 4 one bedroom residential units. All the heavy lifting has been done, the property has been fully gutted done to the brickwork, all asbestos removed, the building is structurally sound, all new windows throughout, all new flooring joists, all floors are level, and all framed up for 12 residential units. Pro-forma and floor plans are available upon request. Purchase this property with your Crypto Currency!! Showings can be on Thursday afternoons only. Buy now with a few Bitcoins or ask about Private Financing Available Starting at 10%
-
2023-04-28$1,300,000 Active 1047-char remark
Show marketing remark (1047 chars)
Approved Green Zone! 1 Block to new Waterpark! Massive building with limitless potential, Super LOW Taxes! Located in the CBD zone, in the very heart of the city! Just one block to the Hardrock, Ocean, and Showboat Casinos and the site of the new Indoor Waterpark coming soon and just 2 blocks to the worlds most famous beach and boardwalk! Building features two commercial spaces each of which are over 3000 square feet, over 6000 sqft combined. The top two floors are framed up to fit 8 three bedrooms and 4 one bedroom residential units. All the heavy lifting has been done, the property has been fully gutted done to the brickwork, all asbestos removed, the building is structurally sound, all new windows throughout, all new flooring joists, all floors are level, and all framed up for 12 residential units. Pro-forma and floor plans are available upon request. Purchase this property with your Crypto Currency!! Showings can be on Thursday afternoons only. Buy now with a few Bitcoins or ask about Private Financing Available Starting at 10%
-
2023-01-01historical
-
2022-07-22$1,100,000 Active
-
2022-06-20historical
-
2022-01-19price $1,250,000
-
2021-11-18$999,000 Active
-
2021-08-01historical
-
2021-04-29$799,000 Active
-
2003-02-28soldstatus $205,000
-
1985-10-01soldstatus $200,000
ⓘ Source: listings_history table (triggers on properties + properties_extension) + one-shot
backfill from property_details.listing_events for pre-trigger history.
Climate risk First Street
- Flood 8/10 Severe FEMA zone AE · 99% chance over 30 yrs
- Wildfire 1/10 Low
- Heat 9/10 Extreme 8 d/yr ≥94°F today · 18 d/yr by 30 yrs out
- Wind 8/10 Severe 80% chance of damaging wind over 30 yrs
- Air quality 3/10 Moderate 2 unhealthy d/yr today · 3 by 30 yrs out
Nearby sold comps map
Loading sold comps map…
Walkable amenities ~0.75 mi
Loading nearby amenities…
Taxation est. · year 1
- Rental income
- $204,864
- − Mortgage interest
- −$75,621
- − Property taxes
- −$20,250
- − Insurance
- −$11,868
- − Repairs & maintenance
- −$16,389
- − Management
- −$16,389
- − Depreciation
- −$39,273
- Taxable income
- $25,074
- Est. tax owed @ 24.0%
- −$6,018
- After-tax cash flow
- $38,752/yr
For passive investors: Depreciation is non-cash, so a rental often shows a tax loss while cash-flowing — sheltering income. Rental losses are passive: they offset passive income freely, and up to $25,000/yr can offset ordinary (W-2) income if you actively participate and your MAGI is under $100k (phasing out to $0 by $150k); unused losses carry forward. On sale, claimed depreciation is recaptured at up to 25%, and gains may owe capital-gains tax (a 1031 exchange can defer both). Figures are a year-1 estimate at your 24.0% rate — not tax advice; consult a CPA.
Schools (NCES district)
- District
- Atlantic City School District
- NCES district ID
- 3400960
- Math proficiency
- 9% ▼ -12.00%
- Reading proficiency
- 26% ▼ -6.00%
- Median HH income
- $27,842
- Composite
- 13.66/100
- National rank
- #9504
- State rank
- #454 of 472 in NJ
Livability — Atlantic City
- Score
- 55/100
- State rank
- #525
- US rank
- #23095
Category grades
Schools grade is shown separately in the Schools card above.
Census & demographics
- Census place
- Atlantic City, NJ
- County
- Atlantic County · 143,611 people
- City population
- 38,925
- Metro
- Atlantic City-Hammonton, NJ
- Population (ZIP)
- 38,925
- Household income
- $41,126
- Rent vs Own
- Severe rent burden
- 3414.0
Population outlook (Atlantic County) Hauer SSP2
- Today (2025)
- 268,948 people
- By 2030
- 264,497 · -1.7%
- By 2040
- 252,261 · -6.2%
- By 2050
- 237,846 · -11.6%
- By 2075
- 210,650 · -21.7%
- By 2100
- 180,234 · -33.0%
Race, ethnicity, and origin ACS 2023
- Neighborhood character
- Highly diverse neighborhood (Simpson 0.75)
- Race & ethnicity
- Hispanic / Latino 32% Black 32% Asian 16% White 16% Two or more races 11% Native American 2%
- Hispanic origin (detail)
- Mexican 10% Puerto Rican 8% Dominican 8%
- Common ancestry
- Romanian 1% Scotch-Irish 1%
- Foreign-born
- 29% · Canada, Vietnam, Jamaica
- Languages at home
- 52% English-only · Spanish 30% Other Indo-European 8% Vietnamese 3%
Political lean MEDSL · Atlantic
- 2024 margin
- Toss-up / Even · D 47.7% · R 50.7% · Other 1.6%
- 2008→2024 swing
- -18.1pp toward R · 2008: 15.1pp · 2024: -3.0pp
- All cycles
- 2024: R+3.0 2020: D+6.7 2016: D+6.2 2012: D+17.2 2008: D+15.1
Not yet ingested
- Civics
- —
Market trends
- HPI YoY
- ▼ -26.82%
- Current HPI
- 353.7827
- Rent YoY
- ▲ 5.52%
- Metro
- Atlantic City-Hammonton, NJ
- State GDP YoY
- ▲ 2.05%
- F500 in state
- 34
Industry mix (Fortune 500 HQ in NJ)
| Industry | F500 HQs | Revenue |
|---|---|---|
| Consumer Goods | 3 | $31B |
|
||
| Pharmaceuticals | 2 | $153B |
|
||
| Technology | 2 | $21B |
|
||
| Insurance | 2 | $20B |
|
||
| Healthcare | 2 | $19B |
|
||
| Financial Services | 1 | $70B |
|
||
Price history
+575.0% since first listed13 events — show timeline
- 2025-12-03 Price Changed $1,350,000 SJSRMLS
- 2024-03-22 Listed $1,500,000 SJSRMLS
- 2023-09-01 Listing Removed — SJSRMLS
- 2023-04-28 Listed $1,300,000 SJSRMLS
- 2023-01-01 Listing Removed — SJSRMLS
- 2022-07-22 Listed $1,100,000 SJSRMLS
- 2022-06-20 Listing Removed — SJSRMLS
- 2022-01-19 Price Changed $1,250,000 SJSRMLS
- 2021-11-18 Listed $999,000 SJSRMLS
- 2021-08-01 Listing Removed — SJSRMLS
- 2021-04-29 Listed $799,000 SJSRMLS
- 2003-02-28 Sold (Public Records) $205,000 Public Records
- 1985-10-01 Sold (Public Records) $200,000 Public Records
Property tax history
-14.2%/yrLatest (2025): $2,542 · -2.1% YoY. Source: county tax records.
Cash-flow waterfall
monthlySold comps — $/sqft
last 12 mo · ≤1 miLoading sold comps…