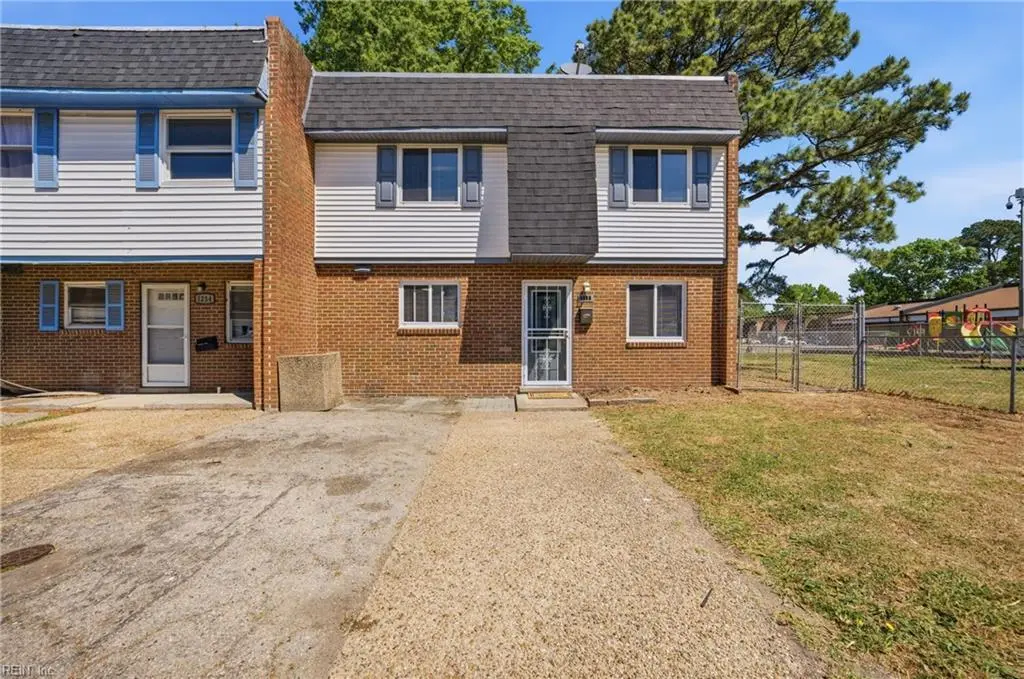
1236 Curie Ct · Norfolk, VA
Flood risk 1/10 · Minimal
- FEMA flood zone
- X (unshaded)
- Chance of flooding over 30 yrs
- 0.0%
- Est. flood insurance / yr
- $507 – $1,088
Fire risk 1/10 · Minimal
- Est. fire insurance / yr
- $666 – $1,236
Heat risk 9/10 · Severe
- Hot days now (above 105°F)
- 7 days/yr
- Hot days in 30 yrs
- 16 days/yr
Wind risk 8/10 · Major
- Chance of severe wind over 30 yrs
- 80.0%
Air-quality risk 3/10 · Minor
- Unhealthy air days now
- 2 days/yr
- Unhealthy air days in 30 yrs
- 3 days/yr
Risk factors via First Street. Map © Google.
Why this score? — see what drove the C- grade
The composite is a weighted blend of 9 inputs, each scored 0–100. Each bar is that input's sub-score; the figure is the points it added to the 100-point composite (weight × sub-score).
- Cash flow +19.0/30.0
- ARV discount +8.5/15.0
- DSCR +6.0/10.0
- 1% rule +4.7/10.0
- Livability +4.2/5.0
- Schools +3.5/10.0
- Rent growth +3.4/5.0
- Condition / age +2.5/5.0
- Appreciation +0.0/10.0
$225,000
🖨 Deal sheet 📄 Offer letter ✓ Due diligence
Listing remarks
Freshly painted end-unit townhouse tucked away on a cul-de-sac, offering 4 bedrooms and 2 full baths. Recent updates include HVAC and roof (2019) and a brand-new water heater (2025). Stylish laminate/LVP flooring flows throughout, adding both durability and modern appeal. This home features generous closet space, a private driveway for off-street parking, and a backyard patio great for relaxing or entertaining. Storage shed included! Conveniently located near military bases, interstates, and shopping, making everyday living and commuting a breeze.
Key facts
- Recent updates
- Backyard patio
- Private driveway
Tags
Property features AI
Finance
- HOA & community: Part of Wellington Oaks Homeowners Association; HOA fee $33 monthly; Trash pickup included
Exterior
- Parking: Multiple off-street parking spaces; Driveway parking
- Utilities: City/County water; City/County sewer; Gas water heater
- Home design: Attached townhouse; End unit; 2 stories; Two living levels; Slab foundation
- Construction: Vinyl siding
- Exterior features: Corner lot; Cul-de-sac location; Patio; Back yard fenced with chain-link fence; Storage shed
Interior
- Kitchen: Dishwasher; Microwave; Gas range; Refrigerator
- Bedrooms: No bedroom with full bathroom on first floor
- Flooring: Laminate
- Bathrooms: 2 full bathrooms
- Heating & cooling: Natural gas heating; Central air conditioning
- Interior features: Ceiling fan; Window treatments; Assigned storage; Breakfast area
- Laundry & utility: Washer hookup; Dryer hookup
Neighborhood map
What this means for you Summary
Snapshot
- This is a 4-bed/2.0-bath townhouse listed at $225k.
Deal economics
- At list price, monthly cash flow is $235 ($3k/yr) — positive.
- The deal already cash-flows at list — no discount required.
- To meet the 1% rule (rent ≥ 1% of price), the offer needs to be $219k (2.8% below list).
- Recommended offer: $219k (2.8% below list) — sets the bar for 1% rule.
- Cap rate 7.5% vs local median 4.0% in Norfolk — top-decile yield for the area; either an underpriced asset or a hidden risk that comps aren't pricing in. Stress-test before assuming the spread holds.
Location & tenants
- Location reads 83/100 on livability (#43 in VA, #1,026 nationally) — a professional / high-income tenant draw. Strengths: amenities A+, commute A+, health & safety A+; Watch: employment C-, crime F.
- Norfolk City Public School District (urban): math 27% / reading 56% proficiency, ranked #118 of 131 in VA (top 90%) — families likely to look elsewhere, expect single-tenant / working-renter base with shorter leases.
- Zoned schools: Tanners Creek Elementary (math 15% / reading 38%, grade F, #1,041 of 1,108 statewide, top 94%, 530 students, 98% FRL); Norview High (math 33% / reading 85%, grade C+, #256 of 319 statewide, top 81%, 1,915 students, 97% FRL) — zoned schools average 97% FRL vs 59% district-wide (39 pts higher); higher-poverty schools than district average — tighter screening recommended.
- Market conditions: Rents rising (+3.4%/yr); 132 active listings in the ZIP; 22 comparable units currently listed for rent nearby; rentals at typical pace (median 24d on market — plan ~3-4 weeks tenant-placement turnaround); 45% of comp listings sitting > 30 days — soft ceiling on asking rent; 438 units permitted in Norfolk city in 2024 (273 in 5+ unit buildings).
- This rent runs 38% of the median local income ($68k/yr) — at the standard rent-burdened threshold; future hikes will face affordability resistance.
Forward outlook
- Local home prices are declining (-3.0%/yr); year-one equity from $2k of loan paydown is wiped out by about $7k of value loss. Plan a longer hold.
Negotiation context
- Only 13 days on market — expect competitive offers; lowballing is unlikely to land.
- 3 sale attempts since 7y ago with the ask held roughly flat each time — persistent listings suggest the price (not the market) is what's stuck; bring a comps-based counter.
- Current owner paid $38k; list at $225k implies a 492% gain — meaningful room to come down on a strong offer.
Risks & watch-outs
- Climate carrying-cost: severe wind risk, 80% chance of damaging wind over 30y; extreme-heat days projected 7→16/yr by 2055 (HVAC capex compounding) — expect insurance premiums to compound above CPI over the hold.
Questions for the listing agent
- Built in 1974 — when were the roof, HVAC, electrical panel, plumbing, and water heater last replaced?
- What does the HOA fee cover, when was the last increase, and are there any pending special assessments or reserve-fund shortfalls?
- Is there a deadline driving the sale (1031 exchange, divorce, estate, relocation)? That informs how much negotiation room exists.
- Schools are A-rated — typically a magnet for longer-tenancy family renters. What's the average tenant stay here, and is there a school-zone premium baked into asking?
- Crime grade is F in this area — have there been break-ins, vandalism, or insurance claims at this property in the last 3 years? What carrier currently insures it and at what premium?
- What's the average days-on-market for RENTAL listings here right now (not sales)? A rising rental-DOM trend means longer vacancies and softer asking-rent achievability than the comps imply.
- What's the recent tenant-quality profile in this submarket — average credit score on applications, eviction rate, late-payment / NSF rate, and stable-employment percentage? A property-management company in the area should have these aggregated.
- How much new for-sale + rental construction is in the pipeline within 1–3 miles? Heavy new supply typically softens prices + rents 12–24 months out; constrained supply supports both.
Investment metrics
- 1% rule
- 0.97% ✗
- Cap rate
- 7.55%
- Cash-on-cash
- 4.48%
- DSCR
- 1.20
- GRM
- 8.6
CMA / ARV
- ARV (on-the-fly)
- $230,115
- Comps found
- 6
Show comp detail 6 sales within ~0.75 mi
| Address | Dist | Beds/Ba | Sqft | Sold | Price | $/sf | Match |
|---|---|---|---|---|---|---|---|
| 1236 Curie Ct | 0.00mi | 4/2.0 | 1,587 (0%) | 1mo | $230,000 | $145 | 99 |
| 1203 Curie Ct | 0.07mi | 3/2.0 (-1) | 1,572 (-1%) | 4mo | $218,000 | $139 | 87 |
| 6510 Diesel Ct | 0.12mi | 4/1.5 | 1,400 (-12%) | 3mo | $214,000 | $153 | 70 |
| 1436 E Tanners Creek Dr | 0.34mi | 3/2.5 (-1) | 1,408 (-11%) | 1mo | $215,000 | $153 | 58 |
| 6922 Bonnot Dr | 0.58mi | 4/1.5 | 1,656 (+4%) | 12mo | $232,000 | $140 | 53 |
| 1485 Longdale Dr | 0.42mi | 3/2.5 (-1) | 1,408 (-11%) | 7mo | $200,000 | $142 | 49 |
Match score weights: distance 35% · size 25% · config 20% · recency 20%. Top-matched comps best support the ARV.
Projected returns pro-forma
-3.0% appreciation · 3.42% rent growth · sell at horizon
- IRR
- -8.9%
- Equity multiple
- 0.67×
- Total profit
- $-20,564
- Equity at exit
- $33,548
- IRR
- 1.1%
- Equity multiple
- 1.08×
- Total profit
- $5,193
- Equity at exit
- $19,454
Cash invested: $63,000 (down + closing). Projections, not guarantees.
Landlord ↔ Tenant lean methodology
- Overall (STATE)
- 55 Moderately Landlord-Leaning
- State Virginia
- 55 Moderately Landlord-Leaning · D+2
- County
- — inherits STATE
- City
- — inherits STATE
ZIP-level market 23513
- Home prices YoY
- -9.3%
- Rents YoY
- 3.4%
- Active inventory
- 132
- Price-to-rent
- 8.6×
Monthly cashflow live
- Estimated rent
- $2,187 high interval (Pro) →
- Mortgage (P&I)
- −$1,180
- Tax from tax record
- −$186 /mo · $2,235/yr
- Insurance
- −$94
- HOA
- −$33
- Vacancy / Maint / Mgmt
- −$459
- Net cashflow
- $235
Break-even live
UW: 25.0% down · 7.5% · 30yr · 1.5% tax · 5.0% vac · 8.0% maint · 8.0% mgmt
Financing live
Cash to close
- Down payment
- $56,250
- Closing costs
- $6,750
- Reserves months
- —
- Total cash needed
- —
Loan-product check · same deal, 3 products live
Conventional
25% down · 7.5% · 30yr
- Down + closing
- —
- Monthly P&I
- —
- Monthly cashflow
- —
- DSCR
- —
- Eligible?
- —
Personal DTI + credit; lowest rate.
DSCR
20% down · 8.5% · 30yr
- Down + closing
- —
- Monthly P&I
- —
- Monthly cashflow
- —
- DSCR
- —
- Eligible?
- —
No personal income docs; deal must DSCR.
Hard money
10% down · 12.0% · 12mo
- Down + closing
- —
- Monthly P&I
- —
- Monthly cashflow
- —
- DSCR
- —
- Eligible?
- —
Short-term bridge; refi at stabilization.
Rent comps 22 comps
| Address | Beds | Baths | Sqft | Rent | $/sqft | DOM | Units | Dist |
|---|---|---|---|---|---|---|---|---|
| 6430 Faraday Ct Norfolk, VA | 4.0 | 1.5 | 1319 | $1,995 | $1.51 | 43d | 1 | 0.06mi |
| 6451 Edward St Norfolk, VA | 3.0 | 2.5 | 1400 | $2,000 | $1.43 | 7d | 1 | 0.22mi |
| 6261 Alexander St Norfolk, VA | 5.0 | 2.0 | 2166 | $2,495 | $1.15 | 43d | 1 | 0.30mi |
| 1232 Norview Ave Unit NOR1232R-EA Norfolk, VA | 3.0 | 2.0 | 1106 | $1,600 | $1.45 | 43d | 1 | 0.49mi |
| 6450 Crescent Way Norfolk, VA | 1.0–3.0 | 1.0–2.0 | 1128 | $2,369 | $2.10 | 2d | 23 | 0.51mi |
| 6975 Bonnot Dr Norfolk, VA | 3.0 | 1.5 | 1188 | $1,700 | $1.43 | 43d | 1 | 0.64mi |
| 3819 Pamlico Cir Norfolk, VA | 3.0 | 1.0 | 1250 | $2,000 | $1.60 | 12d | 1 | 0.74mi |
| 6419 Grimes Ave Norfolk, VA | 3.0 | 2.0 | 1225 | $2,150 | $1.76 | 43d | 1 | 0.90mi |
| 941 Avenue G Unit G Norfolk, VA | 4.0 | 2.5 | 2029 | $2,600 | $1.28 | 3d | 1 | 0.91mi |
| 837 Tifton St Norfolk, VA | 3.0 | 2.0 | 1072 | $2,300 | $2.15 | 23d | 1 | 0.98mi |
| 946 Avenue H Norfolk, VA | 4.0 | 2.0 | 1980 | $750 | $0.38 | 43d | 1 | 1.07mi |
| 7120 Clarion Ln Norfolk, VA | 4.0 | 2.0 | 1506 | $2,300 | $1.53 | 17d | 1 | 1.10mi |
| 1831 Banning Rd Norfolk, VA | 3.0 | 2.0 | 1853 | $2,500 | $1.35 | 4d | 1 | 1.11mi |
| 3541 Chesapeake Blvd Norfolk, VA | 5.0 | 1.0 | 1476 | $1,275 | $0.86 | 7d | 1 | 1.19mi |
| 3461 Gamage Dr Norfolk, VA | 3.0 | 2.0 | 1300 | $2,300 | $1.77 | 43d | 1 | 1.24mi |
| 3504 Chesapeake Blvd Norfolk, VA | 3.0 | 2.0 | 1624 | $1,995 | $1.23 | 43d | 1 | 1.28mi |
| 3504 Chesapeake Blvd Norfolk, VA | 3.0 | 2.0 | 1624 | $1,995 | $1.23 | 23d | 1 | 1.28mi |
| 4563 Shoshone Ct Norfolk, VA | 3.0 | 2.0 | 1600 | $2,500 | $1.56 | 43d | 1 | 1.31mi |
| 3477 E Bonner Dr Norfolk, VA | 3.0 | 1.0 | 1304 | $2,000 | $1.53 | 23d | 1 | 1.36mi |
| 3653 Nottaway St Norfolk, VA | 3.0 | 1.5 | 1564 | $2,200 | $1.41 | 17d | 1 | 1.41mi |
| 8028 Glade Rd Norfolk, VA | 4.0 | 2.5 | 2061 | $2,900 | $1.41 | 43d | 1 | 1.42mi |
| 3640 Robin Hood Rd Norfolk, VA | 4.0 | 2.5 | 1400 | $2,999 | $2.14 | 17d | 1 | 1.48mi |
HOA detail
- Monthly dues
- $33 · $396/yr
- Likely covers
- water
Listing history 12 events
-
2026-05-04status Under Contract
-
2026-04-24historical Active Under Contract
-
2026-04-21$225,000 Active
-
2024-05-06historical
-
2024-04-22historical Active Under Contract
-
2024-04-12status Under Contract
-
2024-04-10$160,000 Active
-
2019-01-21historical
-
2019-01-10$80,000 Active
-
2015-11-16soldstatus $38,000
-
2005-11-22soldstatus $81,100
-
1987-11-30soldstatus $51,900
ⓘ Source: listings_history table (triggers on properties + properties_extension) + one-shot
backfill from property_details.listing_events for pre-trigger history.
Tax reassessment forecast VA · Resets to sale price
- Current annual tax
- $2,235 · $186/mo
- Projected year-2 tax
- $2,235 · $186/mo
- Expected delta
- $0/yr ($0/mo · 0.0%)
ⓘ Screening estimate from a state-policy table — verify with the county assessor before closing.
Climate risk First Street
- Flood 1/10 Low FEMA zone X (unshaded) · 0% chance over 30 yrs
- Wildfire 1/10 Low
- Heat 9/10 Extreme 7 d/yr ≥105°F today · 16 d/yr by 30 yrs out
- Wind 8/10 Severe 80% chance of damaging wind over 30 yrs
- Air quality 3/10 Moderate 2 unhealthy d/yr today · 3 by 30 yrs out
Nearby sold comps map
Loading sold comps map…
Walkable amenities ~0.75 mi
Loading nearby amenities…
Taxation est. · year 1
- Rental income
- $26,248
- − Mortgage interest
- −$12,603
- − Property taxes
- −$2,235
- − Insurance
- −$1,125
- − Repairs & maintenance
- −$2,100
- − Management
- −$2,100
- − HOA
- −$396
- − Depreciation
- −$6,545
- Taxable loss
- −$856
- Est. tax savings @ 24.0%
- +$206
- After-tax cash flow
- $3,027/yr
For passive investors: Depreciation is non-cash, so a rental often shows a tax loss while cash-flowing — sheltering income. Rental losses are passive: they offset passive income freely, and up to $25,000/yr can offset ordinary (W-2) income if you actively participate and your MAGI is under $100k (phasing out to $0 by $150k); unused losses carry forward. On sale, claimed depreciation is recaptured at up to 25%, and gains may owe capital-gains tax (a 1031 exchange can defer both). Figures are a year-1 estimate at your 24.0% rate — not tax advice; consult a CPA.
Schools (NCES district)
- District
- Norfolk City Public School District
- NCES district ID
- 5102670
- Math proficiency
- 27% ▼ -44.00%
- Reading proficiency
- 56% ▼ -10.00%
- Median HH income
- $44,358
- Composite
- 35.08/100
- National rank
- #5026
- State rank
- #118 of 131 in VA
Livability — Norfolk
- Score
- 83/100
- State rank
- #43
- US rank
- #1026
Category grades
Schools grade is shown separately in the Schools card above.
Census & demographics
- Census place
- Norfolk, VA
- County
- Norfolk City · 214,042 people
- City population
- 214,042
- Metro
- Virginia Beach-Norfolk-Newport News, VA-NC
- Population (ZIP)
- 28,628
- Household income
- $68,380
- Rent vs Own
- Severe rent burden
- 1342.0
Population outlook (Norfolk County) Hauer SSP2
- Today (2025)
- 249,032 people
- By 2030
- 252,347 · +1.3%
- By 2040
- 253,644 · +1.9%
- By 2050
- 251,913 · +1.2%
- By 2075
- 245,281 · -1.5%
- By 2100
- 219,548 · -11.8%
Race, ethnicity, and origin ACS 2023
- Neighborhood character
- Diverse neighborhood (Simpson 0.63)
- Race & ethnicity
- Black 55% White 23% Hispanic / Latino 11% Two or more races 7% Asian 5%
- Hispanic origin (detail)
- Mexican 4% Puerto Rican 3%
- Common ancestry
- Romanian 1% Slovak 1% Lithuanian 0%
- Foreign-born
- 10% · Canada
- Languages at home
- 87% English-only · Spanish 6% Tagalog/Filipino 4% French/Haitian/Cajun 1%
Political lean MEDSL · Norfolk
- 2024 margin
- Solid D (+41.5) · D 70.0% · R 28.5% · Other 1.6%
- 2008→2024 swing
- -1.4pp toward R · 2008: 43.0pp · 2024: 41.5pp
- All cycles
- 2024: D+41.5 2020: D+45.6 2016: D+42.0 2012: D+44.0 2008: D+43.0
Not yet ingested
- Civics
- —
Market trends
- HPI YoY
- ▼ -33.67%
- Current HPI
- 329.2241
- Rent YoY
- ▲ 3.42%
- Metro
- Virginia Beach-Norfolk-Newport News, VA-NC
- State GDP YoY
- ▲ 2.40%
- F500 in state
- 50
Industry mix (Fortune 500 HQ in VA)
| Industry | F500 HQs | Revenue |
|---|---|---|
| Aerospace / Defense | 4 | $236B |
|
||
| Technology / Defense | 3 | $32B |
|
||
| Financial Services | 2 | $176B |
|
||
| Utilities | 2 | $27B |
|
||
| Insurance | 2 | $25B |
|
||
| Technology | 2 | $15B |
|
||
Price history
+333.5% since first listed12 events — show timeline
- 2026-05-04 Pending — REINMLS
- 2026-04-24 Contingent — REINMLS
- 2026-04-21 Listed $225,000 REINMLS
- 2024-05-06 Listing Removed — REINMLS
- 2024-04-22 Contingent — REINMLS
- 2024-04-12 Pending — REINMLS
- 2024-04-10 Listed $160,000 REINMLS
- 2019-01-21 Listing Removed — REINMLS
- 2019-01-10 Listed $80,000 REINMLS
- 2015-11-16 Sold (Public Records) $38,000 Public Records
- 2005-11-22 Sold (Public Records) $81,100 Public Records
- 1987-11-30 Sold (Public Records) $51,900 Public Records
Property tax history
+4.1%/yrLatest (2025): $2,235 · +6.9% YoY. Source: county tax records.
Cash-flow waterfall
monthlySold comps — $/sqft
last 12 mo · ≤1 miLoading sold comps…