13175 158th St N · Jupiter Farms, FL
Flood risk 4/10 · Minor
- FEMA flood zone
- X (unshaded)
- Chance of flooding over 30 yrs
- 0.22%
- Est. flood insurance / yr
- $507 – $1,088
Fire risk 3/10 · Minor
- Est. fire insurance / yr
- $947 – $1,759
Heat risk 9/10 · Severe
- Hot days now (above 107°F)
- 7 days/yr
- Hot days in 30 yrs
- 22 days/yr
Wind risk 10/10 · Severe
- Chance of severe wind over 30 yrs
- 99.0%
Air-quality risk 1/10 · Minimal
- Unhealthy air days now
- 0 days/yr
- Unhealthy air days in 30 yrs
- 0 days/yr
Risk factors via First Street. Map © Google.
Why this score? — see what drove the D- grade
The composite is a weighted blend of 9 inputs, each scored 0–100. Each bar is that input's sub-score; the figure is the points it added to the 100-point composite (weight × sub-score).
- Cash flow +10.9/30.0
- ARV discount +7.5/15.0
- Schools +4.3/10.0
- 1% rule +3.7/10.0
- Livability +3.3/5.0
- DSCR +3.2/10.0
- Rent growth +2.5/5.0
- Condition / age +2.5/5.0
- Appreciation +0.0/10.0
$650,000
🖨 Deal sheet (PDF) 📄 Offer letter ✓ Due diligence
Listing remarks
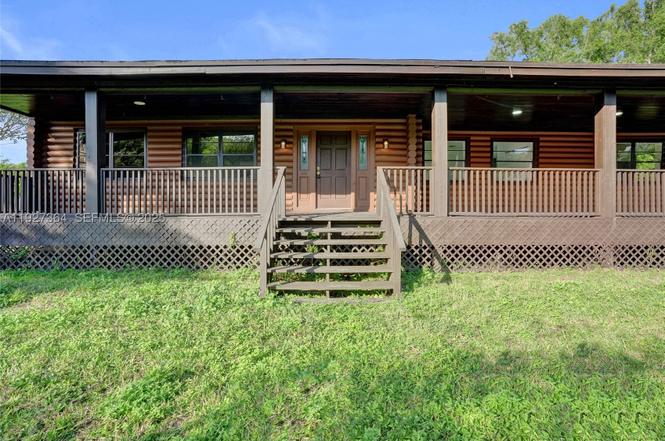
Escape to this stunning log ranch in North Jupiter, set on a private 1.15-acre parcel. This spacious 4-bedroom, 3-bath home features open living areas, a recently renovated kitchen and bathrooms, and a dramatic stone fireplace in the living room, with an additional fireplace in the primary suite. A solid detached structure provides endless possibilities for guest space, studio, storage, etc. The expansive south-facing porch is ideal for gathering and enjoying the natural surroundings. Outdoors, relax by the in-ground pool with a surrounding deck designed for entertaining. Conveniently located near beaches, dining, shopping, and major roadways. This property offers privacy, flexibility, and
Key facts
- In-ground pool
- Detached structure
- South-facing porch
Tags
Property features AI
Finance
- Other: Zoning: AR; Lot features: One to two acres
- Financial info: Pets allowed (conditional; restrictions or possible restrictions)
- HOA & community: Laundry facilities in community; Park in community
Exterior
- Parking: Driveway (unpaved)
- Utilities: Cable available; Septic tank; Well water
- Home design: Single-story; Faces south; Stone and wood siding exterior; Shingle roof; Effective year built
- Construction: Stone and wood siding construction; Shingle roof; Effective year built
- Exterior features: Balcony; Fence; Porch; Open patio; Patio; Pool
Interior
- Kitchen: Dishwasher; Microwave; Refrigerator
- Bedrooms: Bedroom on main level
- Flooring: Carpet; Ceramic tile
- Bathrooms: 3 full bathrooms
- Heating & cooling: Central heating (electric); Central air; Wall/window unit(s); Has heating; Has cooling
- Interior features: Blinds; Breakfast area; Eat-in kitchen; Family/Dining room; Fireplace; Split bedroom floor plan; Vaulted ceilings; Atrium; Workshop; Bedroom on main level; Unfurnished
- Laundry & utility: Laundry tub; Water softener (owned); Electric water heater
Neighborhood map
What this means for you Summary
Snapshot
- This is a 4-bed/3.0-bath single-family listed at $650k.
Deal economics
- At list price, monthly cash flow is $-284 ($-3k/yr) — negative.
- To cash-flow at today's rent, offer at most $600k (7.7% below list).
- To meet the 1% rule (rent ≥ 1% of price), the offer needs to be $563k (13.4% below list).
- Recommended offer: $563k (13.4% below list) — sets the bar for 1% rule.
Location & tenants
- Location reads 66/100 on livability (#617 in FL) — a middle-class / working-renter tenant base. Strengths: crime A+, employment A+, housing A+; Watch: amenities F, commute F, cost of living F.
- Palm Beach (suburban): math 46% / reading 53% proficiency, ranked #34 of 73 in FL (top 47%) — families likely to look elsewhere, expect single-tenant / working-renter base with shorter leases.
- Zoned schools: Jupiter Farms Elementary School (math 83% / reading 82%, grade A+, #70 of 2,144 statewide, top 4%, 624 students, 21% FRL); Watson B. Duncan Middle School (math 54% / reading 59%, grade B, #171 of 571 statewide, top 30%, 1,157 students, 41% FRL); Jupiter High School (math 56% / reading 64%, grade C+, #106 of 667 statewide, top 16%, 3,087 students, 28% FRL) — zoned schools average 30% FRL vs 52% district-wide (22 pts lower); this property's tenant base skews higher-income than the district average.
- Zoned-school proficiency averages 66% at this address vs 50% district-wide (+17 pts) — the actual schools serving this property are materially stronger than the Palm Beach average implies; a family-tenant draw the district grade alone would hide.
- Market conditions: 125 active listings in the ZIP; 3 comparable units currently listed for rent nearby; rentals at typical pace (median 26d on market — plan ~3-4 weeks tenant-placement turnaround); 3,974 units permitted in Palm Beach County in 2024 (1,012 in 5+ unit buildings).
Forward outlook
- Local home prices are declining (-3.0%/yr); year-one equity from $4k of loan paydown is wiped out by about $20k of value loss. Plan a longer hold.
- Palm Beach County population projected at +30% by 2050 — long-run rental-demand tailwind backs the buy-and-hold thesis.
Negotiation context
- It's been on market 123 days — a 12% lower offer ($572k) is reasonable based on typical stale-listing flexibility.
- 6 sale attempts since 13y ago; this cycle's ask has dropped $140k (18%) from the opening price — seller is motivated, your offer sets the floor, not the list.
- Current owner paid $450k; 44% above their basis — modest negotiation headroom, anchor on the comps not their cost.
Risks & watch-outs
- Climate carrying-cost: severe wind risk, 99% chance of damaging wind over 30y; extreme-heat days projected 7→22/yr by 2055 (HVAC capex compounding) — expect insurance premiums to compound above CPI over the hold.
Questions for the listing agent
- What do current leases actually rent for vs. the listed asking? Can we see a recent rent roll and the last 12 months of T-12 income?
- It's been on market 123 days. Have you received any prior offers? Is the seller open to a 13% concession, seller financing, or rate buy-down credit?
- Why hasn't it sold? Are there any deal-killer items the seller is aware of (foundation, flood, title, zoning, code violations)?
- Is there a deadline driving the sale (1031 exchange, divorce, estate, relocation)? That informs how much negotiation room exists.
- Schools are D-rated, which usually means shorter tenancies and higher turnover. Who's the typical renter profile here, and what's been the actual vacancy rate?
- The area grade is low — what's the realistic commute time and amenity access for the typical tenant pool here? Any planned neighborhood developments (good or bad) we should know about?
- What's the average days-on-market for RENTAL listings here right now (not sales)? A rising rental-DOM trend means longer vacancies and softer asking-rent achievability than the comps imply.
- What's the recent tenant-quality profile in this submarket — average credit score on applications, eviction rate, late-payment / NSF rate, and stable-employment percentage? A property-management company in the area should have these aggregated.
- How much new for-sale + rental construction is in the pipeline within 1–3 miles? Heavy new supply typically softens prices + rents 12–24 months out; constrained supply supports both.
Investment metrics
- 1% rule
- 0.87% ✗
- Cap rate
- 5.77%
- Cash-on-cash
- -1.87%
- DSCR
- 0.92
- GRM
- 9.6
CMA / ARV
No comps found within radius.
Projected returns pro-forma
-3.0% appreciation · 3.0% rent growth · sell at horizon
- IRR
- -19.3%
- Equity multiple
- 0.32×
- Total profit
- $-123,163
- Equity at exit
- $96,917
- IRR
- -12.0%
- Equity multiple
- 0.29×
- Total profit
- $-129,570
- Equity at exit
- $56,200
Cash invested: $182,000 (down + closing). Projections, not guarantees.
Landlord ↔ Tenant lean methodology
- Overall (STATE)
- 87 Strongly Landlord-Friendly
- State Florida
- 87 Strongly Landlord-Friendly · R+3
- County
- — inherits STATE
- City
- — inherits STATE
ZIP-level market 33478
- Active inventory
- 125
- Price-to-rent
- 9.6×
Monthly cashflow live
- Estimated rent
- $5,630 medium interval (Pro) →
- Mortgage (P&I)
- −$3,409
- Tax from tax record
- −$1,052 /mo · $12,619/yr
- Insurance
- −$271
- HOA
- −$0
- Vacancy / Maint / Mgmt
- −$1,182
- Net cashflow
- $-284
Break-even live
Sensitivity live
| Price | -10% $84 | -5% $-100 | +0% $-284 | +5% $-468 | +10% $-652 |
|---|---|---|---|---|---|
| Rent | -10% $-728 | -5% $-506 | +0% $-284 | +5% $-61 | +10% $161 |
| Rate | -1.0pp $44 | -0.5pp $-118 | base $-284 | +0.5pp $-452 | +1.0pp $-623 |
UW: 25.0% down · 7.5% · 30yr · 1.5% tax · 5.0% vac · 8.0% maint · 8.0% mgmt
Financing live
Cash to close
- Down payment
- $162,500
- Closing costs
- $19,500
- Reserves months
- —
- Total cash needed
- —
Loan-product check · same deal, 3 products live
Conventional
25% down · 7.5% · 30yr
- Down + closing
- —
- Monthly P&I
- —
- Monthly cashflow
- —
- DSCR
- —
- Eligible?
- —
Personal DTI + credit; lowest rate.
DSCR
20% down · 8.5% · 30yr
- Down + closing
- —
- Monthly P&I
- —
- Monthly cashflow
- —
- DSCR
- —
- Eligible?
- —
No personal income docs; deal must DSCR.
Hard money
10% down · 12.0% · 12mo
- Down + closing
- —
- Monthly P&I
- —
- Monthly cashflow
- —
- DSCR
- —
- Eligible?
- —
Short-term bridge; refi at stabilization.
Rent comps 3 comps
| Address | Beds | Baths | Sqft | Rent | $/sqft | DOM | Units | Dist |
|---|---|---|---|---|---|---|---|---|
| 12863 159th Ct N Jupiter, FL | 5.0 | 3.0 | 2296 | $6,000 | $2.61 | 26d | 1 | 0.33mi |
| 12523 169th Ct N Jupiter, FL | 3.0 | 2.0 | 1908 | $4,500 | $2.36 | 26d | 1 | 1.34mi |
| 12709 144th Ct N Unit NA West Palm Beach, FL | 4.0 | 3.0 | 2250 | $5,000 | $2.22 | 1d | 1 | 1.41mi |
Listing history 22 events
-
2026-05-09status Pending
-
2026-05-01price $650,000
-
2026-03-21price $695,000
-
2026-02-25price $725,000
-
2026-02-04price $745,000
-
2026-01-06$790,000 Active
-
2025-05-14historical
-
2025-05-12$5,000 New
-
2023-09-30historical
-
2023-05-12$819,975 Active
-
2023-04-30historical
-
2023-04-12price $819,975
-
2023-03-31$799,997 Active
-
2022-11-08soldstatus $450,000
-
2015-08-12soldstatus $320,000
-
2015-08-07historical
-
2015-08-07soldstatus $320,000 Closed
-
2015-07-16status Pending
-
2015-06-08price $329,000
-
2015-02-14$339,000 Active
-
2014-06-02historical
-
2013-11-15$349,000 Active
ⓘ Source: listings_history table (triggers on properties + properties_extension) + one-shot
backfill from property_details.listing_events for pre-trigger history.
Tax reassessment forecast FL · Resets to sale price
- Current annual tax
- $12,619 · $1,052/mo
- Projected year-2 tax
- $12,619 · $1,052/mo
- Expected delta
- $0/yr ($0/mo · 0.0%)
ⓘ Screening estimate from a state-policy table — verify with the county assessor before closing.
Climate risk First Street
- Flood 4/10 Moderate FEMA zone X (unshaded) · 22% chance over 30 yrs
- Wildfire 3/10 Moderate
- Heat 9/10 Extreme 7 d/yr ≥107°F today · 22 d/yr by 30 yrs out
- Wind 10/10 Extreme 99% chance of damaging wind over 30 yrs
- Air quality 1/10 Low 0 unhealthy d/yr today · 0 by 30 yrs out
Nearby sold comps map
Loading sold comps map…
Walkable amenities ~0.75 mi
Loading nearby amenities…
Taxation est. · year 1
- Rental income
- $67,556
- − Mortgage interest
- −$36,410
- − Property taxes
- −$12,619
- − Insurance
- −$3,250
- − Repairs & maintenance
- −$5,404
- − Management
- −$5,404
- − Depreciation
- −$18,909
- Taxable loss
- −$14,441
- Est. tax savings @ 24.0%
- +$3,466
- After-tax cash flow
- $62/yr
For passive investors: Depreciation is non-cash, so a rental often shows a tax loss while cash-flowing — sheltering income. Rental losses are passive: they offset passive income freely, and up to $25,000/yr can offset ordinary (W-2) income if you actively participate and your MAGI is under $100k (phasing out to $0 by $150k); unused losses carry forward. On sale, claimed depreciation is recaptured at up to 25%, and gains may owe capital-gains tax (a 1031 exchange can defer both). Figures are a year-1 estimate at your 24.0% rate — not tax advice; consult a CPA.
Schools (NCES district)
- District
- Palm Beach
- NCES district ID
- 1201500
- Math proficiency
- 46% ▼ -16.00%
- Reading proficiency
- 53% ▼ -4.00%
- Median HH income
- $53,943
- Composite
- 42.72/100
- National rank
- #3160
- State rank
- #34 of 73 in FL
Livability — Jupiter Farms
- Score
- 66/100
- State rank
- #617
- US rank
- #11894
Category grades
Schools grade is shown separately in the Schools card above.
Census & demographics
- Census place
- Jupiter Farms, FL
- Population (ZIP)
- 15,205
Population outlook (Palm Beach County) Hauer SSP2
- Today (2025)
- 1,637,487 people
- By 2030
- 1,743,255 · +6.5%
- By 2040
- 1,948,712 · +19.0%
- By 2050
- 2,132,979 · +30.3%
- By 2075
- 2,530,027 · +54.5%
- By 2100
- 2,706,979 · +65.3%
Race, ethnicity, and origin ACS 2023
- Neighborhood character
- Predominantly White (80%)
- Race & ethnicity
- White 80% Two or more races 14% Hispanic / Latino 8% Asian 3%
- Hispanic origin (detail)
- Puerto Rican 1% Cuban 1%
- Common ancestry
- Slovak 4% Romanian 4% Italian 3%
- Foreign-born
- 10% · Canada, China, Vietnam
- Languages at home
- 86% English-only · Spanish 5% Other Indo-European 4% Russian/Polish/Slavic 1%
Political lean MEDSL · Palm Beach
- 2024 margin
- Toss-up / Even · D 50.0% · R 49.2%
- 2008→2024 swing
- -22.1pp toward R · 2008: 22.9pp · 2024: 0.8pp
- All cycles
- 2024: D+0.8 2020: D+12.8 2016: D+15.3 2012: D+17.0 2008: D+22.9
Not yet ingested
- Civics
- —
Market trends
- HPI YoY
- ▼ -306.11%
- Current HPI
- 427.5178
- Rent YoY
- —
- Metro
- —
- State GDP YoY
- ▲ 3.28%
- F500 in state
- 36
Industry mix (Fortune 500 HQ in FL)
| Industry | F500 HQs | Revenue |
|---|---|---|
| Industrial Technology | 2 | $29B |
|
||
| Insurance | 2 | $17B |
|
||
| Retail | 1 | $60B |
|
||
| Technology Distribution | 1 | $58B |
|
||
| Homebuilding | 1 | $35B |
|
||
| Technology Manufacturing | 1 | $35B |
|
||
Price history
+86.2% since first listed22 events — show timeline
- 2026-05-09 Pending — MARMLS
- 2026-05-01 Price Changed $650,000 MARMLS
- 2026-03-21 Price Changed $695,000 MARMLS
- 2026-02-25 Price Changed $725,000 MARMLS
- 2026-02-04 Price Changed $745,000 MARMLS
- 2026-01-06 Listed $790,000 MARMLS
- 2025-05-14 Listing Removed — GAMLS
- 2025-05-12 Listed $5,000 GAMLS
- 2023-09-30 Listing Removed — MARMLS
- 2023-05-12 Listed $819,975 MARMLS
- 2023-04-30 Listing Removed — MARMLS
- 2023-04-12 Price Changed $819,975 MARMLS
- 2023-03-31 Listed $799,997 MARMLS
- 2022-11-08 Sold (Public Records) $450,000 Public Records
- 2015-08-12 Sold (Public Records) $320,000 Public Records
- 2015-08-07 Listing Removed — Beaches MLS
- 2015-08-07 Sold (MLS) $320,000 Beaches MLS
- 2015-07-16 Pending — Beaches MLS
- 2015-06-08 Price Changed $329,000 Beaches MLS
- 2015-02-14 Listed $339,000 Beaches MLS
- 2014-06-02 Listing Removed — Beaches MLS
- 2013-11-15 Listed $349,000 Beaches MLS
Property tax history
+9.7%/yrLatest (2025): $12,619 · +15.8% YoY. Source: county tax records.
Cash-flow waterfall
monthlySold comps — $/sqft
last 12 mo · ≤1 miLoading sold comps…