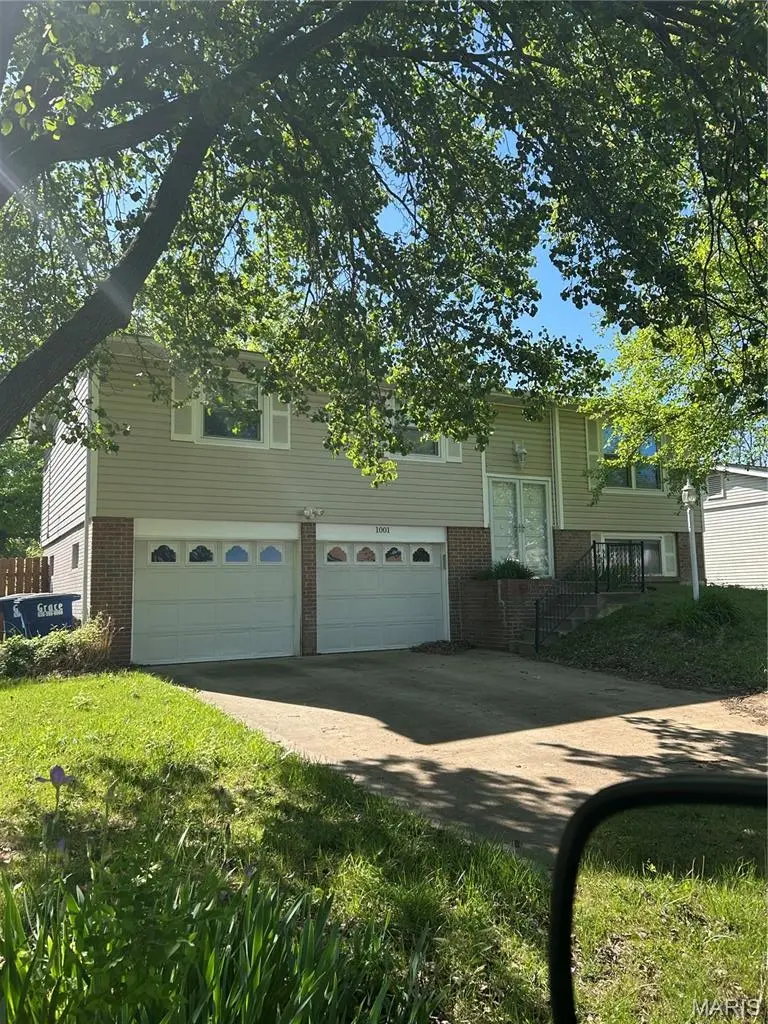
1001 Drexel Dr · St. Peters, MO
Flood risk 1/10 · Minimal
- FEMA flood zone
- X (unshaded)
- Chance of flooding over 30 yrs
- 0.0%
- Est. flood insurance / yr
- $473 – $860
Fire risk 1/10 · Minimal
- Est. fire insurance / yr
- $1,054 – $1,958
Heat risk 5/10 · Moderate
- Hot days now (above 107°F)
- 7 days/yr
- Hot days in 30 yrs
- 20 days/yr
Wind risk 2/10 · Minimal
- Chance of severe wind over 30 yrs
- 1.0%
Air-quality risk 2/10 · Minimal
- Unhealthy air days now
- 2 days/yr
- Unhealthy air days in 30 yrs
- 2 days/yr
Risk factors via First Street. Map © Google.
Why this score? — see what drove the D+ grade
The composite is a weighted blend of 9 inputs, each scored 0–100. Each bar is that input's sub-score; the figure is the points it added to the 100-point composite (weight × sub-score).
- ARV discount +13.5/15.0
- Cash flow +12.6/30.0
- Schools +5.2/10.0
- DSCR +3.7/10.0
- Rent growth +3.3/5.0
- 1% rule +3.1/10.0
- Livability +2.5/5.0
- Condition / age +2.5/5.0
- Appreciation +0.0/10.0
$279,900
🖨 Deal sheet (PDF) 📄 Offer letter ✓ Due diligence
Listing remarks MLS
Let's chat about 1001 Drexel Dr. First off, this home offers 3 beds, 2 full baths, updated kitchen, flooring, paint, newer roof (2yrs old) & it's located on nicely sized lot. Upon entering, you'll notice the openness this home provides. The kitchen features new countertops, new appliances, sink, flooring & there's no shortage on cabinets. The lower level family room, featuring a wood-burning fireplace, is versatile & can be used so many different ways. The outside covered deck & lower level patio space is the perfect spot for hosting parties, BBQs or just sit back & relax. The backyard will blow your mind - so many games to be played, gardens to grow or whatever you can think of can be done with this space. This house sits at the end of the street so no thru traffic! conveniently close to highways & all the things you need. Don't sit on this one - make it yours before its too late!
Key facts
- 0.31 acre lot
- 2 garage spots
- Built 1975
Property features AI
Finance
- Other: Owner-occupied tax status noted
- Financial info: Lease not considered; No second mortgage indicated
Exterior
- Parking: Two total parking spaces; Two-car garage with garage door opener (garage faces front); Additional driveway and off-street parking on concrete
- Security: Smoke detector(s); Carbon monoxide detector(s)
- Utilities: Public water; Public sewer; Electric service by Ameren; Cable available
- Home design: Single family residence; One and one-half levels; Private ownership; House structure
- Construction: Vinyl siding; Basement: poured concrete, 8 ft+; partially finished
- Exterior features: Back yard; Front yard; Level lot; Chain link, wire and wood fencing with gate; Sliding door(s)
Interior
- Kitchen: Stainless steel appliances; Gas range and gas oven; Microwave; Dishwasher; Disposal; Refrigerator
- Bedrooms: Three bedrooms on the main level
- Bathrooms: Two full bathrooms, both on the main level
- Heating & cooling: Forced air heating (natural gas); Central air conditioning; Ceiling fan(s); Attic fan
- Interior features: Open floorplan; Eat-in kitchen; Kitchen island; Pantry; Skylight(s); Blinds; Screens; Tilt-in windows
- Laundry & utility: Washer and dryer included; Laundry located in the basement; Gas water heater
Neighborhood map
What this means for you Summary
Snapshot
- This is a 3-bed/2.0-bath single-family listed at $280k.
Deal economics
- At list price, monthly cash flow is $-38 ($-453/yr) — negative.
- To cash-flow at today's rent, offer at most $273k (2.4% below list).
- To meet the 1% rule (rent ≥ 1% of price), the offer needs to be $227k (18.9% below list).
- Recommended offer: $227k (18.9% below list) — sets the bar for 1% rule.
- Cap rate 6.1% vs local median 4.2% in St. Peters — top-decile yield for the area; either an underpriced asset or a hidden risk that comps aren't pricing in. Stress-test before assuming the spread holds.
Location & tenants
- Location reads: area grade D — affects rentability + tenant quality, not the cash-flow math above.
- Francis Howell R-III (suburban): math 53% / reading 63% proficiency, ranked #11 of 324 in MO (top 3%) — acceptable for families but not a draw, mixed tenant base, ~2y average lease; only 15% free/reduced lunch — higher-income household profile.
- Zoned schools: Castlio Elem. (math 59% / reading 65%, grade B, #98 of 1,115 statewide, top 10%, 818 students, 12% FRL); Francis Howell North High (math 40% / reading 55%, grade D, #154 of 521 statewide, top 29%, 1,679 students, 19% FRL) — zoned schools at 15% FRL track the district average.
- Market conditions: Rents rising (+3.3%/yr); 200 active listings in the ZIP; 7 comparable units currently listed for rent nearby; rentals at typical pace (median 23d on market — plan ~3-4 weeks tenant-placement turnaround); 43% of comp listings sitting > 30 days — soft ceiling on asking rent; solid renter incomes; 2,021 units permitted in St. Charles County in 2024 (568 in 5+ unit buildings).
Forward outlook
- Local home prices are declining (-3.0%/yr); year-one equity from $2k of loan paydown is wiped out by about $8k of value loss. Plan a longer hold.
- St. Charles County population projected at +22% by 2050 — long-run rental-demand tailwind backs the buy-and-hold thesis.
Negotiation context
- Only 3 days on market — expect competitive offers; lowballing is unlikely to land.
- 3 sale attempts since 11y ago; this cycle's ask is 30% above the opening price — seller raised mid-cycle; expect resistance to lowballs.
- Current owner paid $223k; 26% above their basis — modest negotiation headroom, anchor on the comps not their cost.
Risks & watch-outs
- Climate carrying-cost: extreme-heat days projected 7→20/yr by 2055 (HVAC capex compounding) — expect insurance premiums to compound above CPI over the hold.
Questions for the listing agent
- What do current leases actually rent for vs. the listed asking? Can we see a recent rent roll and the last 12 months of T-12 income?
- Built in 1975 — when were the roof, HVAC, electrical panel, plumbing, and water heater last replaced?
- Is there a deadline driving the sale (1031 exchange, divorce, estate, relocation)? That informs how much negotiation room exists.
- The area grade is low — what's the realistic commute time and amenity access for the typical tenant pool here? Any planned neighborhood developments (good or bad) we should know about?
- What's the average days-on-market for RENTAL listings here right now (not sales)? A rising rental-DOM trend means longer vacancies and softer asking-rent achievability than the comps imply.
- What's the recent tenant-quality profile in this submarket — average credit score on applications, eviction rate, late-payment / NSF rate, and stable-employment percentage? A property-management company in the area should have these aggregated.
- How much new for-sale + rental construction is in the pipeline within 1–3 miles? Heavy new supply typically softens prices + rents 12–24 months out; constrained supply supports both.
Investment metrics
- 1% rule
- 0.81% ✗
- Cap rate
- 6.13%
- Cash-on-cash
- -0.58%
- DSCR
- 0.97
- GRM
- 10.3
CMA / ARV
- ARV (on-the-fly)
- $323,232
- Comps found
- 12
Show comp detail 12 sales within ~0.75 mi
| Address | Dist | Beds/Ba | Sqft | Sold | Price | $/sf | Match |
|---|---|---|---|---|---|---|---|
| 3534 Carriage Run Dr | 0.21mi | 3/2.0 | 1,510 (-3%) | 10mo | $299,900 | $199 | 77 |
| 1124 Saratoga Dr | 0.41mi | 3/2.0 | 1,468 (-6%) | 8mo | $315,000 | $215 | 65 |
| 1145 Yorktown Dr | 0.46mi | 3/2.0 | 1,631 (+5%) | 7mo | $300,000 | $184 | 64 |
| 1249 Yorktown Dr | 0.57mi | 3/2.0 | 1,558 (+0%) | 11mo | $350,000 | $225 | 64 |
| 3418 Wexford Dr | 0.26mi | 3/2.0 | 1,320 (-15%) | 4mo | $275,000 | $208 | 60 |
| 3850 Jeff Dr | 0.56mi | 3/2.0 | 1,622 (+4%) | 10mo | $259,999 | $160 | 58 |
| 3967 Summerview Dr | 0.58mi | 3/2.0 | 1,456 (-6%) | 6mo | $340,000 | $234 | 58 |
| 717 Crosswood Dr | 0.73mi | 3/2.0 | 1,508 (-3%) | 5mo | $259,900 | $172 | 57 |
| 127 Birkdale Ct | 0.68mi | 3/2.0 | 1,568 (+1%) | 12mo | $335,000 | $214 | 57 |
| 1126 Yorktown Dr | 0.40mi | 3/2.5 | 1,748 (+12%) | 3mo | $299,900 | $172 | 56 |
| 3902 Lexington Dr | 0.65mi | 4/2.5 (+1) | 1,577 (+2%) | 11mo | $200,000 | $127 | 51 |
| 3492 Huntington Ln | 0.57mi | 4/2.0 (+1) | 1,734 (+12%) | 10mo | $362,500 | $209 | 41 |
Match score weights: distance 35% · size 25% · config 20% · recency 20%. Top-matched comps best support the ARV.
Projected returns pro-forma
-3.0% appreciation · 3.27% rent growth · sell at horizon
- IRR
- -17.0%
- Equity multiple
- 0.40×
- Total profit
- $-47,169
- Equity at exit
- $41,734
- IRR
- -8.4%
- Equity multiple
- 0.47×
- Total profit
- $-41,733
- Equity at exit
- $24,201
Cash invested: $78,372 (down + closing). Projections, not guarantees.
Landlord ↔ Tenant lean methodology
- Overall (STATE)
- 81 Strongly Landlord-Friendly
- State Missouri
- 81 Strongly Landlord-Friendly · R+10
- County
- — inherits STATE
- City
- — inherits STATE
ZIP-level market 63303
- Rents YoY
- 3.3%
- Active inventory
- 200
- Price-to-rent
- 10.3×
Monthly cashflow live
- Estimated rent
- $2,271 high interval (Pro) →
- Mortgage (P&I)
- −$1,468
- Tax from tax record
- −$247 /mo · $2,965/yr
- Insurance
- −$117
- HOA
- −$0
- Vacancy / Maint / Mgmt
- −$477
- Net cashflow
- $-38
Break-even live
Sensitivity live
| Price | -10% $121 | -5% $41 | +0% $-38 | +5% $-117 | +10% $-196 |
|---|---|---|---|---|---|
| Rent | -10% $-217 | -5% $-127 | +0% $-38 | +5% $52 | +10% $142 |
| Rate | -1.0pp $103 | -0.5pp $33 | base $-38 | +0.5pp $-110 | +1.0pp $-184 |
UW: 25.0% down · 7.5% · 30yr · 1.5% tax · 5.0% vac · 8.0% maint · 8.0% mgmt
Financing live
Cash to close
- Down payment
- $69,975
- Closing costs
- $8,397
- Reserves months
- —
- Total cash needed
- —
Loan-product check · same deal, 3 products live
Conventional
25% down · 7.5% · 30yr
- Down + closing
- —
- Monthly P&I
- —
- Monthly cashflow
- —
- DSCR
- —
- Eligible?
- —
Personal DTI + credit; lowest rate.
DSCR
20% down · 8.5% · 30yr
- Down + closing
- —
- Monthly P&I
- —
- Monthly cashflow
- —
- DSCR
- —
- Eligible?
- —
No personal income docs; deal must DSCR.
Hard money
10% down · 12.0% · 12mo
- Down + closing
- —
- Monthly P&I
- —
- Monthly cashflow
- —
- DSCR
- —
- Eligible?
- —
Short-term bridge; refi at stabilization.
Rent comps 7 comps
| Address | Beds | Baths | Sqft | Rent | $/sqft | DOM | Units | Dist |
|---|---|---|---|---|---|---|---|---|
| 3515 Ridgewood Dr Saint Charles, MO | 3.0 | 2.5 | 1677 | $2,535 | $1.51 | 5d | 1 | 0.41mi |
| 3891 Cambridge Crossing Dr Saint Charles, MO | 3.0 | 2.0 | 1509 | $2,396 | $1.59 | 5d | 1 | 0.76mi |
| 733 Pecan Hill Dr Saint Charles, MO | 3.0 | 2.0 | 1882 | $2,750 | $1.46 | 44d | 1 | 0.86mi |
| 2970 Aintree Dr Saint Charles, MO | 3.0 | 2.0 | 1318 | $2,380 | $1.81 | 44d | 1 | 1.24mi |
| 3039 Plum Creek Dr Saint Peters, MO | 3.0 | 2.0 | 1300 | $2,180 | $1.68 | 22d | 1 | 1.40mi |
| 145 Sesame Loop Unit 1 St Charles, MO | 3.0 | 2.5 | 1869 | $2,450 | $1.31 | 8d | 1 | 1.41mi |
| 3212 Stonehenge Dr Saint Charles, MO | 3.0 | 2.0 | 1189 | $2,000 | $1.68 | 44d | 1 | 1.49mi |
Listing history 7 events
-
2026-06-16status $279,900 Pending 3 DOM
-
2026-06-15days on market $279,900 Active 3 DOM
-
2026-06-13statusdays on market $279,900 Active 1 DOM
-
2026-06-09days on market $279,900 Coming Soon 3 DOM
-
2026-06-08days on market $279,900 Coming Soon 2 DOM
-
2026-06-07remarks 699-char remark
-
2026-06-07$279,900 Coming Soon 1 DOM
ⓘ Source: listings_history table (triggers on properties + properties_extension) + one-shot
backfill from property_details.listing_events for pre-trigger history.
Tax reassessment forecast MO · Resets to sale price
- Current annual tax
- $2,965 · $247/mo
- Projected year-2 tax
- $2,965 · $247/mo
- Expected delta
- $0/yr ($0/mo · 0.0%)
ⓘ Screening estimate from a state-policy table — verify with the county assessor before closing.
Climate risk First Street
- Flood 1/10 Low FEMA zone X (unshaded) · 0% chance over 30 yrs
- Wildfire 1/10 Low
- Heat 5/10 Major 7 d/yr ≥107°F today · 20 d/yr by 30 yrs out
- Wind 2/10 Low 100% chance of damaging wind over 30 yrs
- Air quality 2/10 Low 2 unhealthy d/yr today · 2 by 30 yrs out
Nearby sold comps map
Loading sold comps map…
Walkable amenities ~0.75 mi
Loading nearby amenities…
Taxation est. · year 1
- Rental income
- $27,248
- − Mortgage interest
- −$15,679
- − Property taxes
- −$2,965
- − Insurance
- −$1,400
- − Repairs & maintenance
- −$2,180
- − Management
- −$2,180
- − Depreciation
- −$8,143
- Taxable loss
- −$5,298
- Est. tax savings @ 24.0%
- +$1,271
- After-tax cash flow
- $819/yr
For passive investors: Depreciation is non-cash, so a rental often shows a tax loss while cash-flowing — sheltering income. Rental losses are passive: they offset passive income freely, and up to $25,000/yr can offset ordinary (W-2) income if you actively participate and your MAGI is under $100k (phasing out to $0 by $150k); unused losses carry forward. On sale, claimed depreciation is recaptured at up to 25%, and gains may owe capital-gains tax (a 1031 exchange can defer both). Figures are a year-1 estimate at your 24.0% rate — not tax advice; consult a CPA.
Schools (NCES district)
- District
- Francis Howell R-III
- NCES district ID
- 2928950
- Math proficiency
- 53% ▼ -12.00%
- Reading proficiency
- 63% ▼ -5.00%
- Median HH income
- $79,768
- Composite
- 52.23/100
- National rank
- #1602
- State rank
- #11 of 324 in MO
Livability — St. Peters
No livability data for this city. (Only ~50 U.S. cities are tracked.)
Census & demographics
- County
- Saint Charles County · 399,703 people
- City population
- 74,876
- Metro
- St. Louis, MO-IL
- Population (ZIP)
- 46,089
- Household income
- $99,138
- Rent vs Own
- Severe rent burden
- 1026.0
Population outlook (St. Charles County) Hauer SSP2
- Today (2025)
- 437,857 people
- By 2030
- 461,707 · +5.4%
- By 2040
- 503,222 · +14.9%
- By 2050
- 534,684 · +22.1%
- By 2075
- 597,047 · +36.4%
- By 2100
- 609,682 · +39.2%
Race, ethnicity, and origin ACS 2023
- Neighborhood character
- Predominantly White (79%)
- Race & ethnicity
- White 79% Black 6% Asian 6% Two or more races 6% Hispanic / Latino 5%
- Common ancestry
- Lithuanian 3% Romanian 3% Slovak 2%
- Foreign-born
- 7% · Canada, China, South Korea
- Languages at home
- 91% English-only · Spanish 3% Other Indo-European 1% Other Asian/Pacific 1%
Political lean MEDSL · St. Charles
- 2024 margin
- R (+17.0) · D 40.8% · R 57.8% · Other 1.4%
- 2008→2024 swing
- -7.2pp toward R · 2008: -9.7pp · 2024: -17.0pp
- All cycles
- 2024: R+17.0 2020: R+17.5 2016: R+26.4 2012: R+21.0 2008: R+9.7
Not yet ingested
- Civics
- —
Market trends
- HPI YoY
- ▼ -260.84%
- Current HPI
- 224.7406
- Rent YoY
- ▲ 3.27%
- Metro
- St. Louis, MO-IL
- State GDP YoY
- ▲ 1.84%
- F500 in state
- 20
Industry mix (Fortune 500 HQ in MO)
| Industry | F500 HQs | Revenue |
|---|---|---|
| Healthcare | 1 | $163B |
|
||
| Insurance | 1 | $21B |
|
||
| Industrial Technology | 1 | $17B |
|
||
| Retail | 1 | $16B |
|
||
| Industrial Distribution | 1 | $10B |
|
||
| Utilities | 1 | $9B |
|
||
Price history
+314.7% since first listed19 events — show timeline
- 2026-06-06 Coming Soon $279,900 MARIS as Distributed by MLS Grid
- 2022-07-13 Sold (Public Records) $223,000 Public Records
- 2022-07-12 Pending — MARIS as Distributed by MLS Grid
- 2022-07-11 Sold (MLS) — MARIS as Distributed by MLS Grid
- 2022-06-11 Contingent — MARIS as Distributed by MLS Grid
- 2022-06-09 Listed $215,000 MARIS as Distributed by MLS Grid
- 2018-06-18 Sold (Public Records) $175,000 Public Records
- 2018-06-14 Pending — MARIS as Distributed by MLS Grid
- 2018-06-13 Sold (MLS) — MARIS as Distributed by MLS Grid
- 2018-05-07 Contingent — MARIS as Distributed by MLS Grid
- 2018-05-02 Listed $184,500 MARIS as Distributed by MLS Grid
- 2015-11-13 Sold (Public Records) $161,000 Public Records
- 2015-11-05 Sold (MLS) — MARIS as Distributed by MLS Grid
- 2015-09-29 Delisted — MARIS as Distributed by MLS Grid
- 2015-09-24 Listed $159,000 MARIS as Distributed by MLS Grid
- 1993-08-01 Sold (Public Records) $75,000 Public Records
- 1989-10-01 Sold (Public Records) $67,500 Public Records
- 1984-08-01 Sold (Public Records) — Public Records
- 1984-06-01 Sold (Public Records) — Public Records
Property tax history
+4.2%/yrLatest (2025): $2,965 · +10.0% YoY. Source: county tax records.
Cash-flow waterfall
monthlySold comps — $/sqft
last 12 mo · ≤1 miLoading sold comps…