 Triplex
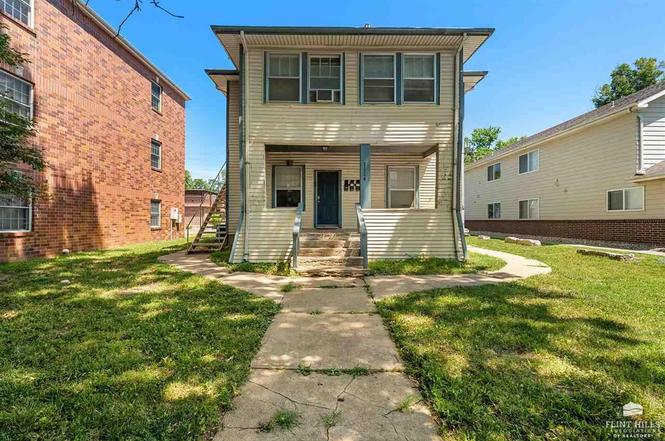
1114 Vattier St · Manhattan, KS
Flood risk 1/10 · Minimal
- FEMA flood zone
- X (unshaded)
- Chance of flooding over 30 yrs
- 0.0%
- Est. flood insurance / yr
- $473 – $860
Fire risk 2/10 · Minimal
- Est. fire insurance / yr
- $1,154 – $2,142
Heat risk 5/10 · Moderate
- Hot days now (above 107°F)
- 7 days/yr
- Hot days in 30 yrs
- 16 days/yr
Wind risk 2/10 · Minimal
- Chance of severe wind over 30 yrs
- —
Air-quality risk 2/10 · Minimal
- Unhealthy air days now
- 2 days/yr
- Unhealthy air days in 30 yrs
- 2 days/yr
Risk factors via First Street. Map © Google.
Why this score? — see what drove the C grade
The composite is a weighted blend of 9 inputs, each scored 0–100. Each bar is that input's sub-score; the figure is the points it added to the 100-point composite (weight × sub-score).
- Cash flow +22.3/30.0
- ARV discount +7.5/15.0
- DSCR +7.1/10.0
- 1% rule +6.0/10.0
- Livability +4.2/5.0
- Rent growth +4.0/5.0
- Schools +3.6/10.0
- Condition / age +2.5/5.0
- Appreciation +0.0/10.0
$324,900
🖨 Deal sheet 📄 Offer letter ✓ Due diligence
Multi-family units
County records classify this as Multi-Family (5+ Unit). Listing-text estimate: 3 units. estimate disagrees with records
5+ unit building — per-unit beds/baths from public records are typically unavailable; the breakdown below (if shown) is an estimate from the listing text.
Key facts
- 7,500 sq ft lot
- Built 1920
- Listed 232 days
Neighborhood map
What this means for you Summary
Snapshot
- This is a 3 × 3-bed/1.7-bath units multifamily listed at $325k.
Deal economics
- At list price, monthly cash flow is $533 ($6k/yr) — positive. Per door: $178/mo.
- The deal already cash-flows at list — no discount required.
- Meets the 1% rule at list price ($4k rent vs $325k).
- Recommended offer: $286k (12.0% below list) — sets the bar for market timing.
Location & tenants
- Location reads 83/100 on livability (#6 in KS, #979 nationally) — a professional / high-income tenant draw. Strengths: amenities A+, commute A+, cost of living A+; Watch: crime C-, employment C-.
- Manhattan-Ogden (urban): math 39% / reading 46% proficiency, ranked #26 of 169 in KS (top 15%) — families likely to look elsewhere, expect single-tenant / working-renter base with shorter leases.
- Market conditions: Rents rising fast (+6.0%/yr); 336 active listings in the ZIP; 132 units permitted in Riley County in 2024 (35 in 5+ unit buildings).
- At $3,589/mo this rent would consume 79% of the median local household income ($55k/yr) (locally 3089% of renters already pay >50% of income on rent) — very limited rent-growth headroom before tenants either downsize or default.
Forward outlook
- Local home prices are declining (-3.0%/yr); year-one equity from $2k of loan paydown is wiped out by about $10k of value loss. Plan a longer hold.
- Riley County population projected at +30% by 2050 — long-run rental-demand tailwind backs the buy-and-hold thesis.
- At projected returns (-3.0% appreciation + 6.0% rent growth), your $91k cash investment doubles in ~10 years — after that, you're playing with house money.
Negotiation context
- It's been on market 232 days — a 12% lower offer ($286k) is reasonable based on typical stale-listing flexibility.
- 4 sale attempts since 2y ago; this cycle's ask has dropped $35k (10%) from the opening price — seller is motivated, your offer sets the floor, not the list.
- Current owner paid $139k; list at $325k implies a 134% gain — meaningful room to come down on a strong offer.
Risks & watch-outs
- Watch-outs: built in 1920 — expect roof / HVAC / electrical / plumbing capex.
- Climate carrying-cost: extreme-heat days projected 7→16/yr by 2055 (HVAC capex compounding) — expect insurance premiums to compound above CPI over the hold.
Questions for the listing agent
- It's been on market 232 days. Have you received any prior offers? Is the seller open to a 12% concession, seller financing, or rate buy-down credit?
- Can we see the unit-by-unit rent roll, current vacancy, and any below-market leases? What's the average tenancy length?
- What capital expenditures (roof, boiler, parking lot, exteriors) have been made in the last 5 years, and what's planned in the next 2?
- Built in 1920 — when were the roof, HVAC, electrical panel, plumbing, and water heater last replaced?
- Why hasn't it sold? Are there any deal-killer items the seller is aware of (foundation, flood, title, zoning, code violations)?
- Is there a deadline driving the sale (1031 exchange, divorce, estate, relocation)? That informs how much negotiation room exists.
- What's the average days-on-market for RENTAL listings here right now (not sales)? A rising rental-DOM trend means longer vacancies and softer asking-rent achievability than the comps imply.
- What's the recent tenant-quality profile in this submarket — average credit score on applications, eviction rate, late-payment / NSF rate, and stable-employment percentage? A property-management company in the area should have these aggregated.
- How much new apartment / multifamily construction is in the pipeline within 1–3 miles? Heavy new supply (>2% of stock underway) typically softens rents 12–24 months out; light construction supports rent growth.
Investment metrics
- 1% rule
- 1.10% ✓
- Cap rate
- 8.26%
- Cash-on-cash
- 7.03%
- DSCR
- 1.31
- GRM
- 7.5
CMA / ARV
No comps found within radius.
Projected returns pro-forma
-3.0% appreciation · 6.02% rent growth · sell at horizon
- IRR
- -2.1%
- Equity multiple
- 0.92×
- Total profit
- $-7,403
- Equity at exit
- $48,444
- IRR
- 10.7%
- Equity multiple
- 1.95×
- Total profit
- $86,648
- Equity at exit
- $28,091
Cash invested: $90,972 (down + closing). Projections, not guarantees.
Landlord ↔ Tenant lean methodology
- Overall (STATE)
- 83 Strongly Landlord-Friendly
- State Kansas
- 83 Strongly Landlord-Friendly · R+10
- County
- — inherits STATE
- City
- — inherits STATE
ZIP-level market 66502
- Rents YoY
- 6.0%
- Active inventory
- 336
- Price-to-rent
- 22.6×
Monthly cashflow live
- Estimated rent
- $3,589 medium interval (Pro) →
- Mortgage (P&I)
- −$1,704
- Tax from tax record
- −$464 /mo · $5,563/yr
- Insurance
- −$135
- HOA
- −$0
- Vacancy / Maint / Mgmt
- −$754
- Net cashflow
- $533
Break-even live
3-unit breakdown (identical units grouped — click to expand)
| Units | Beds | Baths | Est. rent |
|---|---|---|---|
| 3× units | 3 | 1.7 | $3,588 |
| #1 | 3 | 1.7 | $1,196 |
| #2 | 3 | 1.7 | $1,196 |
| #3 | 3 | 1.7 | $1,196 |
| Total (3 units) | $3,589 | ||
UW: 25.0% down · 7.5% · 30yr · 1.5% tax · 5.0% vac · 8.0% maint · 8.0% mgmt
Financing live
Cash to close
- Down payment
- $81,225
- Closing costs
- $9,747
- Reserves months
- —
- Total cash needed
- —
Loan-product check · same deal, 3 products live
Conventional
25% down · 7.5% · 30yr
- Down + closing
- —
- Monthly P&I
- —
- Monthly cashflow
- —
- DSCR
- —
- Eligible?
- —
Personal DTI + credit; lowest rate.
DSCR
20% down · 8.5% · 30yr
- Down + closing
- —
- Monthly P&I
- —
- Monthly cashflow
- —
- DSCR
- —
- Eligible?
- —
No personal income docs; deal must DSCR.
Hard money
10% down · 12.0% · 12mo
- Down + closing
- —
- Monthly P&I
- —
- Monthly cashflow
- —
- DSCR
- —
- Eligible?
- —
Short-term bridge; refi at stabilization.
Listing history 17 events
-
2026-05-04soldstatus
-
2026-04-14status Pending
-
2025-11-13price $324,900
-
2025-11-03status Active
-
2025-11-01historical
-
2025-10-14price $339,900
-
2025-09-24status Active
-
2025-08-19status Pending
-
2025-07-18$359,900 Active
-
2025-03-18price $387,000
-
2025-03-12price $412,000
-
2024-03-24historical $650
-
2024-03-13$650
-
2023-08-20historical $600
-
2022-07-25price $600
-
2000-11-01soldstatus $139,000
-
1991-09-01soldstatus $90,000
ⓘ Source: listings_history table (triggers on properties + properties_extension) + one-shot
backfill from property_details.listing_events for pre-trigger history.
Tax reassessment forecast KS · Resets to sale price
- Current annual tax
- $5,563 · $464/mo
- Projected year-2 tax
- $5,563 · $464/mo
- Expected delta
- $0/yr ($0/mo · 0.0%)
ⓘ Screening estimate from a state-policy table — verify with the county assessor before closing.
Climate risk First Street
- Flood 1/10 Low FEMA zone X (unshaded) · 0% chance over 30 yrs
- Wildfire 2/10 Low
- Heat 5/10 Major 7 d/yr ≥107°F today · 16 d/yr by 30 yrs out
- Wind 2/10 Low
- Air quality 2/10 Low 2 unhealthy d/yr today · 2 by 30 yrs out
Nearby sold comps map
Loading sold comps map…
Walkable amenities ~0.75 mi
Loading nearby amenities…
Taxation est. · year 1
- Rental income
- $43,068
- − Mortgage interest
- −$18,199
- − Property taxes
- −$5,563
- − Insurance
- −$1,624
- − Repairs & maintenance
- −$3,445
- − Management
- −$3,445
- − Depreciation
- −$9,452
- Taxable income
- $1,339
- Est. tax owed @ 24.0%
- −$321
- After-tax cash flow
- $6,070/yr
For passive investors: Depreciation is non-cash, so a rental often shows a tax loss while cash-flowing — sheltering income. Rental losses are passive: they offset passive income freely, and up to $25,000/yr can offset ordinary (W-2) income if you actively participate and your MAGI is under $100k (phasing out to $0 by $150k); unused losses carry forward. On sale, claimed depreciation is recaptured at up to 25%, and gains may owe capital-gains tax (a 1031 exchange can defer both). Figures are a year-1 estimate at your 24.0% rate — not tax advice; consult a CPA.
Schools (NCES district)
- District
- Manhattan-Ogden
- NCES district ID
- 2009180
- Math proficiency
- 39% ▼ -1.00%
- Reading proficiency
- 46% ▲ 1.00%
- Median HH income
- $44,001
- Composite
- 35.97/100
- National rank
- #4795
- State rank
- #26 of 169 in KS
Livability — Manhattan
- Score
- 83/100
- State rank
- #6
- US rank
- #979
Category grades
Schools grade is shown separately in the Schools card above.
Census & demographics
- Census place
- Manhattan, KS
- County
- Riley County · 62,662 people
- City population
- 60,966
- Metro
- Manhattan, KS
- Population (ZIP)
- 43,693
- Household income
- $54,833
- Rent vs Own
- Severe rent burden
- 3089.0
Population outlook (Riley County) Hauer SSP2
- Today (2025)
- 83,656 people
- By 2030
- 89,075 · +6.5%
- By 2040
- 99,100 · +18.5%
- By 2050
- 109,146 · +30.5%
- By 2075
- 134,178 · +60.4%
- By 2100
- 153,653 · +83.7%
Race, ethnicity, and origin ACS 2023
- Neighborhood character
- Predominantly White (78%)
- Race & ethnicity
- White 78% Hispanic / Latino 9% Two or more races 8% Black 4% Asian 3% Native American 1%
- Hispanic origin (detail)
- Mexican 6%
- Common ancestry
- Slovak 3% Italian 3% Lithuanian 2%
- Foreign-born
- 8% · Canada, China
- Languages at home
- 91% English-only · Spanish 5% Other Indo-European 2% Chinese 1%
Political lean MEDSL · Riley
- 2024 margin
- Toss-up / Even · D 49.6% · R 47.8% · Other 2.5%
- 2008→2024 swing
- +8.8pp toward D · 2008: -7.0pp · 2024: 1.8pp
- All cycles
- 2024: D+1.8 2020: D+3.2 2016: R+4.5 2012: R+12.7 2008: R+7.0
Not yet ingested
- Civics
- —
Market trends
- HPI YoY
- ▼ -283.54%
- Current HPI
- 172.7795
- Rent YoY
- ▲ 6.02%
- Metro
- Manhattan, KS
- State GDP YoY
- —
- F500 in state
- 0
Price history
+261.0% since first listed17 events — show timeline
- 2026-05-04 Sold (Public Records) — Public Records
- 2026-04-14 Pending — FHAOR as distributed by MLS GRID
- 2025-11-13 Price Changed $324,900 FHAOR as distributed by MLS GRID
- 2025-11-03 Relisted — FHAOR as distributed by MLS GRID
- 2025-11-01 Delisted — FHAOR as distributed by MLS GRID
- 2025-10-14 Price Changed $339,900 FHAOR as distributed by MLS GRID
- 2025-09-24 Relisted — FHAOR as distributed by MLS GRID
- 2025-08-19 Pending — FHAOR as distributed by MLS GRID
- 2025-07-18 Listed $359,900 FHAOR as distributed by MLS GRID
- 2025-03-18 Price Changed $387,000 FHAOR as distributed by MLS GRID
- 2025-03-12 Price Changed $412,000 FHAOR as distributed by MLS GRID
- 2024-03-24 Rental Removed $650 APPFOLIO
- 2024-03-13 Listed for Rent $650 APPFOLIO
- 2023-08-20 Rental Removed $600 APPFOLIO
- 2022-07-25 Price Changed $600 APPFOLIO
- 2000-11-01 Sold (Public Records) $139,000 Public Records
- 1991-09-01 Sold (Public Records) $90,000 Public Records
Property tax history
+3.0%/yrLatest (2025): $5,563 · +8.1% YoY. Source: county tax records.
Cash-flow waterfall
monthlySold comps — $/sqft
last 12 mo · ≤1 miLoading sold comps…