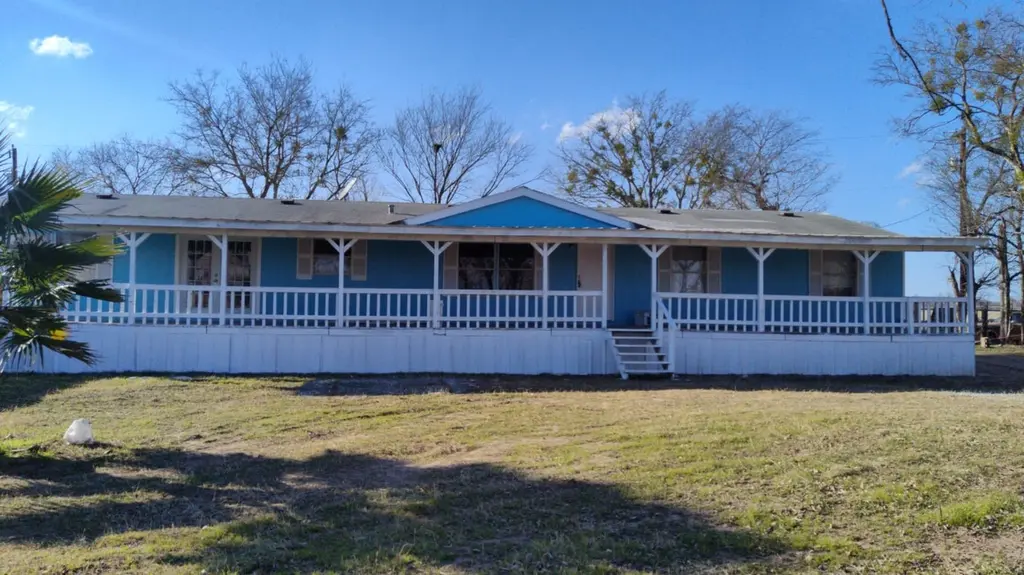
8922 Witter Ln · Belton, TX
Flood risk 4/10 · Minor
- FEMA flood zone
- AE
- Chance of flooding over 30 yrs
- 0.23%
- Est. flood insurance / yr
- $1,737 – $8,500
Fire risk 4/10 · Minor
- Est. fire insurance / yr
- $1,222 – $2,270
Heat risk 8/10 · Major
- Hot days now (above 108°F)
- 7 days/yr
- Hot days in 30 yrs
- 24 days/yr
Wind risk 8/10 · Major
- Chance of severe wind over 30 yrs
- 80.0%
Air-quality risk 1/10 · Minimal
- Unhealthy air days now
- 0 days/yr
- Unhealthy air days in 30 yrs
- 0 days/yr
Risk factors via First Street. Map © Google.
Why this score? — see what drove the C- grade
The composite is a weighted blend of 9 inputs, each scored 0–100. Each bar is that input's sub-score; the figure is the points it added to the 100-point composite (weight × sub-score).
- ARV discount +15.0/15.0
- Cash flow +14.2/30.0
- DSCR +4.3/10.0
- 1% rule +4.0/10.0
- Schools +3.8/10.0
- Condition / age +3.8/5.0
- Livability +3.4/5.0
- Rent growth +2.3/5.0
- Appreciation +0.0/10.0
$295,000
🖨 Deal sheet 📄 Offer letter ✓ Due diligence
Listing remarks MLS
* * Motivated Seller. Bring an offer * * Beautiful Ranch Style fully renovated 28X76 double Wide Manufactured home with 4Bed/2bath in fenced quiet neighborhood and 1 mobile homes with 3Bed/2bath each. Having great cash flow potential of $4780 [1295+1495+1395+595]. Please refer lease listings in CTX MLS492720, MLS 492723,MLS 492734, MLS 492744. Ideal for owner occupant having opportunity to enjoy rental income. Owner/Agent. Owner financing $50k downpayment, sales price $350k, 7.99%, 3yr balloon, 30yr amortization. Terms negotiable
Key facts
- 2.65 acre lot
- 16 parking spots
- Pool
Neighborhood map
What this means for you Summary
Snapshot
- This is a 4-bed/2.0-bath single-family listed at $295k. Condition is rated good.
Deal economics
- At list price, monthly cash flow is $-376 ($-5k/yr) — negative.
- To cash-flow at today's rent, offer at most $241k (18.4% below list).
- To meet the 1% rule (rent ≥ 1% of price), the offer needs to be $264k (10.3% below list).
- Recommended offer: $241k (18.4% below list) — sets the bar for cash-flow.
- Cap rate 6.5% vs local median 3.6% in Belton — top-decile yield for the area; either an underpriced asset or a hidden risk that comps aren't pricing in. Stress-test before assuming the spread holds.
Location & tenants
- Location reads 68/100 on livability (#462 in TX) — a middle-class / working-renter tenant base. Strengths: cost of living A+, housing A+, crime A-; Watch: employment C-, schools D, amenities F.
- Belton ISD (suburban): math 39% / reading 46% proficiency, ranked #285 of 826 in TX (top 34%) — families likely to look elsewhere, expect single-tenant / working-renter base with shorter leases.
- Market conditions: Rents soft (-0.8%/yr); 1114 active listings in the ZIP; 2 comparable units currently listed for rent nearby; solid renter incomes; 3,222 units permitted in Bell County in 2024 (246 in 5+ unit buildings).
- This rent runs 39% of the median local income ($82k/yr) — at the standard rent-burdened threshold; future hikes will face affordability resistance.
Forward outlook
- Local home prices are declining (-3.0%/yr); year-one equity from $2k of loan paydown is wiped out by about $9k of value loss. Plan a longer hold.
- Bell County population projected at +21% by 2050 — long-run rental-demand tailwind backs the buy-and-hold thesis.
Negotiation context
- It's been on market 200 days — a 12% lower offer ($260k) is reasonable based on typical stale-listing flexibility.
- 5 sale attempts since 2y ago; this cycle's ask has dropped $55k (16%) from the opening price — seller is motivated, your offer sets the floor, not the list.
Risks & watch-outs
- Watch-outs: flood insurance adds $427/mo.
- Climate carrying-cost: in FEMA flood zone AE (mandatory federal flood insurance); severe wind risk, 80% chance of damaging wind over 30y; extreme-heat days projected 7→24/yr by 2055 (HVAC capex compounding) — expect insurance premiums to compound above CPI over the hold.
Questions for the listing agent
- What do current leases actually rent for vs. the listed asking? Can we see a recent rent roll and the last 12 months of T-12 income?
- It's been on market 200 days. Have you received any prior offers? Is the seller open to a 18% concession, seller financing, or rate buy-down credit?
- What's the actual annual flood-insurance premium (NFIP or private), and is the property in a SFHA with mandatory coverage?
- Why hasn't it sold? Are there any deal-killer items the seller is aware of (foundation, flood, title, zoning, code violations)?
- Is there a deadline driving the sale (1031 exchange, divorce, estate, relocation)? That informs how much negotiation room exists.
- Schools are D-rated, which usually means shorter tenancies and higher turnover. Who's the typical renter profile here, and what's been the actual vacancy rate?
- What's the average days-on-market for RENTAL listings here right now (not sales)? A rising rental-DOM trend means longer vacancies and softer asking-rent achievability than the comps imply.
- What's the recent tenant-quality profile in this submarket — average credit score on applications, eviction rate, late-payment / NSF rate, and stable-employment percentage? A property-management company in the area should have these aggregated.
- How much new for-sale + rental construction is in the pipeline within 1–3 miles? Heavy new supply typically softens prices + rents 12–24 months out; constrained supply supports both.
Investment metrics
- 1% rule
- 0.90% ✗
- Cap rate
- 6.50%
- Cash-on-cash
- 0.74%
- DSCR
- 1.03
- GRM
- 9.3
CMA / ARV
- ARV (median comp)
- $450,000
- List price
- $295,000
- Delta
- -34.44%
- Verdict
- UNDERPRICED
- Comps
- 1 within 2.0 mi
Projected returns pro-forma
-3.0% appreciation · 0.0% rent growth · sell at horizon
- IRR
- -29.8%
- Equity multiple
- 0.04×
- Total profit
- $-79,186
- Equity at exit
- $43,985
- IRR
- -56.3%
- Equity multiple
- -0.56×
- Total profit
- $-128,500
- Equity at exit
- $25,506
Cash invested: $82,600 (down + closing). Projections, not guarantees.
Landlord ↔ Tenant lean methodology
- Overall (STATE)
- 87 Strongly Landlord-Friendly
- State Texas
- 87 Strongly Landlord-Friendly · R+5
- County
- — inherits STATE
- City
- — inherits STATE
ZIP-level market 76502
- Rents YoY
- -0.8%
- Active inventory
- 1114
- Price-to-rent
- 9.3×
Monthly cashflow live
- Estimated rent
- $2,645 medium interval (Pro) →
- Mortgage (P&I)
- −$1,547
- Tax est. 1.5%
- −$369 /mo · $4,425/yr
- Insurance
- −$123
- Flood insurance flood zone
- −$427 /mo · $5,118/yr
- HOA
- −$0
- Vacancy / Maint / Mgmt
- −$555
- Net cashflow
- $-376
Break-even live
UW: 25.0% down · 7.5% · 30yr · 1.5% tax · 5.0% vac · 8.0% maint · 8.0% mgmt
Financing live
Cash to close
- Down payment
- $73,750
- Closing costs
- $8,850
- Reserves months
- —
- Total cash needed
- —
Loan-product check · same deal, 3 products live
Conventional
25% down · 7.5% · 30yr
- Down + closing
- —
- Monthly P&I
- —
- Monthly cashflow
- —
- DSCR
- —
- Eligible?
- —
Personal DTI + credit; lowest rate.
DSCR
20% down · 8.5% · 30yr
- Down + closing
- —
- Monthly P&I
- —
- Monthly cashflow
- —
- DSCR
- —
- Eligible?
- —
No personal income docs; deal must DSCR.
Hard money
10% down · 12.0% · 12mo
- Down + closing
- —
- Monthly P&I
- —
- Monthly cashflow
- —
- DSCR
- —
- Eligible?
- —
Short-term bridge; refi at stabilization.
Rent comps 2 comps
| Address | Beds | Baths | Sqft | Rent | $/sqft | DOM | Units | Dist |
|---|---|---|---|---|---|---|---|---|
| 1719 Fossil Trl Belton, TX | 4.0 | 2.0 | 1982 | $2,095 | $1.06 | 13d | 1 | 1.19mi |
| 7008 Sun Valley Dr Temple, TX | 4.0 | 3.0 | 2341 | $3,850 | $1.64 | 21d | 1 | 1.48mi |
Listing history 25 events
-
2026-06-18days on market $295,000 Active 200 DOM
-
2026-06-17days on market $295,000 Active 199 DOM
-
2026-06-16days on market $295,000 Active 198 DOM
-
2026-06-15days on market $295,000 Active 197 DOM
-
2026-06-14days on market $295,000 Active 195 DOM
-
2026-06-13days on market $295,000 Active 194 DOM
-
2026-06-09days on market $295,000 Active 191 DOM
-
2026-06-08days on market $295,000 Active 190 DOM
-
2026-06-07days on market $295,000 Active 189 DOM
-
2026-06-05days on market $295,000 Active 186 DOM
-
2026-06-03days on market $295,000 Active 185 DOM
-
2026-06-02days on market $295,000 Active 184 DOM
-
2026-06-01days on market $295,000 Active 183 DOM
-
2026-05-31days on market $295,000 Active 182 DOM
-
2026-05-30days on market $295,000 Active 181 DOM
-
2026-04-28status Active 538-char remark
Show marketing remark (538 chars)
* * Motivated Seller. Bring an offer * * Beautiful Ranch Style fully renovated 28X76 double Wide Manufactured home with 4Bed/2bath in fenced quiet neighborhood and 1 mobile homes with 3Bed/2bath each. Having great cash flow potential of $4780 [1295+1495+1395+595]. Please refer lease listings in CTX MLS492720, MLS 492723,MLS 492734, MLS 492744. Ideal for owner occupant having opportunity to enjoy rental income. Owner/Agent. Owner financing $50k downpayment, sales price $350k, 7.99%, 3yr balloon, 30yr amortization. Terms negotiable
-
2026-04-14price $295,000 538-char remark
Show marketing remark (538 chars)
* * Motivated Seller. Bring an offer * * Beautiful Ranch Style fully renovated 28X76 double Wide Manufactured home with 4Bed/2bath in fenced quiet neighborhood and 1 mobile homes with 3Bed/2bath each. Having great cash flow potential of $4780 [1295+1495+1395+595]. Please refer lease listings in CTX MLS492720, MLS 492723,MLS 492734, MLS 492744. Ideal for owner occupant having opportunity to enjoy rental income. Owner/Agent. Owner financing $50k downpayment, sales price $350k, 7.99%, 3yr balloon, 30yr amortization. Terms negotiable
-
2025-11-17$350,000 Active 538-char remark
Show marketing remark (538 chars)
* * Motivated Seller. Bring an offer * * Beautiful Ranch Style fully renovated 28X76 double Wide Manufactured home with 4Bed/2bath in fenced quiet neighborhood and 1 mobile homes with 3Bed/2bath each. Having great cash flow potential of $4780 [1295+1495+1395+595]. Please refer lease listings in CTX MLS492720, MLS 492723,MLS 492734, MLS 492744. Ideal for owner occupant having opportunity to enjoy rental income. Owner/Agent. Owner financing $50k downpayment, sales price $350k, 7.99%, 3yr balloon, 30yr amortization. Terms negotiable
-
2025-10-22historical $1,395
-
2025-09-30price $1,395
-
2025-08-23$1,495
-
2025-08-05historical $1,695
-
2025-08-04$1,695
-
2024-07-23historical $1,395
-
2024-06-25$1,395
ⓘ Source: listings_history table (triggers on properties + properties_extension) + one-shot
backfill from property_details.listing_events for pre-trigger history.
Climate risk First Street
- Flood 4/10 Moderate FEMA zone AE · 23% chance over 30 yrs
- Wildfire 4/10 Moderate
- Heat 8/10 Severe 7 d/yr ≥108°F today · 24 d/yr by 30 yrs out
- Wind 8/10 Severe 80% chance of damaging wind over 30 yrs
- Air quality 1/10 Low 0 unhealthy d/yr today · 0 by 30 yrs out
Nearby sold comps map
Loading sold comps map…
Walkable amenities ~0.75 mi
Loading nearby amenities…
Taxation est. · year 1
- Rental income
- $31,738
- − Mortgage interest
- −$16,525
- − Property taxes
- −$4,425
- − Insurance
- −$6,594
- − Repairs & maintenance
- −$2,539
- − Management
- −$2,539
- − Depreciation
- −$8,582
- Taxable loss
- −$9,465
- Est. tax savings @ 24.0%
- +$2,272
- After-tax cash flow
- $-2,238/yr
For passive investors: Depreciation is non-cash, so a rental often shows a tax loss while cash-flowing — sheltering income. Rental losses are passive: they offset passive income freely, and up to $25,000/yr can offset ordinary (W-2) income if you actively participate and your MAGI is under $100k (phasing out to $0 by $150k); unused losses carry forward. On sale, claimed depreciation is recaptured at up to 25%, and gains may owe capital-gains tax (a 1031 exchange can defer both). Figures are a year-1 estimate at your 24.0% rate — not tax advice; consult a CPA.
Condition & rehab AI · 11 photos
This fully renovated single-family home is in good condition with updated kitchens and bathrooms, and a well-maintained exterior. It has a good potential for both resale and rental value with minor updates to the exterior and flooring.
Value-add opportunities
- Both Painting the exterior and interior walls — Fresh paint can enhance the curb appeal and interior aesthetics, making the home more attractive to potential buyers and renters.
- Both Updating the flooring in the bathrooms — Replacing outdated tile with a more modern material can improve the home's appearance and increase its value.
Renovation cost estimate screening
Value-add ROI direction
- Both Painting the exterior and interior walls — Fresh paint can enhance the curb appeal and interior aesthetics, making the home more attractive to potential buyers and renters. ↑
- Both Updating the flooring in the bathrooms — Replacing outdated tile with a more modern material can improve the home's appearance and increase its value. ↑
ⓘ Cost ranges are severity-bucket heuristics (US national rule-of-thumb). Get contractor quotes + a written scope before underwriting a rehab budget.
Schools (NCES district)
- District
- Belton ISD
- NCES district ID
- 4809860
- Math proficiency
- 39% ▼ -14.00%
- Reading proficiency
- 46% ▼ -4.00%
- Median HH income
- $61,239
- Composite
- 37.62/100
- National rank
- #4378
- State rank
- #285 of 826 in TX
Livability — Belton
- Score
- 68/100
- State rank
- #462
- US rank
- #9300
Category grades
Schools grade is shown separately in the Schools card above.
Census & demographics
- County
- Bell County · 345,090 people
- City population
- 45,928
- Metro
- Killeen-Temple, TX
- Population (ZIP)
- 52,669
- Household income
- $82,088
- Rent vs Own
- Severe rent burden
- 1890.0
Population outlook (Bell County) Hauer SSP2
- Today (2025)
- 371,114 people
- By 2030
- 389,104 · +4.8%
- By 2040
- 420,592 · +13.3%
- By 2050
- 447,779 · +20.7%
- By 2075
- 499,130 · +34.5%
- By 2100
- 505,680 · +36.3%
Race, ethnicity, and origin ACS 2023
- Neighborhood character
- Diverse neighborhood (Simpson 0.59)
- Race & ethnicity
- White 58% Hispanic / Latino 26% Two or more races 15% Black 9% Asian 3%
- Hispanic origin (detail)
- Mexican 21% Puerto Rican 2%
- Common ancestry
- Italian 2% Slovak 2% Serbian 1%
- Foreign-born
- 7% · Canada, South Korea, China
- Languages at home
- 86% English-only · Spanish 10% Other Indo-European 1% Korean 1%
Political lean MEDSL · Bell
- 2024 margin
- R (+16.2) · D 41.3% · R 57.6% · Other 1.1%
- 2008→2024 swing
- -6.5pp toward R · 2008: -9.8pp · 2024: -16.2pp
- All cycles
- 2024: R+16.2 2020: R+8.5 2016: R+15.1 2012: R+16.4 2008: R+9.8
Not yet ingested
- Civics
- —
Market trends
- HPI YoY
- ▼ -216.80%
- Current HPI
- 166.927
- Rent YoY
- ▼ -0.79%
- Metro
- Killeen-Temple, TX
- State GDP YoY
- ▲ 3.95%
- F500 in state
- 110
Industry mix (Fortune 500 HQ in TX)
| Industry | F500 HQs | Revenue |
|---|---|---|
| Energy | 16 | $1,198B |
|
||
| Technology | 5 | $198B |
|
||
| Engineering / Construction | 4 | $72B |
|
||
| Energy Services | 3 | $60B |
|
||
| Utilities | 3 | $41B |
|
||
| Healthcare | 2 | $330B |
|
||
Price history
+21047.0% since first listed10 events — show timeline
- 2026-04-28 Relisted — Unlock MLS
- 2026-04-14 Price Changed $295,000 Unlock MLS
- 2025-11-17 Listed $350,000 Unlock MLS
- 2025-10-22 Rental Removed $1,395 APPFOLIO
- 2025-09-30 Price Changed $1,395 APPFOLIO
- 2025-08-23 Listed for Rent $1,495 APPFOLIO
- 2025-08-05 Rental Removed $1,695 APPFOLIO
- 2025-08-04 Listed for Rent $1,695 APPFOLIO
- 2024-07-23 Rental Removed $1,395 APPFOLIO
- 2024-06-25 Listed for Rent $1,395 APPFOLIO
Cash-flow waterfall
monthlySold comps — $/sqft
last 12 mo · ≤1 miLoading sold comps…