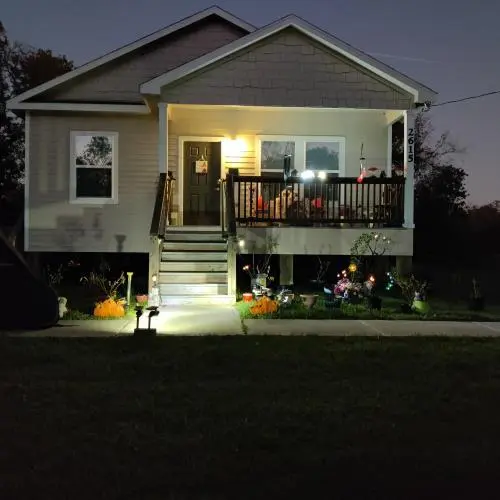
2615 Main St · Liverpool, TX
Flood risk 5/10 · Moderate
- FEMA flood zone
- X (shaded)
- Chance of flooding over 30 yrs
- 0.24%
- Est. flood insurance / yr
- $507 – $1,088
Fire risk 5/10 · Moderate
- Est. fire insurance / yr
- $1,222 – $2,270
Heat risk 10/10 · Severe
- Hot days now (above 111°F)
- 7 days/yr
- Hot days in 30 yrs
- 26 days/yr
Wind risk 9/10 · Severe
- Chance of severe wind over 30 yrs
- 99.0%
Air-quality risk 2/10 · Minimal
- Unhealthy air days now
- 1 days/yr
- Unhealthy air days in 30 yrs
- 1 days/yr
Risk factors via First Street. Map © Google.
Why this score? — see what drove the D- grade
The composite is a weighted blend of 9 inputs, each scored 0–100. Each bar is that input's sub-score; the figure is the points it added to the 100-point composite (weight × sub-score).
- ARV discount +15.0/15.0
- Cash flow +5.0/30.0
- Appreciation +5.0/10.0
- Schools +3.9/10.0
- Livability +3.2/5.0
- Rent growth +2.5/5.0
- Condition / age +2.5/5.0
- 1% rule +0.7/10.0
- DSCR +0.0/10.0
$245,000
🖨 Deal sheet 📄 Offer letter ✓ Due diligence
Listing remarks MLS
Beautiful home with handicapped accessible. Open design with contemporary design. Small town tight nit community. We have a park for kids to go and play Plus fishing to enjoy. This is a 4 bedroom 2 full baths home with wide hallways for wheelchair accessibility. Large pantry for plenty of storage. Each bedroom has a walk in closet. The master bedroom has a en suite for your convenience. It also has washer and dryer hookup central air and heat and plenty of space to enjoy outside. It also comes with two buildings a 14x24 building that has electricity hooked up to it could be made into a man cave or a she shed the other building is a 10x20 for your lawn equipment or tools. For more information please contact me at 979-645-3019 . $245,000 is asking price. It's all electric comes with dishwasher stove and refrigerator.
Key facts
- Open design
- En suite
- Wide hallways
Tags
Neighborhood map
What this means for you Summary
Snapshot
- This is a 4-bed/2.0-bath single-family listed at $245k.
Deal economics
- At list price, monthly cash flow is $-582 ($-7k/yr) — negative.
- To cash-flow at today's rent, offer at most $161k (34.4% below list).
- To meet the 1% rule (rent ≥ 1% of price), the offer needs to be $141k (42.6% below list).
- Recommended offer: $141k (42.6% below list) — sets the bar for 1% rule.
Location & tenants
- Location reads 65/100 on livability (#707 in TX) — a middle-class / working-renter tenant base. Strengths: crime A+, cost of living A+, housing A+; Watch: employment C-, schools F, amenities F.
- Alvin ISD (suburban): math 39% / reading 48% proficiency, ranked #255 of 826 in TX (top 31%) — families likely to look elsewhere, expect single-tenant / working-renter base with shorter leases.
- Market conditions: 28 active listings in the ZIP; 3,960 units permitted in Brazoria County in 2024 (593 in 5+ unit buildings).
Forward outlook
- In year one you build about $9k of equity ($2k loan paydown + $7k appreciation (3.0% local appreciation)).
- Brazoria County population projected at +44% by 2050 — long-run rental-demand tailwind backs the buy-and-hold thesis.
- By year 4, paydown + projected appreciation supports a ~$31k cash-out refi (75% LTV) — recoverable capital for the next deal without selling this one.
Negotiation context
- It's been on market 218 days — a 12% lower offer ($216k) is reasonable based on typical stale-listing flexibility.
- 3 sale attempts with the ask held roughly flat each time — persistent listings suggest the price (not the market) is what's stuck; bring a comps-based counter.
Risks & watch-outs
- Climate carrying-cost: moderate flood risk; severe wind risk, 99% chance of damaging wind over 30y; moderate wildfire risk; extreme-heat days projected 7→26/yr by 2055 (HVAC capex compounding) — expect insurance premiums to compound above CPI over the hold.
Questions for the listing agent
- What do current leases actually rent for vs. the listed asking? Can we see a recent rent roll and the last 12 months of T-12 income?
- It's been on market 218 days. Have you received any prior offers? Is the seller open to a 43% concession, seller financing, or rate buy-down credit?
- Why hasn't it sold? Are there any deal-killer items the seller is aware of (foundation, flood, title, zoning, code violations)?
- Is there a deadline driving the sale (1031 exchange, divorce, estate, relocation)? That informs how much negotiation room exists.
- Schools are F-rated, which usually means shorter tenancies and higher turnover. Who's the typical renter profile here, and what's been the actual vacancy rate?
- The area grade is low — what's the realistic commute time and amenity access for the typical tenant pool here? Any planned neighborhood developments (good or bad) we should know about?
- What's the average days-on-market for RENTAL listings here right now (not sales)? A rising rental-DOM trend means longer vacancies and softer asking-rent achievability than the comps imply.
- What's the recent tenant-quality profile in this submarket — average credit score on applications, eviction rate, late-payment / NSF rate, and stable-employment percentage? A property-management company in the area should have these aggregated.
- How much new for-sale + rental construction is in the pipeline within 1–3 miles? Heavy new supply typically softens prices + rents 12–24 months out; constrained supply supports both.
Investment metrics
- 1% rule
- 0.57% ✗
- Cap rate
- 3.44%
- Cash-on-cash
- -10.18%
- DSCR
- 0.55
- GRM
- 14.5
CMA / ARV
- ARV (median comp)
- $299,950
- List price
- $245,000
- Delta
- -18.32%
- Verdict
- UNDERPRICED
- Comps
- 11 within 1.0 mi
Show comp detail 3 sales within ~0.75 mi
| Address | Dist | Beds/Ba | Sqft | Sold | Price | $/sf | Match |
|---|---|---|---|---|---|---|---|
| 431 Shady Oaks Hbr | 0.61mi | 4/2.0 | 1,626 (+12%) | 11mo | $309,900 | $191 | 43 |
| 615 Shady Oaks Hbr | 0.70mi | 3/1.0 (-1) | 1,240 (-15%) | 2mo | $170,000 | $137 | 32 |
| 9903 County Road 171 | 0.59mi | 3/2.0 (-1) | 1,676 (+15%) | 18mo | $369,500 | $220 | 27 |
Match score weights: distance 35% · size 25% · config 20% · recency 20%. Top-matched comps best support the ARV.
Projected returns pro-forma
3.0% appreciation · 3.0% rent growth · sell at horizon
- IRR
- -1.9%
- Equity multiple
- 0.89×
- Total profit
- $-7,517
- Equity at exit
- $110,163
- IRR
- 2.4%
- Equity multiple
- 1.37×
- Total profit
- $25,236
- Equity at exit
- $169,774
Cash invested: $68,600 (down + closing). Projections, not guarantees.
Landlord ↔ Tenant lean methodology
- Overall (STATE)
- 87 Strongly Landlord-Friendly
- State Texas
- 87 Strongly Landlord-Friendly · R+5
- County
- — inherits STATE
- City
- — inherits STATE
ZIP-level market 77577
- Active inventory
- 28
- Price-to-rent
- 14.5×
Monthly cashflow live
- Estimated rent
- $1,407 medium interval (Pro) →
- Mortgage (P&I)
- −$1,285
- Tax est. 1.5%
- −$306 /mo · $3,675/yr
- Insurance
- −$102
- HOA
- −$0
- Vacancy / Maint / Mgmt
- −$295
- Net cashflow
- $-582
Break-even live
UW: 25.0% down · 7.5% · 30yr · 1.5% tax · 5.0% vac · 8.0% maint · 8.0% mgmt
Financing live
Cash to close
- Down payment
- $61,250
- Closing costs
- $7,350
- Reserves months
- —
- Total cash needed
- —
Loan-product check · same deal, 3 products live
Conventional
25% down · 7.5% · 30yr
- Down + closing
- —
- Monthly P&I
- —
- Monthly cashflow
- —
- DSCR
- —
- Eligible?
- —
Personal DTI + credit; lowest rate.
DSCR
20% down · 8.5% · 30yr
- Down + closing
- —
- Monthly P&I
- —
- Monthly cashflow
- —
- DSCR
- —
- Eligible?
- —
No personal income docs; deal must DSCR.
Hard money
10% down · 12.0% · 12mo
- Down + closing
- —
- Monthly P&I
- —
- Monthly cashflow
- —
- DSCR
- —
- Eligible?
- —
Short-term bridge; refi at stabilization.
Listing history 21 events
-
2026-06-18days on market $245,000 Active 218 DOM
-
2026-06-17days on market $245,000 Active 217 DOM
-
2026-06-16days on market $245,000 Active 216 DOM
-
2026-06-15days on market $245,000 Active 215 DOM
-
2026-06-13days on market $245,000 Active 213 DOM
-
2026-06-13days on market $245,000 Active 212 DOM
-
2026-06-09days on market $245,000 Active 209 DOM
-
2026-06-08days on market $245,000 Active 208 DOM
-
2026-06-07days on market $245,000 Active 207 DOM
-
2026-06-04days on market $245,000 Active 204 DOM
-
2026-06-03days on market $245,000 Active 203 DOM
-
2026-06-02days on market $245,000 Active 202 DOM
-
2026-06-01days on market $245,000 Active 201 DOM
-
2026-05-31days on market $245,000 Active 200 DOM
-
2025-11-10$245,000 Active 826-char remark
Show marketing remark (826 chars)
Beautiful home with handicapped accessible. Open design with contemporary design. Small town tight nit community. We have a park for kids to go and play Plus fishing to enjoy. This is a 4 bedroom 2 full baths home with wide hallways for wheelchair accessibility. Large pantry for plenty of storage. Each bedroom has a walk in closet. The master bedroom has a en suite for your convenience. It also has washer and dryer hookup central air and heat and plenty of space to enjoy outside. It also comes with two buildings a 14x24 building that has electricity hooked up to it could be made into a man cave or a she shed the other building is a 10x20 for your lawn equipment or tools. For more information please contact me at 979-645-3019 . $245,000 is asking price. It's all electric comes with dishwasher stove and refrigerator.
-
2025-11-04historical
-
2025-10-08price $245,000
-
2025-09-21$254,000 Active
-
2025-09-16historical
-
2025-09-09price $248,000
-
2025-08-19$255,000 Active
ⓘ Source: listings_history table (triggers on properties + properties_extension) + one-shot
backfill from property_details.listing_events for pre-trigger history.
Climate risk First Street
- Flood 5/10 Major FEMA zone X (shaded) · 24% chance over 30 yrs
- Wildfire 5/10 Major
- Heat 10/10 Extreme 7 d/yr ≥111°F today · 26 d/yr by 30 yrs out
- Wind 9/10 Extreme 99% chance of damaging wind over 30 yrs
- Air quality 2/10 Low 1 unhealthy d/yr today · 1 by 30 yrs out
Nearby sold comps map
Loading sold comps map…
Walkable amenities ~0.75 mi
Loading nearby amenities…
Taxation est. · year 1
- Rental income
- $16,882
- − Mortgage interest
- −$13,724
- − Property taxes
- −$3,675
- − Insurance
- −$1,225
- − Repairs & maintenance
- −$1,351
- − Management
- −$1,351
- − Depreciation
- −$7,127
- Taxable loss
- −$11,570
- Est. tax savings @ 24.0%
- +$2,777
- After-tax cash flow
- $-4,204/yr
For passive investors: Depreciation is non-cash, so a rental often shows a tax loss while cash-flowing — sheltering income. Rental losses are passive: they offset passive income freely, and up to $25,000/yr can offset ordinary (W-2) income if you actively participate and your MAGI is under $100k (phasing out to $0 by $150k); unused losses carry forward. On sale, claimed depreciation is recaptured at up to 25%, and gains may owe capital-gains tax (a 1031 exchange can defer both). Figures are a year-1 estimate at your 24.0% rate — not tax advice; consult a CPA.
Schools (NCES district)
- District
- Alvin ISD
- NCES district ID
- 4808090
- Math proficiency
- 39% ▼ -11.00%
- Reading proficiency
- 48% ▬ 0.00%
- Median HH income
- $66,740
- Composite
- 38.96/100
- National rank
- #4080
- State rank
- #255 of 826 in TX
Livability — Liverpool
- Score
- 65/100
- State rank
- #707
- US rank
- #13166
Category grades
Schools grade is shown separately in the Schools card above.
Census & demographics
- Population (ZIP)
- 1,288
Population outlook (Brazoria County) Hauer SSP2
- Today (2025)
- 420,414 people
- By 2030
- 457,585 · +8.8%
- By 2040
- 532,232 · +26.6%
- By 2050
- 605,399 · +44.0%
- By 2075
- 779,358 · +85.4%
- By 2100
- 883,759 · +110.2%
Race, ethnicity, and origin ACS 2023
- Neighborhood character
- Predominantly White (79%)
- Race & ethnicity
- White 79% Hispanic / Latino 16% Two or more races 7% Black 3%
- Hispanic origin (detail)
- Mexican 15%
- Common ancestry
- Slovak 5% Romanian 2% Portuguese 2%
- Foreign-born
- 8% · Canada
- Languages at home
- 83% English-only · Spanish 17%
Political lean MEDSL · Brazoria
- 2024 margin
- R (+19.7) · D 39.5% · R 59.2% · Other 1.3%
- 2008→2024 swing
- +9.9pp toward D · 2008: -29.6pp · 2024: -19.7pp
- All cycles
- 2024: R+19.7 2020: R+18.2 2016: R+24.6 2012: R+34.2 2008: R+29.6
Not yet ingested
- Civics
- —
Market trends
- HPI YoY
- —
- Current HPI
- —
- Rent YoY
- —
- Metro
- —
- State GDP YoY
- ▲ 3.95%
- F500 in state
- 110
Industry mix (Fortune 500 HQ in TX)
| Industry | F500 HQs | Revenue |
|---|---|---|
| Energy | 16 | $1,198B |
|
||
| Technology | 5 | $198B |
|
||
| Engineering / Construction | 4 | $72B |
|
||
| Energy Services | 3 | $60B |
|
||
| Utilities | 3 | $41B |
|
||
| Healthcare | 2 | $330B |
|
||
Price history
-3.9% since first listed7 events — show timeline
- 2025-11-10 Listed $245,000 Fizber.com
- 2025-11-04 Listing Removed — HARMLS
- 2025-10-08 Price Changed $245,000 HARMLS
- 2025-09-21 Listed $254,000 HARMLS
- 2025-09-16 Listing Removed — HARMLS
- 2025-09-09 Price Changed $248,000 HARMLS
- 2025-08-19 Listed $255,000 HARMLS
Cash-flow waterfall
monthlySold comps — $/sqft
last 12 mo · ≤1 miLoading sold comps…