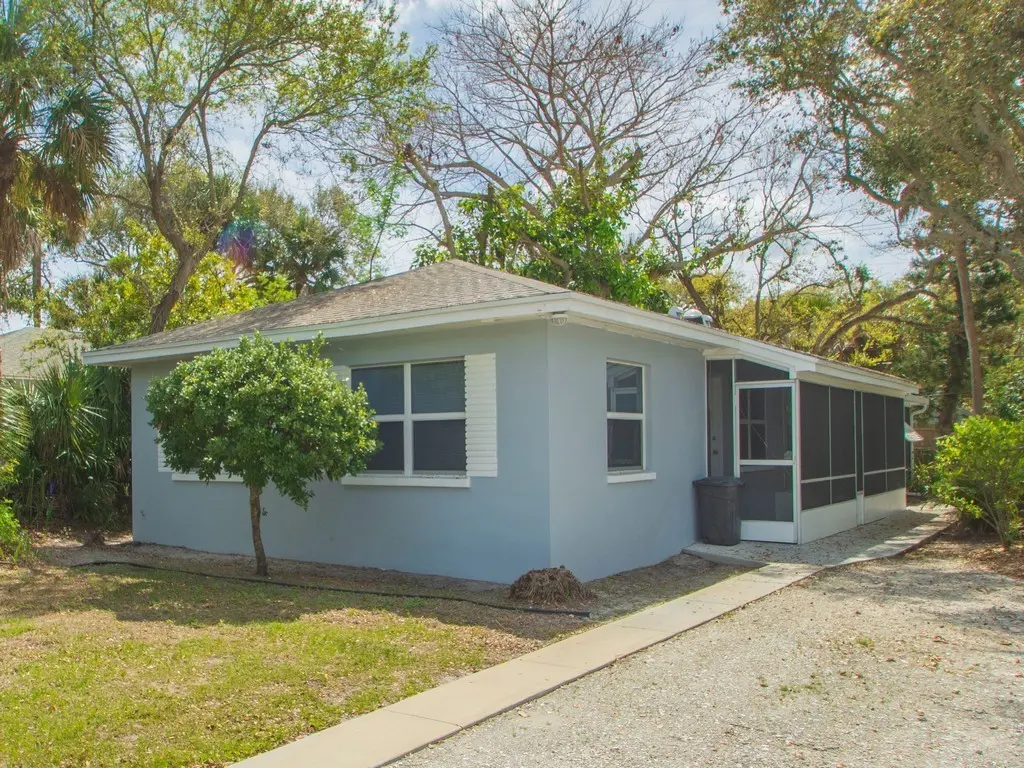
856 Dahlia Ln · Vero Beach, FL
Flood risk 7/10 · Major
- FEMA flood zone
- X (unshaded)
- Chance of flooding over 30 yrs
- 0.76%
- Est. flood insurance / yr
- $507 – $1,088
Fire risk 1/10 · Minimal
- Est. fire insurance / yr
- $947 – $1,759
Heat risk 10/10 · Severe
- Hot days now (above 105°F)
- 7 days/yr
- Hot days in 30 yrs
- 25 days/yr
Wind risk 10/10 · Severe
- Chance of severe wind over 30 yrs
- 99.0%
Air-quality risk 1/10 · Minimal
- Unhealthy air days now
- 0 days/yr
- Unhealthy air days in 30 yrs
- 0 days/yr
Risk factors via First Street. Map © Google.
Why this score? — see what drove the D grade
The composite is a weighted blend of 9 inputs, each scored 0–100. Each bar is that input's sub-score; the figure is the points it added to the 100-point composite (weight × sub-score).
- Cash flow +13.2/30.0
- ARV discount +7.5/15.0
- Rent growth +5.0/5.0
- Schools +4.2/10.0
- DSCR +4.0/10.0
- Livability +4.0/5.0
- 1% rule +2.6/10.0
- Condition / age +2.5/5.0
- Appreciation +0.0/10.0
$850,000
🖨 Deal sheet (PDF) 📄 Offer letter ✓ Due diligence
Listing remarks
Excellent investment opportunity located East of A1A in the heart of Central Beach just steps from the ocean & farmers market. This income-producing duplex offers 2BR/2BA (Unit A) w/ bonus rm & laundry, while Unit B features 2BR/1BA. Adorable layouts, private entrances, 1 off street parking spot, plenty of on street parking & strong rental potential - listed for $2,500 & $3,000 a month. New Roof 2021! Convenient location near shopping, dining, & beaches. Great opportunity to add to your portfolio or live in 1 unit & rent the other! Sizes are approx/subj to error.
Key facts
- Private entrances
- Parking
- Built 1955
Tags
Property features AI
Finance
- Other: Two separate electric meters
- Financial info: Operating expense reported: $3,975
- HOA & community: Association: DALE SORENSEN REAL ESTATE
Exterior
- Parking: Off-street parking; Space for 1 vehicle
- Utilities: Public water; Public sewer
- Home design: Single-story building; Shingle roof; Constructed of block and concrete; Property currently used as residential with potential for mixed use
- Construction: Block and concrete construction; Shingle roof; One story
- Exterior features: Enclosed porch; Porch with screened area
Interior
- Bedrooms: Two-bedroom units (two separate units each with 2 bedrooms)
- Flooring: Terrazzo flooring; Tile flooring
- Bathrooms: Each unit includes its own bath
- Heating & cooling: Central heating; Central air conditioning
- Interior features: Sliding doors; High ceilings
- Laundry & utility: Laundry located outside
Neighborhood map
What this means for you Summary
Snapshot
- This is a 4-bed/1.0-bath other listed at $850k.
Deal economics
- At list price, monthly cash flow is $-82 ($-988/yr) — negative.
- To cash-flow at today's rent, offer at most $835k (1.7% below list).
- To meet the 1% rule (rent ≥ 1% of price), the offer needs to be $649k (23.6% below list).
- Recommended offer: $649k (23.6% below list) — sets the bar for 1% rule.
- Cap rate 6.3% vs local median 2.8% in Vero Beach — top-decile yield for the area; either an underpriced asset or a hidden risk that comps aren't pricing in. Stress-test before assuming the spread holds.
Location & tenants
- Location reads 80/100 on livability (#116 in FL, #1,784 nationally) — a professional / high-income tenant draw. Strengths: crime A+, commute A+, health & safety A+; Watch: employment D+, amenities D.
- Indian River (other): math 48% / reading 52% proficiency, ranked #35 of 73 in FL (top 48%) — acceptable for families but not a draw, mixed tenant base, ~2y average lease.
- Zoned schools: Beachland Elementary School (math 54% / reading 58%, grade C+, #832 of 2,144 statewide, top 40%, 523 students, 39% FRL); Gifford Middle School (math 46% / reading 45%, grade D+, #305 of 571 statewide, top 54%, 582 students, 72% FRL); Vero Beach High School (math 28% / reading 43%, grade F, #367 of 667 statewide, top 57%, 2,847 students, 50% FRL) — zoned schools at 54% FRL track the district average.
- Market conditions: Rents rising fast (+11.0%/yr); 501 active listings in the ZIP; 13 comparable units currently listed for rent nearby; rentals at typical pace (median 16d on market — plan ~3-4 weeks tenant-placement turnaround); high-income renter base; 564 units permitted in Indian River County in 2024 (281 in 5+ unit buildings).
- At $6,490/mo this rent would consume 52% of the median local household income ($150k/yr) (locally 119% of renters already pay >50% of income on rent) — very limited rent-growth headroom before tenants either downsize or default.
Forward outlook
- Local home prices are declining (-3.0%/yr); year-one equity from $6k of loan paydown is wiped out by about $26k of value loss. Plan a longer hold.
- Indian River County population projected at +18% by 2050 — long-run rental-demand tailwind backs the buy-and-hold thesis.
Negotiation context
- It's been on market 69 days — a 6% lower offer ($799k) is reasonable based on typical stale-listing flexibility.
- 2 sale attempts; this cycle's ask has dropped $50k (6%) from the opening price — seller is motivated, your offer sets the floor, not the list.
Risks & watch-outs
- Watch-outs: flood insurance adds $66/mo; built in 1955 — expect roof / HVAC / electrical / plumbing capex.
- Climate carrying-cost: major flood risk; severe wind risk, 99% chance of damaging wind over 30y; extreme-heat days projected 7→25/yr by 2055 (HVAC capex compounding) — expect insurance premiums to compound above CPI over the hold.
Questions for the listing agent
- What do current leases actually rent for vs. the listed asking? Can we see a recent rent roll and the last 12 months of T-12 income?
- It's been on market 69 days. Have you received any prior offers? Is the seller open to a 24% concession, seller financing, or rate buy-down credit?
- Built in 1955 — when were the roof, HVAC, electrical panel, plumbing, and water heater last replaced?
- What's the actual annual flood-insurance premium (NFIP or private), and is the property in a SFHA with mandatory coverage?
- Why hasn't it sold? Are there any deal-killer items the seller is aware of (foundation, flood, title, zoning, code violations)?
- Is there a deadline driving the sale (1031 exchange, divorce, estate, relocation)? That informs how much negotiation room exists.
- The area grade is low — what's the realistic commute time and amenity access for the typical tenant pool here? Any planned neighborhood developments (good or bad) we should know about?
- What's the average days-on-market for RENTAL listings here right now (not sales)? A rising rental-DOM trend means longer vacancies and softer asking-rent achievability than the comps imply.
- What's the recent tenant-quality profile in this submarket — average credit score on applications, eviction rate, late-payment / NSF rate, and stable-employment percentage? A property-management company in the area should have these aggregated.
- How much new for-sale + rental construction is in the pipeline within 1–3 miles? Heavy new supply typically softens prices + rents 12–24 months out; constrained supply supports both.
Investment metrics
- 1% rule
- 0.76% ✗
- Cap rate
- 6.27%
- Cash-on-cash
- -0.08%
- DSCR
- 1.00
- GRM
- 10.9
CMA / ARV
No comps found within radius.
Projected returns pro-forma
-3.0% appreciation · 8.0% rent growth · sell at horizon
- IRR
- -12.2%
- Equity multiple
- 0.54×
- Total profit
- $-108,995
- Equity at exit
- $126,738
- IRR
- 2.6%
- Equity multiple
- 1.22×
- Total profit
- $53,176
- Equity at exit
- $73,492
Cash invested: $238,000 (down + closing). Projections, not guarantees.
Landlord ↔ Tenant lean methodology
- Overall (STATE)
- 87 Strongly Landlord-Friendly
- State Florida
- 87 Strongly Landlord-Friendly · R+3
- County
- — inherits STATE
- City
- — inherits STATE
ZIP-level market 32963
- Rents YoY
- 11.0%
- Active inventory
- 501
- Price-to-rent
- 10.9×
Monthly cashflow live
- Estimated rent
- $6,490 high interval (Pro) →
- Mortgage (P&I)
- −$4,457
- Tax from tax record
- −$331 /mo · $3,975/yr
- Insurance
- −$354
- Flood insurance flood zone
- −$66 /mo · $798/yr
- HOA
- −$0
- Vacancy / Maint / Mgmt
- −$1,363
- Net cashflow
- $-82
Break-even live
Sensitivity live
| Price | -10% $399 | -5% $158 | +0% $-82 | +5% $-323 | +10% $-564 |
|---|---|---|---|---|---|
| Rent | -10% $-595 | -5% $-339 | +0% $-82 | +5% $174 | +10% $430 |
| Rate | -1.0pp $346 | -0.5pp $134 | base $-82 | +0.5pp $-303 | +1.0pp $-527 |
UW: 25.0% down · 7.5% · 30yr · 1.5% tax · 5.0% vac · 8.0% maint · 8.0% mgmt
Financing live
Cash to close
- Down payment
- $212,500
- Closing costs
- $25,500
- Reserves months
- —
- Total cash needed
- —
Loan-product check · same deal, 3 products live
Conventional
25% down · 7.5% · 30yr
- Down + closing
- —
- Monthly P&I
- —
- Monthly cashflow
- —
- DSCR
- —
- Eligible?
- —
Personal DTI + credit; lowest rate.
DSCR
20% down · 8.5% · 30yr
- Down + closing
- —
- Monthly P&I
- —
- Monthly cashflow
- —
- DSCR
- —
- Eligible?
- —
No personal income docs; deal must DSCR.
Hard money
10% down · 12.0% · 12mo
- Down + closing
- —
- Monthly P&I
- —
- Monthly cashflow
- —
- DSCR
- —
- Eligible?
- —
Short-term bridge; refi at stabilization.
Rent comps 13 comps
| Address | Beds | Baths | Sqft | Rent | $/sqft | DOM | Units | Dist |
|---|---|---|---|---|---|---|---|---|
| 786 Dahlia Ln Vero Beach, FL | 3.0 | 2.0 | 1592 | $6,000 | $3.77 | 23d | 1 | 0.07mi |
| 725 Dahlia Ln Vero Beach, FL | 3.0 | 3.0 | 1455 | $4,500 | $3.09 | 15d | 1 | 0.12mi |
| 626 Gardenia Ln Vero Beach, FL | 3.0 | 2.0 | 1311 | $2,800 | $2.14 | 15d | 1 | 0.25mi |
| 546 Flamevine Ln Vero Beach, FL | 3.0 | 2.0 | 1638 | $3,000 | $1.83 | 15d | 1 | 0.31mi |
| 2700 Ocean Dr #404 Vero Beach, FL | 3.0 | 2.0 | 1150 | $9,000 | $7.83 | 23d | 1 | 0.34mi |
| 725 Acacia Rd Vero Beach, FL | 3.0 | 2.5 | 1457 | $5,000 | $3.43 | 15d | 1 | 0.34mi |
| 530 Cypress Rd Vero Beach, FL | 3.0 | 3.0 | 1677 | $8,500 | $5.07 | 15d | 1 | 0.53mi |
| 326 Date Palm Rd Vero Beach, FL | 3.0 | 2.0 | 1720 | $10,000 | $5.81 | 15d | 1 | 0.73mi |
| 3939 Ocean Dr Unit B-407 Vero Beach, FL | 3.0 | 2.0 | 1700 | $7,000 | $4.12 | 23d | 1 | 0.76mi |
| 3816 Mockingbird Dr Vero Beach, FL | 3.0 | 3.0 | 1600 | $13,000 | $8.12 | 23d | 1 | 0.80mi |
| 4141 Ocean Dr Vero Beach, FL | 2.0–3.0 | 2.0 | 1200 | $8,500 | $7.08 | 15d | 4 | 0.94mi |
| 915 Marigold Ln Vero Beach, FL | 3.0 | 2.0 | 1160 | $3,000 | $2.59 | 23d | 1 | 1.18mi |
| 1890 Tarpon Ln #302 Vero Beach, FL | 3.0 | 2.0 | 1844 | $8,000 | $4.34 | 23d | 1 | 1.43mi |
Listing history 21 events
-
2026-06-22days on market $850,000 Active 69 DOM
-
2026-06-19days on market $850,000 Active 67 DOM
-
2026-06-18days on market $850,000 Active 66 DOM
-
2026-06-17days on market $850,000 Active 65 DOM
-
2026-06-16days on market $850,000 Active 64 DOM
-
2026-06-15days on market $850,000 Active 63 DOM
-
2026-06-14days on market $850,000 Active 61 DOM
-
2026-06-13days on market $850,000 Active 60 DOM
-
2026-06-10days on market $850,000 Active 58 DOM
-
2026-06-09days on market $850,000 Active 57 DOM
-
2026-06-08days on market $850,000 Active 56 DOM
-
2026-06-07days on market $850,000 Active 55 DOM
-
2026-06-05days on market $850,000 Active 52 DOM
-
2026-06-02days on market $850,000 Active 50 DOM
-
2026-06-01days on market $850,000 Active 49 DOM
-
2026-05-31days on market $850,000 Active 48 DOM
-
2026-05-30days on market $850,000 Active 47 DOM
-
2026-05-22status Active
-
2026-05-15historical Active Under Contract
-
2026-05-05price $850,000
-
2026-04-13$900,000 Active
ⓘ Source: listings_history table (triggers on properties + properties_extension) + one-shot
backfill from property_details.listing_events for pre-trigger history.
Tax reassessment forecast FL · Resets to sale price
- Current annual tax
- $3,975 · $331/mo
- Projected year-2 tax
- $7,055 · $588/mo
- Expected delta
- +$3,080/yr (+$257/mo · 77.5%)
ⓘ Screening estimate from a state-policy table — verify with the county assessor before closing.
Climate risk First Street
- Flood 7/10 Severe FEMA zone X (unshaded) · 76% chance over 30 yrs
- Wildfire 1/10 Low
- Heat 10/10 Extreme 7 d/yr ≥105°F today · 25 d/yr by 30 yrs out
- Wind 10/10 Extreme 99% chance of damaging wind over 30 yrs
- Air quality 1/10 Low 0 unhealthy d/yr today · 0 by 30 yrs out
Nearby sold comps map
Loading sold comps map…
Walkable amenities ~0.75 mi
Loading nearby amenities…
Taxation est. · year 1
- Rental income
- $77,879
- − Mortgage interest
- −$47,613
- − Property taxes
- −$3,975
- − Insurance
- −$5,048
- − Repairs & maintenance
- −$6,230
- − Management
- −$6,230
- − Depreciation
- −$24,727
- Taxable loss
- −$15,945
- Est. tax savings @ 24.0%
- +$3,827
- After-tax cash flow
- $2,838/yr
For passive investors: Depreciation is non-cash, so a rental often shows a tax loss while cash-flowing — sheltering income. Rental losses are passive: they offset passive income freely, and up to $25,000/yr can offset ordinary (W-2) income if you actively participate and your MAGI is under $100k (phasing out to $0 by $150k); unused losses carry forward. On sale, claimed depreciation is recaptured at up to 25%, and gains may owe capital-gains tax (a 1031 exchange can defer both). Figures are a year-1 estimate at your 24.0% rate — not tax advice; consult a CPA.
Schools (NCES district)
- District
- Indian River
- NCES district ID
- 1200930
- Math proficiency
- 48% ▼ -9.00%
- Reading proficiency
- 52% ▼ -3.00%
- Median HH income
- $46,597
- Composite
- 42.45/100
- National rank
- #3218
- State rank
- #35 of 73 in FL
Livability — Vero Beach
- Score
- 80/100
- State rank
- #116
- US rank
- #1784
Category grades
Schools grade is shown separately in the Schools card above.
Census & demographics
- Census place
- Vero Beach, FL
- County
- Indian River County · 143,738 people
- City population
- 98,707
- Metro
- Sebastian-Vero Beach, FL
- Population (ZIP)
- 15,008
- Household income
- $149,923
- Rent vs Own
- Severe rent burden
- 119.0
Population outlook (Indian River County) Hauer SSP2
- Today (2025)
- 165,104 people
- By 2030
- 172,869 · +4.7%
- By 2040
- 185,640 · +12.4%
- By 2050
- 194,465 · +17.8%
- By 2075
- 211,115 · +27.9%
- By 2100
- 211,781 · +28.3%
Race, ethnicity, and origin ACS 2023
- Neighborhood character
- Predominantly White (92%)
- Race & ethnicity
- White 92% Two or more races 5% Hispanic / Latino 4% Asian 2%
- Common ancestry
- Slovak 5% Lithuanian 4% Italian 3%
- Foreign-born
- 9% · Canada
- Languages at home
- 92% English-only · Spanish 3% Other Indo-European 1% German/W. Germanic 1%
Political lean MEDSL · Indian River
- 2024 margin
- Strong R (+27.4) · D 36.0% · R 63.4%
- 2008→2024 swing
- -12.5pp toward R · 2008: -14.8pp · 2024: -27.4pp
- All cycles
- 2024: R+27.4 2020: R+21.6 2016: R+24.5 2012: R+22.3 2008: R+14.8
Not yet ingested
- Civics
- —
Market trends
- HPI YoY
- ▼ -180.47%
- Current HPI
- 312.0326
- Rent YoY
- ▲ 11.04%
- Metro
- Sebastian-Vero Beach, FL
- State GDP YoY
- ▲ 3.28%
- F500 in state
- 36
Industry mix (Fortune 500 HQ in FL)
| Industry | F500 HQs | Revenue |
|---|---|---|
| Industrial Technology | 2 | $29B |
|
||
| Insurance | 2 | $17B |
|
||
| Retail | 1 | $60B |
|
||
| Technology Distribution | 1 | $58B |
|
||
| Homebuilding | 1 | $35B |
|
||
| Technology Manufacturing | 1 | $35B |
|
||
Price history
-5.6% since first listed4 events — show timeline
- 2026-05-22 Relisted — RAIRCMLS
- 2026-05-15 Contingent — RAIRCMLS
- 2026-05-05 Price Changed $850,000 RAIRCMLS
- 2026-04-13 Listed $900,000 RAIRCMLS
Property tax history
+5.6%/yrLatest (2025): $3,975 · -27.4% YoY. Source: county tax records.
Cash-flow waterfall
monthlySold comps — $/sqft
last 12 mo · ≤1 miLoading sold comps…