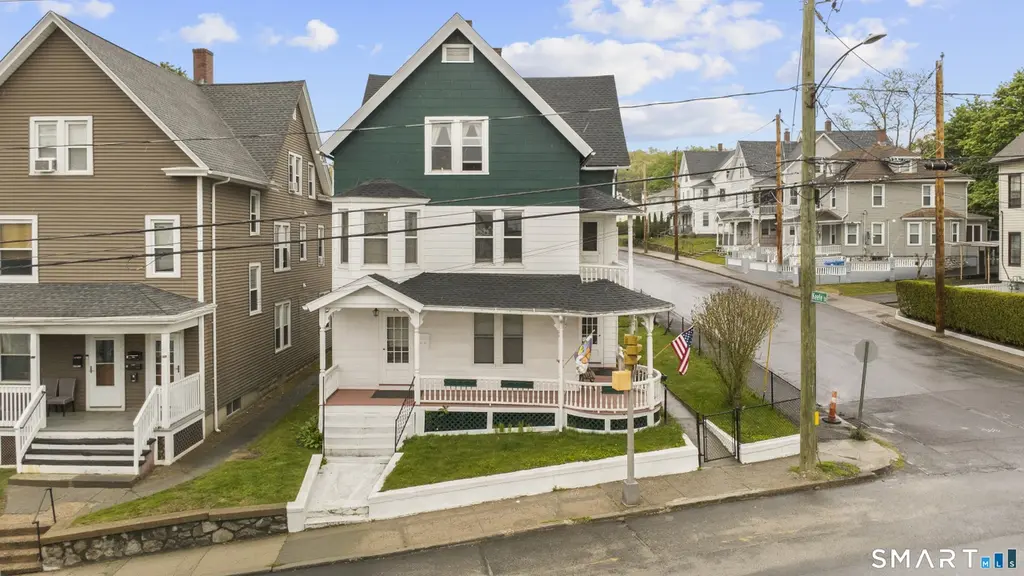
 Triplex
763 Baldwin St · Waterbury, CT
Flood risk 1/10 · Minimal
- FEMA flood zone
- X (unshaded)
- Chance of flooding over 30 yrs
- 0.0%
- Est. flood insurance / yr
- $473 – $860
Fire risk 1/10 · Minimal
- Est. fire insurance / yr
- $829 – $1,539
Heat risk 5/10 · Moderate
- Hot days now (above 96°F)
- 7 days/yr
- Hot days in 30 yrs
- 16 days/yr
Wind risk 6/10 · Moderate
- Chance of severe wind over 30 yrs
- 27.0%
Air-quality risk 3/10 · Minor
- Unhealthy air days now
- 2 days/yr
- Unhealthy air days in 30 yrs
- 3 days/yr
Risk factors via First Street. Map © Google.
Why this score? — see what drove the C+ grade
The composite is a weighted blend of 9 inputs, each scored 0–100. Each bar is that input's sub-score; the figure is the points it added to the 100-point composite (weight × sub-score).
- Cash flow +27.1/30.0
- DSCR +9.4/10.0
- 1% rule +7.3/10.0
- Appreciation +5.7/10.0
- ARV discount +5.0/15.0
- Livability +4.0/5.0
- Rent growth +2.5/5.0
- Condition / age +2.2/5.0
- Schools +1.5/10.0
$399,900
🖨 Deal sheet (PDF) 📄 Offer letter ✓ Due diligence
Multi-family units
County records classify this as Multi-Family (2-4 Unit). Listing-text estimate: 3 units. confirmed
Listing remarks
Excellent investment opportunity or owner-occupied property! This well-maintained fully unoccupied * * * three-family home features three spacious units, each offering 2 bedrooms and 1 full bathroom with comfortable layouts and plenty of natural light. Separate living and dining areas provide ample space for tenants, while the property's multi-family setup offers strong income-producing potential. Conveniently located near shopping, restaurants, schools, public transportation, and major highways, making commuting easy. Whether you're looking to expand your investment portfolio or live in one unit while collecting rental income from the others, this property presents a fantastic opportunit
Key facts
- Multi family setup
- Three family home
- Laundry hook ups
Tags
Property features AI
Exterior
- Utilities: Public water connected; Public sewer connected; 40-gallon hot water tank
- Home design: Multi-family property (3-family)
- Construction: Frame construction; Concrete and stone foundation; Asphalt shingle roof
- Exterior features: Corner lot; Sloping lot; Shingle siding
Interior
- Bedrooms: 6 bedrooms
- Bathrooms: 3 full bathrooms
- Heating & cooling: Hot water heating (natural gas); Window unit cooling
- Interior features: 15 total rooms; Full unfinished basement
Neighborhood map
What this means for you Summary
Snapshot
- This is a 3 × 2-bed/1.0-bath units multifamily listed at $400k. Condition is rated fair.
Deal economics
- At list price, monthly cash flow is $1k ($14k/yr) — positive. Per door: $379/mo.
- The deal already cash-flows at list — no discount required.
- Meets the 1% rule at list price ($5k rent vs $400k).
- Cap rate 9.7% vs local median 3.5% in Waterbury — top-decile yield for the area; either an underpriced asset or a hidden risk that comps aren't pricing in. Stress-test before assuming the spread holds.
Location & tenants
- Location reads 79/100 on livability (#32 in CT, #2,205 nationally) — a middle-class / working-renter tenant base. Strengths: commute A+, cost of living A+, housing A+; Watch: crime D, employment D.
- Waterbury School District (suburban): math 12% / reading 23% proficiency, ranked #148 of 153 in CT (top 97%) — low school quality limits family demand, transient renter base, plan for 1-2y turnover; 73% free/reduced lunch — lower-income household profile, screen leases tightly.
- Zoned schools: Washington School (math 2% / reading 8%, grade F, #545 of 553 statewide, top 99%, 296 students, 79% FRL); West Side Middle School (math 8% / reading 23%, grade F, #165 of 175 statewide, top 94%, 817 students, 81% FRL); Crosby High School (math 2% / reading 17%, grade F, #187 of 194 statewide, top 96%, 1,400 students, 84% FRL).
- Market conditions: 43 active listings in the ZIP; 1 comparable units currently listed for rent nearby; 502 units permitted in Naugatuck Valley Planning Region in 2024 (171 in 5+ unit buildings).
- At $4,938/mo this rent would consume 113% of the median local household income ($52k/yr) (locally 801% of renters already pay >50% of income on rent) — very limited rent-growth headroom before tenants either downsize or default.
Forward outlook
- In year one you build about $8k of equity ($3k loan paydown + $6k appreciation (1.4% local appreciation)).
- At projected returns (1.4% appreciation + 3.0% rent growth), your $112k cash investment doubles in ~5 years — after that, you're playing with house money.
- By year 5, paydown + projected appreciation supports a ~$38k cash-out refi (75% LTV) — recoverable capital for the next deal without selling this one.
Negotiation context
- Only 4 days on market — expect competitive offers; lowballing is unlikely to land.
Risks & watch-outs
- Watch-outs: built in 1896 — expect roof / HVAC / electrical / plumbing capex.
- Climate carrying-cost: major wind risk, 27% chance of damaging wind over 30y; extreme-heat days projected 7→16/yr by 2055 (HVAC capex compounding) — expect insurance premiums to compound above CPI over the hold.
Questions for the listing agent
- Can we see the unit-by-unit rent roll, current vacancy, and any below-market leases? What's the average tenancy length?
- What capital expenditures (roof, boiler, parking lot, exteriors) have been made in the last 5 years, and what's planned in the next 2?
- Have any recent inspections been done? Can we get a copy of the seller's disclosures and any deferred-maintenance estimates?
- Built in 1896 — when were the roof, HVAC, electrical panel, plumbing, and water heater last replaced?
- Is there a deadline driving the sale (1031 exchange, divorce, estate, relocation)? That informs how much negotiation room exists.
- Schools are D-rated, which usually means shorter tenancies and higher turnover. Who's the typical renter profile here, and what's been the actual vacancy rate?
- Crime grade is D in this area — have there been break-ins, vandalism, or insurance claims at this property in the last 3 years? What carrier currently insures it and at what premium?
- What's the average days-on-market for RENTAL listings here right now (not sales)? A rising rental-DOM trend means longer vacancies and softer asking-rent achievability than the comps imply.
- What's the recent tenant-quality profile in this submarket — average credit score on applications, eviction rate, late-payment / NSF rate, and stable-employment percentage? A property-management company in the area should have these aggregated.
- How much new apartment / multifamily construction is in the pipeline within 1–3 miles? Heavy new supply (>2% of stock underway) typically softens rents 12–24 months out; light construction supports rent growth.
Investment metrics
- 1% rule
- 1.23% ✓
- Cap rate
- 9.71%
- Cash-on-cash
- 12.19%
- DSCR
- 1.54
- GRM
- 6.7
CMA / ARV
- ARV (on-the-fly)
- $378,972
- Comps found
- 4
Show comp detail 4 sales within ~0.75 mi
| Address | Dist | Beds/Ba | Sqft | Sold | Price | $/sf | Match |
|---|---|---|---|---|---|---|---|
| 895 Baldwin St | 0.13mi | 6/3.0 | 3,645 (-5%) | 2mo | $360,000 | $99 | 84 |
| 96 Lounsbury St | 0.19mi | 6/3.0 | 4,120 (+8%) | 10mo | $240,000 | $58 | 70 |
| 1599 S Main St | 0.58mi | 7/3.0 (+1) | 3,936 (+3%) | 12mo | $300,000 | $76 | 54 |
| 20 Stiles St | 0.66mi | 6/3.0 | 4,095 (+7%) | 8mo | $415,000 | $101 | 51 |
Match score weights: distance 35% · size 25% · config 20% · recency 20%. Top-matched comps best support the ARV.
Projected returns pro-forma
1.39% appreciation · 3.0% rent growth · sell at horizon
- IRR
- 15.0%
- Equity multiple
- 1.78×
- Total profit
- $87,757
- Equity at exit
- $144,778
- IRR
- 18.1%
- Equity multiple
- 3.28×
- Total profit
- $254,814
- Equity at exit
- $198,952
Cash invested: $111,972 (down + closing). Projections, not guarantees.
Landlord ↔ Tenant lean methodology
- Overall (STATE)
- 27 Tenant-Leaning
- State Connecticut
- 27 Tenant-Leaning · D+7
- County
- — inherits STATE
- City
- — inherits STATE
ZIP-level market 06706
- Home prices YoY
- 0.5%
- Active inventory
- 43
- Price-to-rent
- 20.2×
Monthly cashflow live
- Estimated rent
- $4,938 high interval (Pro) →
- Mortgage (P&I)
- −$2,097
- Tax est. 1.5%
- −$500 /mo · $5,998/yr
- Insurance
- −$167
- HOA
- −$0
- Vacancy / Maint / Mgmt
- −$1,037
- Net cashflow
- $1,137
Break-even live
Sensitivity live
| Price | -10% $1,414 | -5% $1,276 | +0% $1,137 | +5% $999 | +10% $861 |
|---|---|---|---|---|---|
| Rent | -10% $747 | -5% $942 | +0% $1,137 | +5% $1,332 | +10% $1,528 |
| Rate | -1.0pp $1,339 | -0.5pp $1,239 | base $1,137 | +0.5pp $1,034 | +1.0pp $928 |
3-unit breakdown (identical units grouped — click to expand)
| Units | Beds | Baths | Est. rent |
|---|---|---|---|
| 3× units | 2 | 1 | $4,938 |
| #1 | 2 | 1 | $1,646 |
| #2 | 2 | 1 | $1,646 |
| #3 | 2 | 1 | $1,646 |
| Total (3 units) | $4,938 | ||
UW: 25.0% down · 7.5% · 30yr · 1.5% tax · 5.0% vac · 8.0% maint · 8.0% mgmt
Financing live
Cash to close
- Down payment
- $99,975
- Closing costs
- $11,997
- Reserves months
- —
- Total cash needed
- —
Loan-product check · same deal, 3 products live
Conventional
25% down · 7.5% · 30yr
- Down + closing
- —
- Monthly P&I
- —
- Monthly cashflow
- —
- DSCR
- —
- Eligible?
- —
Personal DTI + credit; lowest rate.
DSCR
20% down · 8.5% · 30yr
- Down + closing
- —
- Monthly P&I
- —
- Monthly cashflow
- —
- DSCR
- —
- Eligible?
- —
No personal income docs; deal must DSCR.
Hard money
10% down · 12.0% · 12mo
- Down + closing
- —
- Monthly P&I
- —
- Monthly cashflow
- —
- DSCR
- —
- Eligible?
- —
Short-term bridge; refi at stabilization.
Rent comps 1 comps
| Address | Beds | Baths | Sqft | Rent | $/sqft | DOM | Units | Dist |
|---|---|---|---|---|---|---|---|---|
| 14 Niagara St Waterbury, CT | 6.0 | 3.0 | 3156 | $1,700 | $0.54 | 5d | 1 | 0.82mi |
Listing history 4 events
-
2026-06-07statusdays on market $399,900 Under Contract 4 DOM
-
2026-06-05days on market $399,900 Active 2 DOM
-
2026-06-03remarks 699-char remark
-
2026-06-03$399,900 Active 1 DOM
ⓘ Source: listings_history table (triggers on properties + properties_extension) + one-shot
backfill from property_details.listing_events for pre-trigger history.
Climate risk First Street
- Flood 1/10 Low FEMA zone X (unshaded) · 0% chance over 30 yrs
- Wildfire 1/10 Low
- Heat 5/10 Major 7 d/yr ≥96°F today · 16 d/yr by 30 yrs out
- Wind 6/10 Major 27% chance of damaging wind over 30 yrs
- Air quality 3/10 Moderate 2 unhealthy d/yr today · 3 by 30 yrs out
Nearby sold comps map
Loading sold comps map…
Walkable amenities ~0.75 mi
Loading nearby amenities…
Taxation est. · year 1
- Rental income
- $59,256
- − Mortgage interest
- −$22,401
- − Property taxes
- −$5,998
- − Insurance
- −$2,000
- − Repairs & maintenance
- −$4,740
- − Management
- −$4,740
- − Depreciation
- −$11,633
- Taxable income
- $7,743
- Est. tax owed @ 24.0%
- −$1,858
- After-tax cash flow
- $11,790/yr
For passive investors: Depreciation is non-cash, so a rental often shows a tax loss while cash-flowing — sheltering income. Rental losses are passive: they offset passive income freely, and up to $25,000/yr can offset ordinary (W-2) income if you actively participate and your MAGI is under $100k (phasing out to $0 by $150k); unused losses carry forward. On sale, claimed depreciation is recaptured at up to 25%, and gains may owe capital-gains tax (a 1031 exchange can defer both). Figures are a year-1 estimate at your 24.0% rate — not tax advice; consult a CPA.
Condition & rehab AI · 14 photos
The property is a three-family home with moderate repairs and maintenance needs. Painting the exterior siding and replacing the kitchen cabinets and bathroom fixtures can significantly increase its value.
Repairs flagged
- Minor Kitchen cabinets — The kitchen cabinets appear to be in good condition, with no visible damage.
- Minor Bathroom fixtures — The bathroom fixtures appear to be in good condition, with no visible damage.
- Moderate Exterior siding — The exterior siding appears to have some wear and tear, indicating a need for maintenance or repair.
- Minor Flooring — The flooring appears to be in good condition, with no visible damage.
- Minor Interior walls/paint — The interior walls and paint appear to be in good condition, with no visible damage.
- Minor HVAC system — The HVAC system appears to be in good condition, with no visible damage.
Value-add opportunities
- Both Paint the exterior siding — Painting the exterior siding can improve the curb appeal and increase the property's value.
- Resale Replace the kitchen cabinets — Replacing the kitchen cabinets can improve the kitchen's functionality and increase the property's resale value.
- Resale Replace the bathroom fixtures — Replacing the bathroom fixtures can improve the bathroom's functionality and increase the property's resale value.
Renovation cost estimate screening
| Repair item | Severity | Est. cost |
|---|---|---|
| Kitchen cabinets · The kitchen cabinets appear to be in good condition, with no visible damage. | Minor | $500–3,000 |
| Bathroom fixtures · The bathroom fixtures appear to be in good condition, with no visible damage. | Minor | $500–3,000 |
| Exterior siding · The exterior siding appears to have some wear and tear, indicating a need for maintenance or repair. | Moderate | $3,000–15,000 |
| Flooring · The flooring appears to be in good condition, with no visible damage. | Minor | $500–3,000 |
| Interior walls/paint · The interior walls and paint appear to be in good condition, with no visible damage. | Minor | $500–3,000 |
| HVAC system · The HVAC system appears to be in good condition, with no visible damage. | Minor | $500–3,000 |
| Total estimated repair cost · 6 items | $5,500–30,000 |
Value-add ROI direction
- Both Paint the exterior siding — Painting the exterior siding can improve the curb appeal and increase the property's value. ↑
- Resale Replace the kitchen cabinets — Replacing the kitchen cabinets can improve the kitchen's functionality and increase the property's resale value. ↑
- Resale Replace the bathroom fixtures — Replacing the bathroom fixtures can improve the bathroom's functionality and increase the property's resale value. ↑
ⓘ Cost ranges are severity-bucket heuristics (US national rule-of-thumb). Get contractor quotes + a written scope before underwriting a rehab budget.
Schools (NCES district)
- District
- Waterbury School District
- NCES district ID
- 0904830
- Math proficiency
- 12% ▼ -7.00%
- Reading proficiency
- 23% ▼ -8.00%
- Median HH income
- $40,040
- Composite
- 14.85/100
- National rank
- #9380
- State rank
- #148 of 153 in CT
Livability — Waterbury
- Score
- 79/100
- State rank
- #32
- US rank
- #2205
Category grades
Schools grade is shown separately in the Schools card above.
Census & demographics
- Census place
- Waterbury, CT
- County
- New Haven County · 688,236 people
- City population
- 115,012
- Metro
- New Haven-Milford, CT
- Population (ZIP)
- 15,551
- Household income
- $52,242
- Rent vs Own
- Severe rent burden
- 801.0
Population outlook (Naugatuck Valley County) Hauer SSP2
- By 2040
- 496,846
Race, ethnicity, and origin ACS 2023
- Neighborhood character
- Highly diverse neighborhood (Simpson 0.72)
- Race & ethnicity
- Hispanic / Latino 35% White 31% Black 25% Two or more races 12% Asian 3%
- Hispanic origin (detail)
- Puerto Rican 25% Dominican 4%
- Common ancestry
- Lithuanian 3% Estonian 2% Romanian 1%
- Foreign-born
- 20% · Canada, Jamaica
- Languages at home
- 60% English-only · Spanish 27% Other Indo-European 11% Other Asian/Pacific 1%
Political lean MEDSL · Naugatuck Valley
- 2024 margin
- Lean R (+7.4) · D 45.6% · R 53.0% · Other 1.4%
- All cycles
- 2024: R+7.4
Not yet ingested
- Civics
- —
Market trends
- HPI YoY
- ▲ 1.39%
- Current HPI
- 309.8467
- Rent YoY
- —
- Metro
- New Haven-Milford, CT
- State GDP YoY
- ▲ 1.06%
- F500 in state
- 38
Industry mix (Fortune 500 HQ in CT)
| Industry | F500 HQs | Revenue |
|---|---|---|
| Industrial Machinery | 4 | $38B |
|
||
| Insurance | 3 | $71B |
|
||
| Financial Services | 2 | $25B |
|
||
| Transportation / Logistics | 2 | $18B |
|
||
| Healthcare | 1 | $247B |
|
||
| Telecommunications | 1 | $55B |
|
||
Price history
1 event — show timeline
- 2026-06-02 Listed $399,900 Smart MLS
Cash-flow waterfall
monthlySold comps — $/sqft
last 12 mo · ≤1 miLoading sold comps…