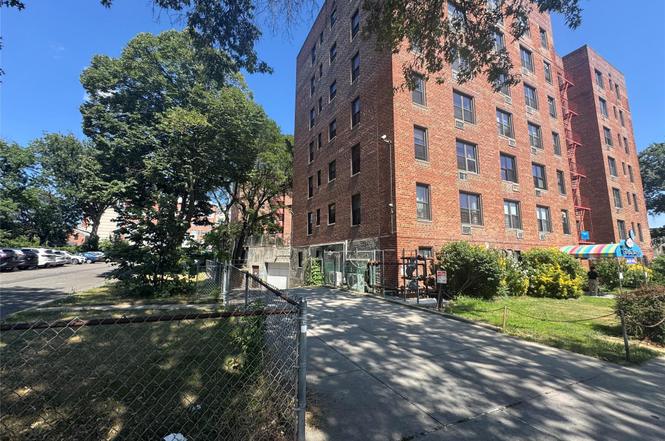
140-15 Holly Ave Unit 2M · New York, NY
Flood risk 7/10 · Major
- FEMA flood zone
- X (unshaded)
- Chance of flooding over 30 yrs
- 0.77%
- Est. flood insurance / yr
- $507 – $1,088
Fire risk 1/10 · Minimal
- Est. fire insurance / yr
- $691 – $1,283
Heat risk 6/10 · Moderate
- Hot days now (above 99°F)
- 7 days/yr
- Hot days in 30 yrs
- 15 days/yr
Wind risk 6/10 · Moderate
- Chance of severe wind over 30 yrs
- 27.0%
Air-quality risk 4/10 · Minor
- Unhealthy air days now
- 6 days/yr
- Unhealthy air days in 30 yrs
- 6 days/yr
Risk factors via First Street. Map © Google.
Why this score? — see what drove the D grade
The composite is a weighted blend of 9 inputs, each scored 0–100. Each bar is that input's sub-score; the figure is the points it added to the 100-point composite (weight × sub-score).
- Cash flow +9.3/30.0
- ARV discount +7.5/15.0
- Appreciation +5.5/10.0
- Schools +5.0/10.0
- Livability +3.8/5.0
- Rent growth +3.5/5.0
- 1% rule +2.8/10.0
- DSCR +2.6/10.0
- Condition / age +2.5/5.0
$438,000
🖨 Deal sheet (PDF) 📄 Offer letter ✓ Due diligence
Listing remarks
Prime Location! Spacious 3 Bedrooms, 2 Baths' Residence Situated In The Heart Of Flushing. Apt Is 1250 Sq Ft Interior Space. Conveniently Located Near Various Businesses, Supermarkets, Public Transportation Is Bus Stops Q27 & Q65. PS24.
Key facts
- Heart of flushing
- Near supermarkets
- Prime location
Tags
Neighborhood map
What this means for you Summary
Snapshot
- This is a 3-bed/2.0-bath condo listed at $438k.
Deal economics
- At list price, monthly cash flow is $-385 ($-5k/yr) — negative.
- To cash-flow at today's rent, offer at most $382k (12.7% below list).
- To meet the 1% rule (rent ≥ 1% of price), the offer needs to be $343k (21.7% below list).
- Recommended offer: $343k (21.7% below list) — sets the bar for 1% rule.
- Cap rate 5.4% vs local median 2.6% in New York — top-decile yield for the area; either an underpriced asset or a hidden risk that comps aren't pricing in. Stress-test before assuming the spread holds.
Location & tenants
- Location reads 75/100 on livability (#268 in NY, #4,188 nationally) — a middle-class / working-renter tenant base. Strengths: amenities A+, commute A+, health & safety A; Watch: crime F, cost of living F.
- Zoned schools: Ps 24 Andrew Jackson (math 81% / reading 66%, grade A, #371 of 2,108 statewide, top 18%, 1,111 students, 74% FRL); Is 227 Louis Armstrong (math 52% / reading 69%, grade B+, #153 of 729 statewide, top 21%, 1,528 students, 68% FRL); Francis Lewis High School (math 97% / reading 92%, grade A+, #117 of 1,100 statewide, top 11%, 4,265 students, 70% FRL).
- Market conditions: Rents rising (+3.9%/yr); 407 active listings in the ZIP; 35 comparable units currently listed for rent nearby; rentals at typical pace (median 17d on market — plan ~3-4 weeks tenant-placement turnaround); 5,302 units permitted in Queens County in 2024 (4,918 in 5+ unit buildings).
- At $3,429/mo this rent would consume 74% of the median local household income ($55k/yr) (locally 6765% of renters already pay >50% of income on rent) — very limited rent-growth headroom before tenants either downsize or default.
Forward outlook
- In year one you build about $8k of equity ($3k loan paydown + $5k appreciation (1.1% local appreciation)).
- Queens County population projected at +16% by 2050 — long-run rental-demand tailwind backs the buy-and-hold thesis.
- By year 5, paydown + projected appreciation supports a ~$36k cash-out refi (75% LTV) — recoverable capital for the next deal without selling this one.
Negotiation context
- It's been on market 87 days — a 6% lower offer ($412k) is reasonable based on typical stale-listing flexibility.
- 2 sale attempts since 2y ago with the ask held roughly flat each time — persistent listings suggest the price (not the market) is what's stuck; bring a comps-based counter.
Risks & watch-outs
- Watch-outs: flood insurance adds $66/mo.
- Climate carrying-cost: major flood risk; major wind risk, 27% chance of damaging wind over 30y; extreme-heat days projected 7→15/yr by 2055 (HVAC capex compounding) — expect insurance premiums to compound above CPI over the hold.
Questions for the listing agent
- What do current leases actually rent for vs. the listed asking? Can we see a recent rent roll and the last 12 months of T-12 income?
- It's been on market 87 days. Have you received any prior offers? Is the seller open to a 22% concession, seller financing, or rate buy-down credit?
- What's the actual annual flood-insurance premium (NFIP or private), and is the property in a SFHA with mandatory coverage?
- Any open or pending special assessments — roof, HVAC, plumbing, elevator, façade? What's the per-unit balance and payoff schedule, and is the seller paying it off at close or rolling it to the buyer?
- Why hasn't it sold? Are there any deal-killer items the seller is aware of (foundation, flood, title, zoning, code violations)?
- Is there a deadline driving the sale (1031 exchange, divorce, estate, relocation)? That informs how much negotiation room exists.
- Schools are B-rated — typically a magnet for longer-tenancy family renters. What's the average tenant stay here, and is there a school-zone premium baked into asking?
- Crime grade is F in this area — have there been break-ins, vandalism, or insurance claims at this property in the last 3 years? What carrier currently insures it and at what premium?
- The area grade is low — what's the realistic commute time and amenity access for the typical tenant pool here? Any planned neighborhood developments (good or bad) we should know about?
- What's the average days-on-market for RENTAL listings here right now (not sales)? A rising rental-DOM trend means longer vacancies and softer asking-rent achievability than the comps imply.
- What's the recent tenant-quality profile in this submarket — average credit score on applications, eviction rate, late-payment / NSF rate, and stable-employment percentage? A property-management company in the area should have these aggregated.
- How much new apartment / multifamily construction is in the pipeline within 1–3 miles? Heavy new supply (>2% of stock underway) typically softens rents 12–24 months out; light construction supports rent growth.
Investment metrics
- 1% rule
- 0.78% ✗
- Cap rate
- 5.42%
- Cash-on-cash
- -3.11%
- DSCR
- 0.86
- GRM
- 10.6
CMA / ARV
No comps found within radius.
Projected returns pro-forma
1.09% appreciation · 3.93% rent growth · sell at horizon
- IRR
- -1.8%
- Equity multiple
- 0.91×
- Total profit
- $-11,060
- Equity at exit
- $151,556
- IRR
- 3.7%
- Equity multiple
- 1.47×
- Total profit
- $57,361
- Equity at exit
- $202,983
Cash invested: $122,640 (down + closing). Projections, not guarantees.
Landlord ↔ Tenant lean methodology
- Overall (CITY)
- 0 Strongly Tenant-Friendly
- State New York
- 15 Strongly Tenant-Friendly · D+10
- County
- — inherits STATE
- City New York
- 0 Strongly Tenant-Friendly · D+34
ZIP-level market 11355
- Home prices YoY
- 0.4%
- Rents YoY
- 3.9%
- Active inventory
- 407
- Price-to-rent
- 10.6×
Monthly cashflow live
- Estimated rent
- $3,429 high interval (Pro) →
- Mortgage (P&I)
- −$2,297
- Tax est. 1.5%
- −$548 /mo · $6,570/yr
- Insurance
- −$182
- Flood insurance flood zone
- −$66 /mo · $798/yr
- HOA
- −$0
- Vacancy / Maint / Mgmt
- −$720
- Net cashflow
- $-385
Break-even live
Sensitivity live
| Price | -10% $-82 | -5% $-233 | +0% $-385 | +5% $-536 | +10% $-687 |
|---|---|---|---|---|---|
| Rent | -10% $-655 | -5% $-520 | +0% $-385 | +5% $-249 | +10% $-114 |
| Rate | -1.0pp $-164 | -0.5pp $-273 | base $-385 | +0.5pp $-498 | +1.0pp $-613 |
UW: 25.0% down · 7.5% · 30yr · 1.5% tax · 5.0% vac · 8.0% maint · 8.0% mgmt
Financing live
Cash to close
- Down payment
- $109,500
- Closing costs
- $13,140
- Reserves months
- —
- Total cash needed
- —
Loan-product check · same deal, 3 products live
Conventional
25% down · 7.5% · 30yr
- Down + closing
- —
- Monthly P&I
- —
- Monthly cashflow
- —
- DSCR
- —
- Eligible?
- —
Personal DTI + credit; lowest rate.
DSCR
20% down · 8.5% · 30yr
- Down + closing
- —
- Monthly P&I
- —
- Monthly cashflow
- —
- DSCR
- —
- Eligible?
- —
No personal income docs; deal must DSCR.
Hard money
10% down · 12.0% · 12mo
- Down + closing
- —
- Monthly P&I
- —
- Monthly cashflow
- —
- DSCR
- —
- Eligible?
- —
Short-term bridge; refi at stabilization.
Rent comps 35 comps
| Address | Beds | Baths | Sqft | Rent | $/sqft | DOM | Units | Dist |
|---|---|---|---|---|---|---|---|---|
| 4255 Colden St Unit 16P Flushing, NY | 2.0 | 1.5 | 1150 | $3,500 | $3.04 | 5d | 1 | 0.36mi |
| 142-23 Booth Memorial Ave Unit 1 Flushing, NY | 3.0 | 1.0 | 1064 | $3,200 | $3.01 | 7d | 1 | 0.40mi |
| 136-19 Franklin Ave Unit 4A Flushing, NY | 3.0 | 2.0 | 1300 | $4,300 | $3.31 | 21d | 1 | 0.50mi |
| 150-32 Booth Memorial Ave Unit 1st FL Flushing, NY | 3.0 | 2.0 | 1080 | $3,350 | $3.10 | 19d | 1 | 0.53mi |
| 4220 Kissena Blvd Unit D2 Flushing, NY | 2.0 | 1.5 | 1800 | $4,500 | $2.50 | 6d | 1 | 0.55mi |
| 15022 58th Ave Flushing, NY | 3.0 | 1.5 | 1224 | $3,300 | $2.70 | 17d | 1 | 0.56mi |
| 4140 Union St Unit 10P Flushing, NY | 3.0 | 3.0 | 1220 | $4,200 | $3.44 | 26d | 1 | 0.60mi |
| 133-38 Avery Ave Unit 3F-B Flushing, NY | 2.0 | 2.0 | 884 | $2,600 | $2.94 | 26d | 1 | 0.61mi |
| 4156 149th St Flushing, NY | 3.0 | 1.0 | 1000 | $3,000 | $3.00 | 26d | 1 | 0.68mi |
| 14731 Barclay Ave Flushing, NY | 2.0 | 1.0 | 900 | $2,500 | $2.78 | 26d | 1 | 0.71mi |
| 43-15 156th St Unit 2nd Fl Flushing, NY | 4.0 | 2.0 | 1600 | $2,995 | $1.87 | 16d | 1 | 0.72mi |
| 14803 61st Rd Flushing, NY | 3.0 | 2.0 | 1594 | $3,600 | $2.26 | 26d | 1 | 0.74mi |
| 43-12 157th St Unit 2 Flushing, NY | 3.0 | 1.5 | 1100 | $3,200 | $2.91 | 26d | 1 | 0.74mi |
| 13225 58th Ave Flushing, NY | 3.0 | 3.0 | 1300 | $3,500 | $2.69 | 6d | 1 | 0.77mi |
| 40-10 149th St Fl 3 Flushing, NY | 3.0 | 2.0 | 1030 | $2,900 | $2.82 | 14d | 1 | 0.82mi |
| 40-10 149th St Fl 1 Flushing, NY | 2.0 | 1.0 | 900 | $2,200 | $2.44 | 17d | 1 | 0.82mi |
| 13835 39th Ave Flushing, NY | 2.0 | 2.0 | 1014 | $4,350 | $4.29 | 26d | 2 | 0.84mi |
| 13835 39th Ave Flushing, NY | 2.0–3.0 | 2.0 | 1000 | $4,700 | $4.70 | 3d | 2 | 0.84mi |
| 36-20 Parsons Blvd Unit 5D Flushing, NY | 2.0 | 1.0 | 900 | $2,600 | $2.89 | 17d | 1 | 0.92mi |
| 3641 Union St Unit 2B Flushing, NY | 2.0 | 1.0 | 968 | $3,100 | $3.20 | 26d | 1 | 0.93mi |
| 4022 College Point Blvd Flushing, NY | 1.0–2.0 | 1.0–2.0 | 983 | $4,000 | $4.07 | 26d | 2 | 0.94mi |
| 4028 College Point Blvd #912 Flushing, NY | 2.0 | 2.0 | 1083 | $4,200 | $3.88 | 26d | 1 | 0.95mi |
| 13105 40th Rd Flushing, NY | 2.0 | 1.0–2.0 | 762 | $4,500 | $5.90 | 5d | 3 | 0.98mi |
| 137-02 Northern Blvd Unit 6K Flushing, NY | 2.0 | 1.0 | 900 | $2,850 | $3.17 | 13d | 1 | 1.00mi |
| 137-02 Northern Blvd Apt 5B Flushing, NY | 2.0 | 1.0 | 900 | $2,900 | $3.22 | 0d | 1 | 1.00mi |
| 14809 Northern Blvd Flushing, NY | 2.0–3.0 | 2.0 | 1056 | $4,000 | $3.79 | 16d | 2 | 1.01mi |
| 13702 Northern Blvd Flushing, NY | 1.0–2.0 | 1.0 | 850 | $2,850 | $3.35 | 9d | 2 | 1.04mi |
| 140-16 34th Ave Unit 1113 Flushing, NY | 2.0 | 1.0 | 900 | $3,000 | $3.33 | 26d | 1 | 1.13mi |
| 14016 34th Ave Unit 1210 Flushing, NY | 2.0 | 1.0 | 900 | $3,000 | $3.33 | 8d | 1 | 1.14mi |
| 140-16 34th Ave Apt 1003 Flushing, NY | 2.0 | 2.0 | 1100 | $3,300 | $3.00 | 26d | 1 | 1.14mi |
| 33-19 143rd St Flushing, NY | 3.0 | 2.0 | 1224 | $4,300 | $3.51 | 26d | 1 | 1.19mi |
| 139-31 34th Ave Unit 3rd fl Flushing, NY | 2.0 | 1.0 | 900 | $2,500 | $2.78 | 26d | 1 | 1.21mi |
| 165-23 65th Ave Unit 2 Flushing, NY | 3.0 | 1.5 | 1200 | $3,000 | $2.50 | 24d | 1 | 1.29mi |
| 175-03 Peck Ave Unit 2 Floor Flushing, NY | 3.0 | 2.0 | 1824 | $4,200 | $2.30 | 8d | 1 | 1.34mi |
| 56-40 175th Pl Unit A Fresh Meadows, NY | 4.0 | 2.0 | 1500 | $3,600 | $2.40 | 4d | 1 | 1.46mi |
HOA detail condo
- Monthly dues
- $0 · $0/yr
- Assessments
- None detected in remarks — confirm with the listing agent.
Listing history 5 events
-
2025-11-03status Pending
-
2025-08-08$438,000 Active
-
2025-04-01historical
-
2024-08-08price $478,000
-
2024-04-24$488,000 Active
ⓘ Source: listings_history table (triggers on properties + properties_extension) + one-shot
backfill from property_details.listing_events for pre-trigger history.
Climate risk First Street
- Flood 7/10 Severe FEMA zone X (unshaded) · 77% chance over 30 yrs
- Wildfire 1/10 Low
- Heat 6/10 Major 7 d/yr ≥99°F today · 15 d/yr by 30 yrs out
- Wind 6/10 Major 27% chance of damaging wind over 30 yrs
- Air quality 4/10 Moderate 6 unhealthy d/yr today · 6 by 30 yrs out
Nearby sold comps map
Loading sold comps map…
Walkable amenities ~0.75 mi
Loading nearby amenities…
Taxation est. · year 1
- Rental income
- $41,147
- − Mortgage interest
- −$24,535
- − Property taxes
- −$6,570
- − Insurance
- −$2,988
- − Repairs & maintenance
- −$3,292
- − Management
- −$3,292
- − Depreciation
- −$12,742
- Taxable loss
- −$12,270
- Est. tax savings @ 24.0%
- +$2,945
- After-tax cash flow
- $-1,669/yr
For passive investors: Depreciation is non-cash, so a rental often shows a tax loss while cash-flowing — sheltering income. Rental losses are passive: they offset passive income freely, and up to $25,000/yr can offset ordinary (W-2) income if you actively participate and your MAGI is under $100k (phasing out to $0 by $150k); unused losses carry forward. On sale, claimed depreciation is recaptured at up to 25%, and gains may owe capital-gains tax (a 1031 exchange can defer both). Figures are a year-1 estimate at your 24.0% rate — not tax advice; consult a CPA.
Schools (NCES district)
No district data.
Livability — New York
- Score
- 75/100
- State rank
- #268
- US rank
- #4188
Category grades
Schools grade is shown separately in the Schools card above.
Census & demographics
- Census place
- New York, NY
- County
- Queens County · 1,914,869 people
- City population
- 7,731,280
- Metro
- New York-Newark-Jersey City, NY-NJ-PA
- Population (ZIP)
- 80,801
- Household income
- $55,326
- Rent vs Own
- Severe rent burden
- 6765.0
Population outlook (Queens County) Hauer SSP2
- Today (2025)
- 2,546,320 people
- By 2030
- 2,643,059 · +3.8%
- By 2040
- 2,815,563 · +10.6%
- By 2050
- 2,944,423 · +15.6%
- By 2075
- 3,123,338 · +22.7%
- By 2100
- 3,098,688 · +21.7%
Race, ethnicity, and origin ACS 2023
- Neighborhood character
- Predominantly Asian (75%)
- Race & ethnicity
- Asian 75% Hispanic / Latino 14% White 7% Two or more races 4% Black 2%
- Hispanic origin (detail)
- Mexican 2% Puerto Rican 2% Dominican 2%
- Common ancestry
- Scotch-Irish 1%
- Foreign-born
- 72% · China, Canada, South Korea
- Languages at home
- 16% English-only · Chinese 58% Spanish 12% Other Indo-European 6%
Political lean MEDSL · Queens
- 2024 margin
- Strong D (+24.6) · D 62.3% · R 37.7%
- 2008→2024 swing
- -26.2pp toward R · 2008: 50.8pp · 2024: 24.6pp
- All cycles
- 2024: D+24.6 2020: D+45.2 2016: D+53.4 2012: D+58.5 2008: D+50.8
Not yet ingested
- Civics
- —
Market trends
- HPI YoY
- ▲ 1.09%
- Current HPI
- 253.1482
- Rent YoY
- ▲ 3.93%
- Metro
- New York-Newark-Jersey City, NY-NJ-PA
- State GDP YoY
- ▲ 2.60%
- F500 in state
- 92
Industry mix (Fortune 500 HQ in NY)
| Industry | F500 HQs | Revenue |
|---|---|---|
| Financial Services | 10 | $950B |
|
||
| Consumer Goods | 9 | $162B |
|
||
| Insurance | 4 | $225B |
|
||
| Telecommunications | 2 | $144B |
|
||
| Pharmaceuticals | 2 | $112B |
|
||
| Media / Entertainment | 2 | $69B |
|
||
Price history
-10.2% since first listed5 events — show timeline
- 2025-11-03 Pending — OneKey® MLS as Distributed by MLS Grid
- 2025-08-08 Listed $438,000 OneKey® MLS as Distributed by MLS Grid
- 2025-04-01 Listing Removed — OneKey® MLS as Distributed by MLS Grid
- 2024-08-08 Price Changed $478,000 OneKey® MLS as Distributed by MLS Grid
- 2024-04-24 Listed $488,000 OneKey® MLS as Distributed by MLS Grid
Cash-flow waterfall
monthlySold comps — $/sqft
last 12 mo · ≤1 miLoading sold comps…