134 Sycamore Cir · Warsaw, KY
Flood risk No data
- FEMA flood zone
- —
- Chance of flooding over 30 yrs
- —
- Est. flood insurance / yr
- —
Fire risk No data
- Est. fire insurance / yr
- —
Heat risk No data
- Hot days now (above threshold)
- —
- Hot days in 30 yrs
- —
Wind risk No data
- Chance of severe wind over 30 yrs
- —
Air-quality risk No data
- Unhealthy air days now
- —
- Unhealthy air days in 30 yrs
- —
Risk factors via First Street. Map © Google.
Why this score? — see what drove the D+ grade
The composite is a weighted blend of 9 inputs, each scored 0–100. Each bar is that input's sub-score; the figure is the points it added to the 100-point composite (weight × sub-score).
- Cash flow +9.4/30.0
- Appreciation +9.2/10.0
- 1% rule +8.5/10.0
- ARV discount +7.5/15.0
- Livability +3.1/5.0
- DSCR +2.6/10.0
- Rent growth +2.5/5.0
- Condition / age +2.5/5.0
- Schools +2.2/10.0
$89,995
🖨 Deal sheet 📄 Offer letter ✓ Due diligence
Listing remarks
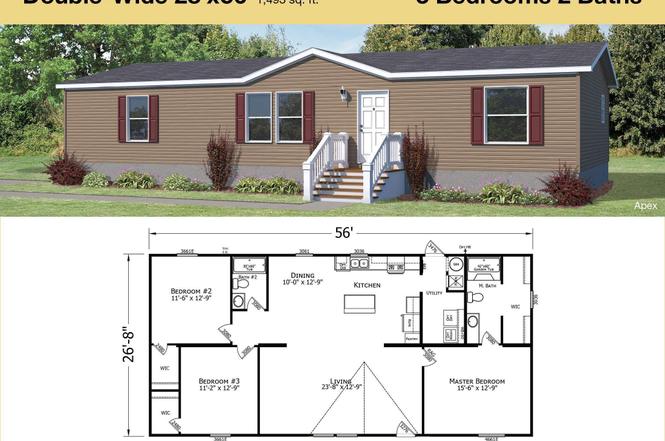
Spacious 3-Bedroom Home in Asbury Pointe Settle into comfort at Asbury Pointe, a quiet suburban community in Warsaw, KY, located just behind Gallatin County High School. This 2026 Champion/Prime Apex offers a roomy double width design and all the benefits of new construction in a peaceful, convenient setting. Home Highlights 3 Bedrooms, 2 Bathrooms - versatile layout for families or guests 28' x 56' double width home - open floor plan with large living and dining spaces 2026 construction - brand-new, stylish, and move-in ready Offered at $89,995 - excellent value for a new home in Northern Kentucky Community Features Prime Location - just off Rt. 42 and Dorman Drive, 30 minutes from
Key facts
- Open floor plan
- Top schools
- Adjacent county park
Tags
Property features AI
Finance
- Financial info: List price $89,995
- HOA & community: Association fee approximately $400
Exterior
- Home design: Single-family specification home (Apex plan); Active listing
- Exterior features: Address: 134 Sycamore Cir, Warsaw KY 41095
Interior
- Bedrooms: 3 bedrooms
- Bathrooms: 2 full bathrooms
- Interior features: Spec home (Apex plan, Asbury Pointe)
Neighborhood map
What this means for you Summary
Snapshot
- This is a 3-bed/2.0-bath manufactured listed at $90k.
Deal economics
- At list price, monthly cash flow is $-64 ($-769/yr) — negative.
- To cash-flow at today's rent, offer at most $81k (10.3% below list).
- Meets the 1% rule at list price ($1k rent vs $90k).
- Recommended offer: $79k (12.0% below list) — sets the bar for market timing.
Location & tenants
- Location reads 61/100 on livability (#376 in KY) — a middle-class / working-renter tenant base. Strengths: cost of living A+, housing A+, crime B+; Watch: employment D+, schools D, amenities F.
- Gallatin County (rural): math 20% / reading 31% proficiency, ranked #137 of 165 in KY (top 83%) — low school quality limits family demand, transient renter base, plan for 1-2y turnover; 62% free/reduced lunch — lower-income household profile, screen leases tightly.
- Market conditions: 46 active listings in the ZIP; 56 units permitted in Gallatin County in 2024 (0 in 5+ unit buildings).
Forward outlook
- In year one you build about $8k of equity ($622 loan paydown + $8k appreciation (8.4% local appreciation)).
- Gallatin County population projected to shrink 6% by 2050 — rents likely to lag national; underwrite the cash flow, not the appreciation.
- At projected returns (8.4% appreciation + 3.0% rent growth), your $25k cash investment doubles in ~4 years — after that, you're playing with house money.
- By year 5, paydown + projected appreciation supports a ~$37k cash-out refi (75% LTV) — recoverable capital for the next deal without selling this one.
Negotiation context
- It's been on market 235 days — a 12% lower offer ($79k) is reasonable based on typical stale-listing flexibility.
Risks & watch-outs
- Watch-outs: HOA is 33% of rent.
Questions for the listing agent
- What do current leases actually rent for vs. the listed asking? Can we see a recent rent roll and the last 12 months of T-12 income?
- It's been on market 235 days. Have you received any prior offers? Is the seller open to a 12% concession, seller financing, or rate buy-down credit?
- What does the HOA fee cover, when was the last increase, and are there any pending special assessments or reserve-fund shortfalls?
- Why hasn't it sold? Are there any deal-killer items the seller is aware of (foundation, flood, title, zoning, code violations)?
- Is there a deadline driving the sale (1031 exchange, divorce, estate, relocation)? That informs how much negotiation room exists.
- Schools are D-rated, which usually means shorter tenancies and higher turnover. Who's the typical renter profile here, and what's been the actual vacancy rate?
- The area grade is low — what's the realistic commute time and amenity access for the typical tenant pool here? Any planned neighborhood developments (good or bad) we should know about?
- What's the average days-on-market for RENTAL listings here right now (not sales)? A rising rental-DOM trend means longer vacancies and softer asking-rent achievability than the comps imply.
- What's the recent tenant-quality profile in this submarket — average credit score on applications, eviction rate, late-payment / NSF rate, and stable-employment percentage? A property-management company in the area should have these aggregated.
- How much new for-sale + rental construction is in the pipeline within 1–3 miles? Heavy new supply typically softens prices + rents 12–24 months out; constrained supply supports both.
Investment metrics
- 1% rule
- 1.35% ✓
- Cap rate
- 5.44%
- Cash-on-cash
- -3.05%
- DSCR
- 0.86
- GRM
- 6.2
CMA / ARV
No comps found within radius.
Projected returns pro-forma
8.37% appreciation · 3.0% rent growth · sell at horizon
- IRR
- 18.7%
- Equity multiple
- 2.41×
- Total profit
- $35,414
- Equity at exit
- $70,669
- IRR
- 17.6%
- Equity multiple
- 5.22×
- Total profit
- $106,454
- Equity at exit
- $142,526
Cash invested: $25,199 (down + closing). Projections, not guarantees.
Landlord ↔ Tenant lean methodology
- Overall (STATE)
- 83 Strongly Landlord-Friendly
- State Kentucky
- 83 Strongly Landlord-Friendly · R+16
- County
- — inherits STATE
- City
- — inherits STATE
ZIP-level market 41095
- Home prices YoY
- 2.9%
- Active inventory
- 46
- Price-to-rent
- 6.2×
Monthly cashflow live
- Estimated rent
- $1,212 medium interval (Pro) →
- Mortgage (P&I)
- −$472
- Tax est. 1.5%
- −$112 /mo · $1,350/yr
- Insurance
- −$37
- HOA
- −$400
- Vacancy / Maint / Mgmt
- −$255
- Net cashflow
- $-64
Break-even live
UW: 25.0% down · 7.5% · 30yr · 1.5% tax · 5.0% vac · 8.0% maint · 8.0% mgmt
Financing live
Cash to close
- Down payment
- $22,499
- Closing costs
- $2,700
- Reserves months
- —
- Total cash needed
- —
Loan-product check · same deal, 3 products live
Conventional
25% down · 7.5% · 30yr
- Down + closing
- —
- Monthly P&I
- —
- Monthly cashflow
- —
- DSCR
- —
- Eligible?
- —
Personal DTI + credit; lowest rate.
DSCR
20% down · 8.5% · 30yr
- Down + closing
- —
- Monthly P&I
- —
- Monthly cashflow
- —
- DSCR
- —
- Eligible?
- —
No personal income docs; deal must DSCR.
Hard money
10% down · 12.0% · 12mo
- Down + closing
- —
- Monthly P&I
- —
- Monthly cashflow
- —
- DSCR
- —
- Eligible?
- —
Short-term bridge; refi at stabilization.
HOA detail
- Monthly dues
- $400 · $4,800/yr
Listing history 15 events
-
2026-06-18days on market $89,995 Active 235 DOM
-
2026-06-17days on market $89,995 Active 234 DOM
-
2026-06-16days on market $89,995 Active 233 DOM
-
2026-06-15days on market $89,995 Active 232 DOM
-
2026-06-13days on market $89,995 Active 230 DOM
-
2026-06-12days on market $89,995 Active 229 DOM
-
2026-06-09days on market $89,995 Active 226 DOM
-
2026-06-08days on market $89,995 Active 225 DOM
-
2026-06-07days on market $89,995 Active 224 DOM
-
2026-06-07days on market $89,995 Active 223 DOM
-
2026-06-04days on market $89,995 Active 220 DOM
-
2026-06-02days on market $89,995 Active 219 DOM
-
2026-06-01days on market $89,995 Active 218 DOM
-
2026-05-31days on market $89,995 Active 217 DOM
-
2026-05-31days on market $89,995 Active 216 DOM
ⓘ Source: listings_history table (triggers on properties + properties_extension) + one-shot
backfill from property_details.listing_events for pre-trigger history.
Nearby sold comps map
Loading sold comps map…
Walkable amenities ~0.75 mi
Loading nearby amenities…
Taxation est. · year 1
- Rental income
- $14,550
- − Mortgage interest
- −$5,041
- − Property taxes
- −$1,350
- − Insurance
- −$450
- − Repairs & maintenance
- −$1,164
- − Management
- −$1,164
- − HOA
- −$4,800
- − Depreciation
- −$2,618
- Taxable loss
- −$2,037
- Est. tax savings @ 24.0%
- +$489
- After-tax cash flow
- $-280/yr
For passive investors: Depreciation is non-cash, so a rental often shows a tax loss while cash-flowing — sheltering income. Rental losses are passive: they offset passive income freely, and up to $25,000/yr can offset ordinary (W-2) income if you actively participate and your MAGI is under $100k (phasing out to $0 by $150k); unused losses carry forward. On sale, claimed depreciation is recaptured at up to 25%, and gains may owe capital-gains tax (a 1031 exchange can defer both). Figures are a year-1 estimate at your 24.0% rate — not tax advice; consult a CPA.
Schools (NCES district)
- District
- Gallatin County
- NCES district ID
- 2102130
- Math proficiency
- 20% ▼ -15.00%
- Reading proficiency
- 31% ▼ -16.00%
- Median HH income
- $46,041
- Composite
- 22.05/100
- National rank
- #8195
- State rank
- #137 of 165 in KY
Livability — Warsaw
- Score
- 61/100
- State rank
- #376
- US rank
- #17814
Category grades
Schools grade is shown separately in the Schools card above.
Census & demographics
- Population (ZIP)
- 3,775
Population outlook (Gallatin County) Hauer SSP2
- Today (2025)
- 8,658 people
- By 2030
- 8,616 · -0.5%
- By 2040
- 8,410 · -2.9%
- By 2050
- 8,140 · -6.0%
- By 2075
- 7,308 · -15.6%
- By 2100
- 6,671 · -22.9%
Race, ethnicity, and origin ACS 2023
- Neighborhood character
- Predominantly White (82%)
- Race & ethnicity
- White 82% Hispanic / Latino 7% Black 6% Two or more races 5% Asian 1%
- Hispanic origin (detail)
- Mexican 7%
- Common ancestry
- Slovak 1% Italian 1% Scottish 1%
- Foreign-born
- 4% · Canada
- Languages at home
- 93% English-only · Spanish 6% French/Haitian/Cajun 0%
Political lean MEDSL · Gallatin
- 2024 margin
- Solid R (+59.9) · D 19.4% · R 79.4% · Other 1.2%
- 2008→2024 swing
- -42.3pp toward R · 2008: -17.6pp · 2024: -59.9pp
- All cycles
- 2024: R+59.9 2020: R+55.4 2016: R+50.8 2012: R+17.0 2008: R+17.6
Not yet ingested
- Civics
- —
Market trends
- HPI YoY
- ▲ 8.37%
- Current HPI
- 293.2896
- Rent YoY
- —
- Metro
- —
- State GDP YoY
- ▲ 1.81%
- F500 in state
- 4
Industry mix (Fortune 500 HQ in KY)
| Industry | F500 HQs | Revenue |
|---|---|---|
| Healthcare | 1 | $118B |
|
||
| Food / Beverage | 1 | $7B |
|
||
Cash-flow waterfall
monthlySold comps — $/sqft
last 12 mo · ≤1 miLoading sold comps…