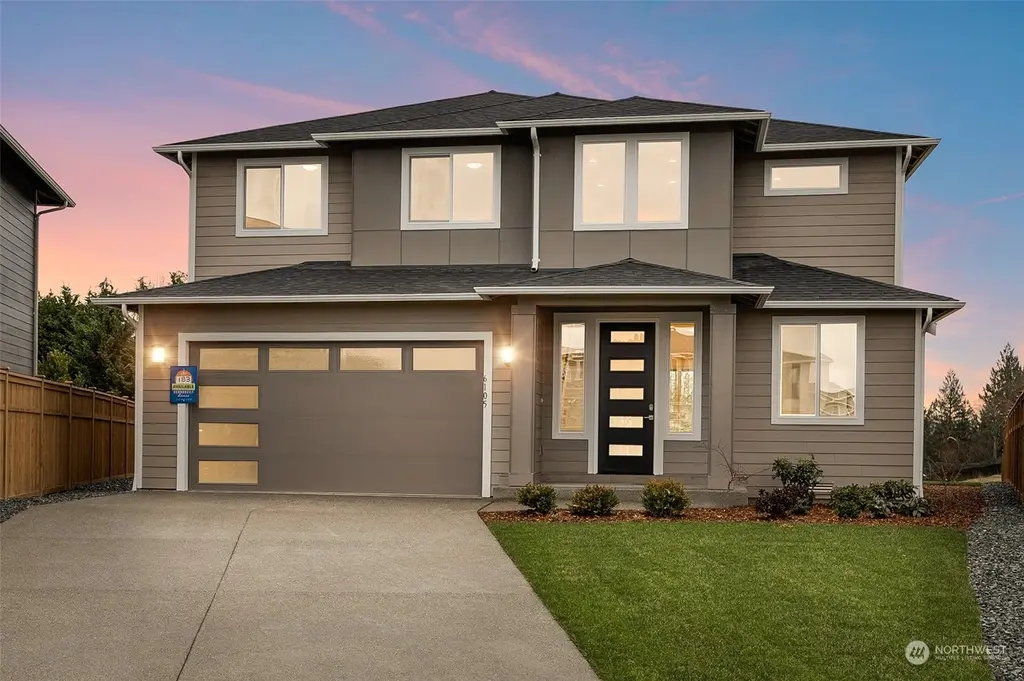
6106 232nd Ave E · Lake Tapps, WA
Flood risk 1/10 · Minimal
- FEMA flood zone
- X (unshaded)
- Chance of flooding over 30 yrs
- 0.0%
- Est. flood insurance / yr
- $507 – $1,088
Fire risk 3/10 · Minor
- Est. fire insurance / yr
- $604 – $1,122
Heat risk 2/10 · Minimal
- Hot days now (above 88°F)
- 7 days/yr
- Hot days in 30 yrs
- 15 days/yr
Wind risk 1/10 · Minimal
- Chance of severe wind over 30 yrs
- —
Air-quality risk 6/10 · Moderate
- Unhealthy air days now
- 10 days/yr
- Unhealthy air days in 30 yrs
- 12 days/yr
Risk factors via First Street. Map © Google.
Why this score? — see what drove the D- grade
The composite is a weighted blend of 9 inputs, each scored 0–100. Each bar is that input's sub-score; the figure is the points it added to the 100-point composite (weight × sub-score).
- ARV discount +12.3/15.0
- Cash flow +8.6/30.0
- Schools +5.7/10.0
- Livability +3.4/5.0
- Rent growth +2.5/5.0
- Condition / age +2.5/5.0
- DSCR +2.4/10.0
- 1% rule +2.2/10.0
- Appreciation +0.0/10.0
$844,000
🖨 Deal sheet (PDF) 📄 Offer letter ✓ Due diligence
Listing remarks
This better-than-new home in Elk Run at Chinook Meadows, offers upgrades in both cosmetics and quality that you just dont get when buying new. Built in 2024, this like-new 2,822 SF layout includes a main floor jr. suite for guests or MIL, with a total of 5 bedrooms, 3.25 baths, and a 3-car attached garage on an oversized lot with plenty of driveway parking. Where back yard space is hard to find, this one delivers. The main floor bedroom with its own 3/4 bath, creates flexible space for guests, multi-generational living, or a home office setup. The great room centers around an upgraded electric fireplace with a custom shiplap surround, while large sliding doors open to the covered patio and
Key facts
- Main floor jr suite
- Covered patio
- 9,296 sq ft lot
Tags
Property features AI
Finance
- Other: Listing located in the Elk Run at Chinook Meadows community
- Financial info: Financing accepted: Cash, Conventional, FHA, VA
- HOA & community: HOA with annual fee of $628 covering common area maintenance; Association contact: Tiffany at EMB Management; Community features include CCRs and park
Exterior
- Parking: Attached garage (has garage) with covered spaces; 3 covered spaces; 4 uncovered parking spaces; Driveway; Garage approximately 612 square feet
- Security: Fully fenced
- Utilities: Public water; Sewer connected; Electric and natural gas energy sources; Power by PSE; Water service by Tacoma Public Utility; Sewer service by City of Bonney Lake; Cable connected (Xfinity/Verizon)
- Home design: Single-family residence, two stories; Built on lot; effective year built 2024; Main-level entry; Has view; Very good condition
- Construction: Cement plank and wood construction; Composition roof; Poured concrete foundation; Effective year built 2024
- Exterior features: Cement plank and wood exterior; Cement planked siding; Garden space; Patio; Fenced yard (fully fenced); Irrigation and sprinkler system; Electric car charging available; Cable TV and high-speed internet available; Gas available; Cul-de-sac lot with curbs, paved streets and sidewalks; Drought-resistant landscaping
Interior
- Kitchen: Dishwasher; Garbage disposal; Microwave; Refrigerator; Stove/Range
- Bedrooms: 5 bedrooms total — 4 upstairs, 1 on main level
- Flooring: Ceramic tile; Laminate; Vinyl plank; Carpet
- Bathrooms: 2 full bathrooms; 1 three-quarter bathroom; 1 half bathroom; 2 bathtubs; 3 showers; 2 main-level bathrooms
- Heating & cooling: High-efficiency heating (90%+), forced air and heat pump; High-efficiency cooling, central air, forced air and heat pump
- Interior features: Dining room; Fireplace (electric and gas); French doors; High-tech cabling; Loft; Pantry; Walk-in closets; Water heater
- Laundry & utility: Washer; Dryer; Water heater located in garage (tank)
Neighborhood map
What this means for you Summary
Snapshot
- This is a 4-bed/3.0-bath single-family listed at $844k.
Deal economics
- At list price, monthly cash flow is $-718 ($-9k/yr) — negative.
- To cash-flow at today's rent, offer at most $717k (15.0% below list).
- To meet the 1% rule (rent ≥ 1% of price), the offer needs to be $610k (27.7% below list).
- Recommended offer: $610k (27.7% below list) — sets the bar for 1% rule.
- Cap rate 5.3% vs local median 2.7% in Lake Tapps — top-decile yield for the area; either an underpriced asset or a hidden risk that comps aren't pricing in. Stress-test before assuming the spread holds.
Location & tenants
- Location reads 68/100 on livability (#289 in WA) — a middle-class / working-renter tenant base. Strengths: crime A+, employment A+, housing A+; Watch: amenities F, commute F, cost of living F.
- White River School District (suburban): math 57% / reading 68% proficiency, ranked #35 of 291 in WA (top 12%) — acceptable for families but not a draw, mixed tenant base, ~2y average lease.
- Zoned schools: Mountain Meadow Elementary (416 students, 22% FRL); Glacier Middle School (970 students, 35% FRL); White River High School (1,263 students, 32% FRL) — zoned schools at 30% FRL track the district average.
- Market conditions: 240 active listings in the ZIP; 1 comparable units currently listed for rent nearby; 3,209 units permitted in Pierce County in 2024 (1,269 in 5+ unit buildings).
Forward outlook
- Local home prices are declining (-3.0%/yr); year-one equity from $6k of loan paydown is wiped out by about $25k of value loss. Plan a longer hold.
- Pierce County population projected at +26% by 2050 — long-run rental-demand tailwind backs the buy-and-hold thesis.
Negotiation context
- Only 2 days on market — expect competitive offers; lowballing is unlikely to land.
- 2 sale attempts since 2y ago with the ask held roughly flat each time — persistent listings suggest the price (not the market) is what's stuck; bring a comps-based counter.
Questions for the listing agent
- What do current leases actually rent for vs. the listed asking? Can we see a recent rent roll and the last 12 months of T-12 income?
- What does the HOA fee cover, when was the last increase, and are there any pending special assessments or reserve-fund shortfalls?
- Is there a deadline driving the sale (1031 exchange, divorce, estate, relocation)? That informs how much negotiation room exists.
- Schools are A-rated — typically a magnet for longer-tenancy family renters. What's the average tenant stay here, and is there a school-zone premium baked into asking?
- The area grade is low — what's the realistic commute time and amenity access for the typical tenant pool here? Any planned neighborhood developments (good or bad) we should know about?
- What's the average days-on-market for RENTAL listings here right now (not sales)? A rising rental-DOM trend means longer vacancies and softer asking-rent achievability than the comps imply.
- What's the recent tenant-quality profile in this submarket — average credit score on applications, eviction rate, late-payment / NSF rate, and stable-employment percentage? A property-management company in the area should have these aggregated.
- How much new for-sale + rental construction is in the pipeline within 1–3 miles? Heavy new supply typically softens prices + rents 12–24 months out; constrained supply supports both.
Investment metrics
- 1% rule
- 0.72% ✗
- Cap rate
- 5.27%
- Cash-on-cash
- -3.65%
- DSCR
- 0.84
- GRM
- 11.5
CMA / ARV
- ARV (median comp)
- $945,247
- List price
- $844,000
- Delta
- -8.49%
- Verdict
- FAIR
- Comps
- 20 within 1.0 mi
Show comp detail 12 sales within ~0.75 mi
| Address | Dist | Beds/Ba | Sqft | Sold | Price | $/sf | Match |
|---|---|---|---|---|---|---|---|
| 23106 62nd St E | 0.09mi | 5/3.5 (+1) | 2,988 (+6%) | 1mo | $944,175 | $316 | 78 |
| 6202 229th Ave E #305 | 0.12mi | 4/2.5 | 3,086 (+9%) | 2mo | $899,000 | $291 | 75 |
| 6208 229th Ave E #306 | 0.12mi | 4/3.0 | 2,992 (+6%) | 13mo | $907,075 | $303 | 74 |
| 6109 232nd Ave E | 0.04mi | 4/2.5 | 3,086 (+9%) | 8mo | $899,000 | $291 | 74 |
| 22801 61st St E #293 | 0.21mi | 5/3.0 (+1) | 2,983 (+6%) | 2mo | $930,000 | $312 | 73 |
| 23142 65th St E | 0.28mi | 4/2.5 | 2,752 (-2%) | 10mo | $829,000 | $301 | 73 |
| 6217 229th Ave E #241 | 0.12mi | 4/3.5 | 2,603 (-8%) | 14mo | $849,950 | $327 | 68 |
| 23211 57th St E | 0.29mi | 4/2.5 | 3,033 (+8%) | 9mo | $957,395 | $316 | 64 |
| 22809 61st St E #291 | 0.21mi | 5/3.0 (+1) | 3,019 (+7%) | 13mo | $1,003,750 | $332 | 63 |
| 6602 232nd Ave E | 0.34mi | 5/2.5 (+1) | 3,093 (+10%) | 5mo | $799,000 | $258 | 57 |
| 6903 232nd Ave E | 0.54mi | 5/2.5 (+1) | 3,169 (+12%) | 12mo | $1,020,000 | $322 | 37 |
| 23215 54th St E | 0.55mi | 3/4.5 (-1) | 3,105 (+10%) | 13mo | $1,210,000 | $390 | 36 |
Match score weights: distance 35% · size 25% · config 20% · recency 20%. Top-matched comps best support the ARV.
Projected returns pro-forma
-3.0% appreciation · 3.0% rent growth · sell at horizon
- IRR
- -22.4%
- Equity multiple
- 0.23×
- Total profit
- $-182,602
- Equity at exit
- $125,843
- IRR
- -16.6%
- Equity multiple
- 0.08×
- Total profit
- $-218,278
- Equity at exit
- $72,974
Cash invested: $236,320 (down + closing). Projections, not guarantees.
Landlord ↔ Tenant lean methodology
- Overall (STATE)
- 28 Tenant-Leaning
- State Washington
- 28 Tenant-Leaning · D+8
- County
- — inherits STATE
- City
- — inherits STATE
ZIP-level market 98321
- Active inventory
- 240
- Price-to-rent
- 11.5×
Monthly cashflow live
- Estimated rent
- $6,100 medium interval (Pro) →
- Mortgage (P&I)
- −$4,426
- Tax from tax record
- −$708 /mo · $8,491/yr
- Insurance
- −$352
- HOA
- −$52
- Lot rent
- −$0
- Vacancy / Maint / Mgmt
- −$1,281
- Net cashflow
- $-718
Break-even live
Sensitivity live
| Price | -10% $-241 | -5% $-479 | +0% $-718 | +5% $-957 | +10% $-1,196 |
|---|---|---|---|---|---|
| Rent | -10% $-1,200 | -5% $-959 | +0% $-718 | +5% $-477 | +10% $-236 |
| Rate | -1.0pp $-293 | -0.5pp $-504 | base $-718 | +0.5pp $-937 | +1.0pp $-1,159 |
UW: 25.0% down · 7.5% · 30yr · 1.5% tax · 5.0% vac · 8.0% maint · 8.0% mgmt
Financing live
Cash to close
- Down payment
- $211,000
- Closing costs
- $25,320
- Reserves months
- —
- Total cash needed
- —
Loan-product check · same deal, 3 products live
Conventional
25% down · 7.5% · 30yr
- Down + closing
- —
- Monthly P&I
- —
- Monthly cashflow
- —
- DSCR
- —
- Eligible?
- —
Personal DTI + credit; lowest rate.
DSCR
20% down · 8.5% · 30yr
- Down + closing
- —
- Monthly P&I
- —
- Monthly cashflow
- —
- DSCR
- —
- Eligible?
- —
No personal income docs; deal must DSCR.
Hard money
10% down · 12.0% · 12mo
- Down + closing
- —
- Monthly P&I
- —
- Monthly cashflow
- —
- DSCR
- —
- Eligible?
- —
Short-term bridge; refi at stabilization.
Rent comps 1 comps
| Address | Beds | Baths | Sqft | Rent | $/sqft | DOM | Units | Dist |
|---|---|---|---|---|---|---|---|---|
| 23056 64th Street Ct E Unit 1 Buckley, WA | 5.0 | 3.5 | 3358 | $6,100 | $1.82 | 46d | 1 | 0.22mi |
HOA detail
- Monthly dues
- $52 · $624/yr
- Likely covers
- electric
Listing history 6 events
-
2025-02-14soldstatus $896,890 Closed
-
2025-01-02status Pending
-
2024-09-20price $896,890
-
2024-04-27price $921,890
-
2024-04-19price $924,640
-
2024-03-23$919,640 Active
ⓘ Source: listings_history table (triggers on properties + properties_extension) + one-shot
backfill from property_details.listing_events for pre-trigger history.
Tax reassessment forecast WA · Resets to sale price
- Current annual tax
- $8,491 · $708/mo
- Projected year-2 tax
- $8,491 · $708/mo
- Expected delta
- $0/yr ($0/mo · 0.0%)
ⓘ Screening estimate from a state-policy table — verify with the county assessor before closing.
Climate risk First Street
- Flood 1/10 Low FEMA zone X (unshaded) · 0% chance over 30 yrs
- Wildfire 3/10 Moderate
- Heat 2/10 Low 7 d/yr ≥88°F today · 15 d/yr by 30 yrs out
- Wind 1/10 Low
- Air quality 6/10 Major 10 unhealthy d/yr today · 12 by 30 yrs out
Nearby sold comps map
Loading sold comps map…
Walkable amenities ~0.75 mi
Loading nearby amenities…
Taxation est. · year 1
- Rental income
- $73,200
- − Mortgage interest
- −$47,277
- − Property taxes
- −$8,491
- − Insurance
- −$4,220
- − Repairs & maintenance
- −$5,856
- − Management
- −$5,856
- − HOA
- −$624
- − Depreciation
- −$24,553
- Taxable loss
- −$23,677
- Est. tax savings @ 24.0%
- +$5,682
- After-tax cash flow
- $-2,937/yr
For passive investors: Depreciation is non-cash, so a rental often shows a tax loss while cash-flowing — sheltering income. Rental losses are passive: they offset passive income freely, and up to $25,000/yr can offset ordinary (W-2) income if you actively participate and your MAGI is under $100k (phasing out to $0 by $150k); unused losses carry forward. On sale, claimed depreciation is recaptured at up to 25%, and gains may owe capital-gains tax (a 1031 exchange can defer both). Figures are a year-1 estimate at your 24.0% rate — not tax advice; consult a CPA.
Schools (NCES district)
- District
- White River School District
- NCES district ID
- 5309780
- Math proficiency
- 57% ▲ 3.00%
- Reading proficiency
- 68% ▲ 6.00%
- Median HH income
- $71,369
- Composite
- 56.68/100
- National rank
- #2423
- State rank
- #35 of 291 in WA
Livability — Lake Tapps
- Score
- 68/100
- State rank
- #289
- US rank
- #10068
Category grades
Schools grade is shown separately in the Schools card above.
Census & demographics
- Population (ZIP)
- 17,601
Population outlook (Pierce County) Hauer SSP2
- Today (2025)
- 956,648 people
- By 2030
- 1,010,862 · +5.7%
- By 2040
- 1,113,170 · +16.4%
- By 2050
- 1,206,524 · +26.1%
- By 2075
- 1,436,425 · +50.2%
- By 2100
- 1,563,654 · +63.5%
Race, ethnicity, and origin ACS 2023
- Neighborhood character
- Predominantly White (87%)
- Race & ethnicity
- White 87% Hispanic / Latino 6% Two or more races 5% Native American 2% Asian 1%
- Hispanic origin (detail)
- Mexican 3% Puerto Rican 2%
- Common ancestry
- Portuguese 7% Italian 4% Lithuanian 3%
- Foreign-born
- 2% · China, Canada
- Languages at home
- 97% English-only · Spanish 1% Other Asian/Pacific 1%
Political lean MEDSL · Pierce
- 2024 margin
- D (+10.8) · D 53.9% · R 43.1% · Other 3.0%
- 2008→2024 swing
- -1.4pp toward R · 2008: 12.2pp · 2024: 10.8pp
- All cycles
- 2024: D+10.8 2020: D+11.2 2016: D+7.5 2012: D+11.0 2008: D+12.2
Not yet ingested
- Civics
- —
Market trends
- HPI YoY
- ▼ -206.67%
- Current HPI
- 310.6568
- Rent YoY
- —
- Metro
- —
- State GDP YoY
- ▲ 4.65%
- F500 in state
- 22
Industry mix (Fortune 500 HQ in WA)
| Industry | F500 HQs | Revenue |
|---|---|---|
| Retail | 2 | $269B |
|
||
| Technology / Retail | 1 | $638B |
|
||
| Technology | 1 | $245B |
|
||
| Telecommunications | 1 | $38B |
|
||
| Food / Beverage | 1 | $36B |
|
||
| Automotive / Trucks | 1 | $34B |
|
||
Price history
-8.2% since first listed8 events — show timeline
- 2026-05-29 Pending — NWMLS as Distributed by MLS Grid
- 2026-05-27 Listed $844,000 NWMLS as Distributed by MLS Grid
- 2025-02-14 Sold (MLS) $896,890 NWMLS as Distributed by MLS Grid
- 2025-01-02 Pending — NWMLS as Distributed by MLS Grid
- 2024-09-20 Price Changed $896,890 NWMLS as Distributed by MLS Grid
- 2024-04-27 Price Changed $921,890 NWMLS as Distributed by MLS Grid
- 2024-04-19 Price Changed $924,640 NWMLS as Distributed by MLS Grid
- 2024-03-23 Listed $919,640 NWMLS as Distributed by MLS Grid
Property tax history
+52.9%/yrLatest (2026): $8,491 · -1.0% YoY. Source: county tax records.
Cash-flow waterfall
monthlySold comps — $/sqft
last 12 mo · ≤1 miLoading sold comps…