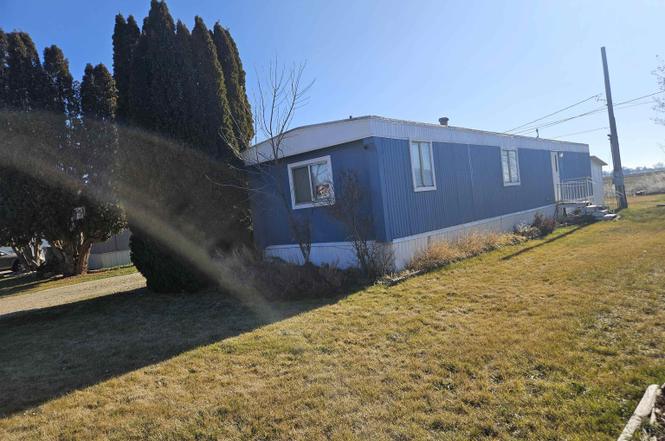
3104 E Ustick Rd · Caldwell, ID
Flood risk 1/10 · Minimal
- FEMA flood zone
- X (unshaded)
- Chance of flooding over 30 yrs
- 0.0%
- Est. flood insurance / yr
- $507 – $1,088
Fire risk 1/10 · Minimal
- Est. fire insurance / yr
- $584 – $1,086
Heat risk 5/10 · Moderate
- Hot days now (above 98°F)
- 7 days/yr
- Hot days in 30 yrs
- 18 days/yr
Wind risk 1/10 · Minimal
- Chance of severe wind over 30 yrs
- —
Air-quality risk 7/10 · Major
- Unhealthy air days now
- 9 days/yr
- Unhealthy air days in 30 yrs
- 16 days/yr
Risk factors via First Street. Map © Google.
Why this score? — see what drove the B grade
The composite is a weighted blend of 9 inputs, each scored 0–100. Each bar is that input's sub-score; the figure is the points it added to the 100-point composite (weight × sub-score).
- Cash flow +30.0/30.0
- 1% rule +10.0/10.0
- DSCR +10.0/10.0
- ARV discount +7.5/15.0
- Schools +3.8/10.0
- Livability +3.4/5.0
- Rent growth +3.2/5.0
- Condition / age +2.5/5.0
- Appreciation +0.0/10.0
$57,500
🖨 Deal sheet 📄 Offer letter ✓ Due diligence
Listing remarks
Singlewide, 2 beds. I Bath. On left side of Ustick. Close to Caldwell Bulevard and easy to get to Nampa or Caldwell as well to freeway. easy to get to shopping centers.
Key facts
- Garage
- Built 1983
- Listed 145 days
Property features AI
Finance
- Other: No other financial amenities provided
- Financial info: No additional financial details provided
- HOA & community: Association fee charged annually
Exterior
- Parking: Detached parking; Carport
- Security: No security features provided
- Utilities: City water service; Holding tank sewer
- Home design: Mobile/manufactured home on a rented lot
- Construction: Built in 1983; Metal roof
- Exterior features: Manual sprinkler system; Property currently used as 2–4 units
Interior
- Kitchen: No kitchen appliance details provided
- Bedrooms: 2 bedrooms (both on the main level; second bedroom approx. 12 x 12)
- Flooring: Vinyl flooring
- Bathrooms: 1 bathroom
- Heating & cooling: Forced-air heating (natural gas); Central air conditioning
- Interior features: Breakfast bar
- Laundry & utility: Electric water heater
Neighborhood map
What this means for you Summary
Snapshot
- This is a 2-bed/1.0-bath manufactured listed at $58k.
Deal economics
- At list price, monthly cash flow is $855 ($10k/yr) — positive.
- The deal already cash-flows at list — no discount required.
- Meets the 1% rule at list price ($2k rent vs $58k).
- Recommended offer: $51k (12.0% below list) — sets the bar for market timing.
- Cap rate 24.1% vs local median 3.1% in Caldwell — top-decile yield for the area; either an underpriced asset or a hidden risk that comps aren't pricing in. Stress-test before assuming the spread holds.
Location & tenants
- Location reads 67/100 on livability (#88 in ID) — a middle-class / working-renter tenant base. Strengths: cost of living A+, housing A+; Watch: crime C-, employment D+, amenities F.
- Vallivue School District (rural): math 34% / reading 56% proficiency, ranked #48 of 92 in ID (top 52%) — families likely to look elsewhere, expect single-tenant / working-renter base with shorter leases.
- Zoned schools: East Canyon Elementary School (math 34% / reading 44%, grade F, #247 of 357 statewide, top 70%, 692 students, 33% FRL); Vallivue Academy (math 24% / reading 75%, grade D+, #40 of 169 statewide, top 26%, 122 students, 77% FRL) — zoned schools at 55% FRL track the district average.
- Market conditions: Rents rising (+2.7%/yr); 341 active listings in the ZIP; 16 comparable units currently listed for rent nearby; rentals leasing fast (median 12d on market — plan ~1-2 weeks tenant-placement turnaround); 3,620 units permitted in Canyon County in 2024 (196 in 5+ unit buildings).
Forward outlook
- Local home prices are declining (-3.0%/yr); year-one equity from $398 of loan paydown is wiped out by about $2k of value loss. Plan a longer hold.
- Canyon County population projected at +41% by 2050 — long-run rental-demand tailwind backs the buy-and-hold thesis.
- At projected returns (-3.0% appreciation + 2.7% rent growth), your $16k cash investment doubles in ~2 years — after that, you're playing with house money.
Negotiation context
- It's been on market 145 days — a 12% lower offer ($51k) is reasonable based on typical stale-listing flexibility.
Risks & watch-outs
- Climate carrying-cost: extreme-heat days projected 7→18/yr by 2055 (HVAC capex compounding) — expect insurance premiums to compound above CPI over the hold.
Questions for the listing agent
- It's been on market 145 days. Have you received any prior offers? Is the seller open to a 12% concession, seller financing, or rate buy-down credit?
- Why hasn't it sold? Are there any deal-killer items the seller is aware of (foundation, flood, title, zoning, code violations)?
- Is there a deadline driving the sale (1031 exchange, divorce, estate, relocation)? That informs how much negotiation room exists.
- Schools are D-rated, which usually means shorter tenancies and higher turnover. Who's the typical renter profile here, and what's been the actual vacancy rate?
- What's the average days-on-market for RENTAL listings here right now (not sales)? A rising rental-DOM trend means longer vacancies and softer asking-rent achievability than the comps imply.
- What's the recent tenant-quality profile in this submarket — average credit score on applications, eviction rate, late-payment / NSF rate, and stable-employment percentage? A property-management company in the area should have these aggregated.
- How much new for-sale + rental construction is in the pipeline within 1–3 miles? Heavy new supply typically softens prices + rents 12–24 months out; constrained supply supports both.
Investment metrics
- 1% rule
- 2.76% ✓
- Cap rate
- 24.14%
- Cash-on-cash
- 63.73%
- DSCR
- 3.84
- GRM
- 3.0
CMA / ARV
No comps found within radius.
Projected returns pro-forma
-3.0% appreciation · 2.69% rent growth · sell at horizon
- IRR
- 62.4%
- Equity multiple
- 3.77×
- Total profit
- $44,675
- Equity at exit
- $8,573
- IRR
- 66.9%
- Equity multiple
- 7.65×
- Total profit
- $107,118
- Equity at exit
- $4,972
Cash invested: $16,100 (down + closing). Projections, not guarantees.
Landlord ↔ Tenant lean methodology
- Overall (STATE)
- 91 Strongly Landlord-Friendly
- State Idaho
- 91 Strongly Landlord-Friendly · R+18
- County
- — inherits STATE
- City
- — inherits STATE
ZIP-level market 83605
- Home prices YoY
- -27.0%
- Rents YoY
- 2.7%
- Active inventory
- 341
- Price-to-rent
- 3.0×
Monthly cashflow live
- Estimated rent
- $1,585 high interval (Pro) →
- Mortgage (P&I)
- −$302
- Tax est. 1.5%
- −$72 /mo · $862/yr
- Insurance
- −$24
- HOA
- −$0
- Vacancy / Maint / Mgmt
- −$333
- Net cashflow
- $855
Break-even live
UW: 25.0% down · 7.5% · 30yr · 1.5% tax · 5.0% vac · 8.0% maint · 8.0% mgmt
Financing live
Cash to close
- Down payment
- $14,375
- Closing costs
- $1,725
- Reserves months
- —
- Total cash needed
- —
Loan-product check · same deal, 3 products live
Conventional
25% down · 7.5% · 30yr
- Down + closing
- —
- Monthly P&I
- —
- Monthly cashflow
- —
- DSCR
- —
- Eligible?
- —
Personal DTI + credit; lowest rate.
DSCR
20% down · 8.5% · 30yr
- Down + closing
- —
- Monthly P&I
- —
- Monthly cashflow
- —
- DSCR
- —
- Eligible?
- —
No personal income docs; deal must DSCR.
Hard money
10% down · 12.0% · 12mo
- Down + closing
- —
- Monthly P&I
- —
- Monthly cashflow
- —
- DSCR
- —
- Eligible?
- —
Short-term bridge; refi at stabilization.
Rent comps 16 comps
| Address | Beds | Baths | Sqft | Rent | $/sqft | DOM | Units | Dist |
|---|---|---|---|---|---|---|---|---|
| 3304 S Florida Ave Caldwell, ID | 3.0 | 1.0 | 1000 | $1,395 | $1.40 | 23d | 1 | 0.50mi |
| 5012 Hamlet Ln Caldwell, ID | 1.0–2.0 | 1.0–1.5 | 998 | $1,550 | $1.55 | 2d | 2 | 0.63mi |
| 3919 Thatcher Ln Caldwell, ID | 1.0–3.0 | 1.0–2.0 | 1074 | $1,645 | $1.53 | 2d | 41 | 0.73mi |
| 4113 Saylor Ln Unit A Caldwell, ID | 1.0 | 1.0 | 706 | $1,550 | $2.20 | 11d | 1 | 0.79mi |
| 4209 Saylor Ln Caldwell, ID | 2.0 | 2.0 | 1040 | $1,925 | $1.85 | 21d | 1 | 0.84mi |
| 2106 Ison Ct Unit 1460907P Caldwell, ID | 2.0 | 2.0 | 957 | $3,066 | $3.20 | 11d | 1 | 0.84mi |
| 1513 Indian Springs St Unit N302 Caldwell, ID | 2.0 | 2.0 | 1023 | $1,550 | $1.52 | 2d | 1 | 1.00mi |
| 2012 Cambridge St Caldwell, ID | 3.0 | 2.0 | 996 | $2,050 | $2.06 | 2d | 1 | 1.09mi |
| 3114 Iowa Ave Unit 1 Caldwell, ID | 3.0 | 1.0 | 1020 | $1,500 | $1.47 | 14d | 1 | 1.13mi |
| 2003 E Linden St Unit 2 Caldwell, ID | 2.0 | 1.0 | 930 | $1,250 | $1.34 | 14d | 1 | 1.21mi |
| 2509 S Ohio Ave Caldwell, ID | 1.0 | 1.0 | 550 | $850 | $1.55 | 14d | 1 | 1.22mi |
| 4901 Maid Jessica St Caldwell, ID | 2.0 | 1.5 | 900 | $1,450 | $1.61 | 14d | 1 | 1.24mi |
| 4005 Washington Ave Caldwell, ID | 2.0 | 1.5 | 900 | $1,535 | $1.71 | 21d | 1 | 1.24mi |
| 2100 E Maple St Caldwell, ID | 1.0–3.0 | 1.0–1.5 | 930 | $1,150 | $1.24 | 2d | 1 | 1.25mi |
| 3905 Idaho Ave Caldwell, ID | 2.0 | 1.5 | 650 | $1,350 | $2.08 | 2d | 1 | 1.29mi |
| 2609 Red Robin Way Caldwell, ID | 3.0 | 2.0 | 936 | $1,650 | $1.76 | 11d | 1 | 1.36mi |
Listing history 16 events
-
2026-06-18days on market $57,500 Active 145 DOM
-
2026-06-17days on market $57,500 Active 144 DOM
-
2026-06-16days on market $57,500 Active 143 DOM
-
2026-06-15days on market $57,500 Active 142 DOM
-
2026-06-13days on market $57,500 Active 140 DOM
-
2026-06-13days on market $57,500 Active 139 DOM
-
2026-06-10days on market $57,500 Active 137 DOM
-
2026-06-09days on market $57,500 Active 136 DOM
-
2026-06-08days on market $57,500 Active 135 DOM
-
2026-06-07days on market $57,500 Active 134 DOM
-
2026-06-03days on market $57,500 Active 130 DOM
-
2026-06-03days on market $57,500 Active 129 DOM
-
2026-06-01days on market $57,500 Active 128 DOM
-
2026-05-31days on market $57,500 Active 127 DOM
-
2026-02-24price $57,500
-
2026-01-24$62,500 Active
ⓘ Source: listings_history table (triggers on properties + properties_extension) + one-shot
backfill from property_details.listing_events for pre-trigger history.
Climate risk First Street
- Flood 1/10 Low FEMA zone X (unshaded) · 0% chance over 30 yrs
- Wildfire 1/10 Low
- Heat 5/10 Major 7 d/yr ≥98°F today · 18 d/yr by 30 yrs out
- Wind 1/10 Low
- Air quality 7/10 Severe 9 unhealthy d/yr today · 16 by 30 yrs out
Nearby sold comps map
Loading sold comps map…
Walkable amenities ~0.75 mi
Loading nearby amenities…
Taxation est. · year 1
- Rental income
- $19,025
- − Mortgage interest
- −$3,221
- − Property taxes
- −$862
- − Insurance
- −$288
- − Repairs & maintenance
- −$1,522
- − Management
- −$1,522
- − Depreciation
- −$1,673
- Taxable income
- $9,937
- Est. tax owed @ 24.0%
- −$2,385
- After-tax cash flow
- $7,876/yr
For passive investors: Depreciation is non-cash, so a rental often shows a tax loss while cash-flowing — sheltering income. Rental losses are passive: they offset passive income freely, and up to $25,000/yr can offset ordinary (W-2) income if you actively participate and your MAGI is under $100k (phasing out to $0 by $150k); unused losses carry forward. On sale, claimed depreciation is recaptured at up to 25%, and gains may owe capital-gains tax (a 1031 exchange can defer both). Figures are a year-1 estimate at your 24.0% rate — not tax advice; consult a CPA.
Schools (NCES district)
- District
- Vallivue School District
- NCES district ID
- 1600600
- Math proficiency
- 34% ▼ -9.00%
- Reading proficiency
- 56% ▼ -1.00%
- Median HH income
- $47,377
- Composite
- 38.3/100
- National rank
- #4229
- State rank
- #48 of 92 in ID
Livability — Caldwell
- Score
- 67/100
- State rank
- #88
- US rank
- #10145
Category grades
Schools grade is shown separately in the Schools card above.
Census & demographics
- County
- Canyon County · 235,358 people
- City population
- 76,816
- Metro
- Boise City, ID
- Population (ZIP)
- 41,325
- Household income
- $68,427
- Rent vs Own
- Severe rent burden
- 719.0
Population outlook (Canyon County) Hauer SSP2
- Today (2025)
- 248,853 people
- By 2030
- 269,596 · +8.3%
- By 2040
- 311,081 · +25.0%
- By 2050
- 350,809 · +41.0%
- By 2075
- 441,884 · +77.6%
- By 2100
- 505,641 · +103.2%
Race, ethnicity, and origin ACS 2023
- Neighborhood character
- Diverse neighborhood (Simpson 0.56)
- Race & ethnicity
- White 51% Hispanic / Latino 42% Two or more races 15% Native American 1%
- Hispanic origin (detail)
- Mexican 36%
- Common ancestry
- Lithuanian 3% Slovak 2% Italian 2%
- Foreign-born
- 13% · Canada
- Languages at home
- 71% English-only · Spanish 27% Russian/Polish/Slavic 1%
Political lean MEDSL · Canyon
- 2024 margin
- Solid R (+46.6) · D 25.4% · R 72.0% · Other 2.5%
- 2008→2024 swing
- -11.4pp toward R · 2008: -35.2pp · 2024: -46.6pp
- All cycles
- 2024: R+46.6 2020: R+39.7 2016: R+41.8 2012: R+37.1 2008: R+35.2
Not yet ingested
- Civics
- —
Market trends
- HPI YoY
- ▼ -135.47%
- Current HPI
- 366.7896
- Rent YoY
- ▲ 2.69%
- Metro
- Boise City, ID
- State GDP YoY
- ▲ 4.51%
- F500 in state
- 6
Industry mix (Fortune 500 HQ in ID)
| Industry | F500 HQs | Revenue |
|---|---|---|
| Retail | 1 | $79B |
|
||
| Technology | 1 | $25B |
|
||
| Food / Agriculture | 1 | $6B |
|
||
Price history
-8.0% since first listed2 events — show timeline
- 2026-02-24 Price Changed $57,500 IMLS
- 2026-01-24 Listed $62,500 IMLS
Property tax history
+8.2%/yrLatest (2025): $98 · +143.6% YoY. Source: county tax records.
Cash-flow waterfall
monthlySold comps — $/sqft
last 12 mo · ≤1 miLoading sold comps…