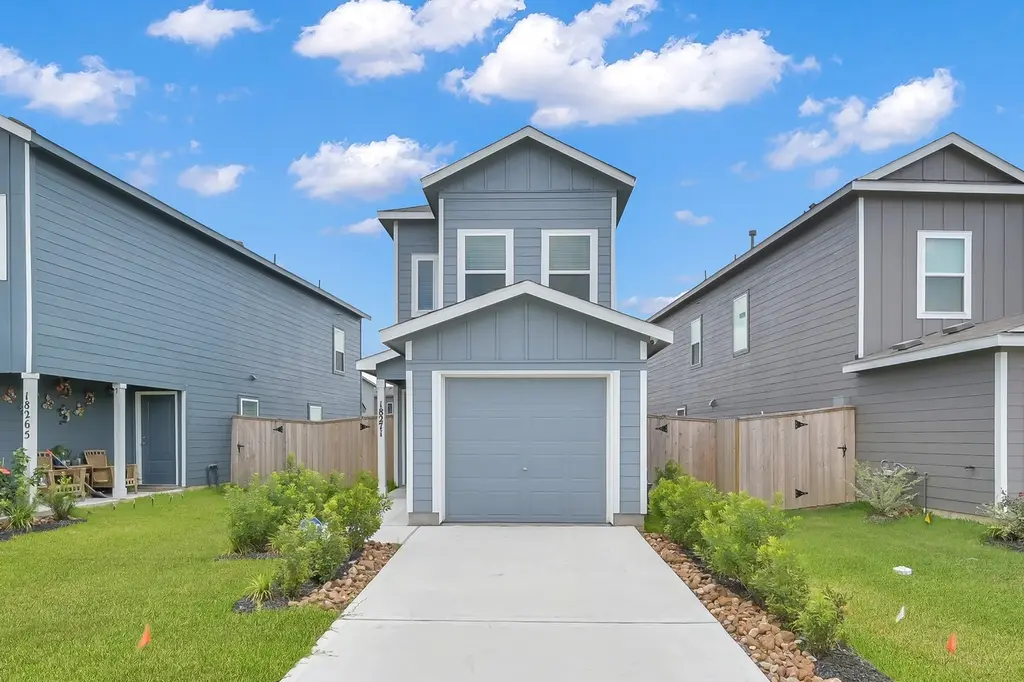
18271 Via Aurelia Dr · Woodbranch, TX
Flood risk No data
- FEMA flood zone
- —
- Chance of flooding over 30 yrs
- —
- Est. flood insurance / yr
- —
Fire risk No data
- Est. fire insurance / yr
- —
Heat risk No data
- Hot days now (above threshold)
- —
- Hot days in 30 yrs
- —
Wind risk No data
- Chance of severe wind over 30 yrs
- —
Air-quality risk No data
- Unhealthy air days now
- —
- Unhealthy air days in 30 yrs
- —
Risk factors via First Street. Map © Google.
Why this score? — see what drove the D grade
The composite is a weighted blend of 9 inputs, each scored 0–100. Each bar is that input's sub-score; the figure is the points it added to the 100-point composite (weight × sub-score).
- ARV discount +13.7/15.0
- Cash flow +7.4/30.0
- 1% rule +5.0/10.0
- Condition / age +4.8/5.0
- Livability +3.3/5.0
- Schools +2.8/10.0
- Rent growth +2.6/5.0
- DSCR +1.6/10.0
- Appreciation +0.0/10.0
$175,000
🖨 Deal sheet 📄 Offer letter ✓ Due diligence
Listing remarks MLS
NEW! Lennar Homes Wellton Collection, ''Kofa'' Plan with Elevation ''D" in Beautiful Tavola West! In this terrific new home, an open concept living area is in the back of the first floor with a modern kitchen and family room. Upstairs, a room is situated at the front of the home, perfect for a secondary bedroom or home office. The owner’s suite is tucked into the back with a full bathroom and walk-in closet.
Key facts
- Private owner suite
- Flex space
- Walk-in closet
Tags
Property features AI
Finance
- Other: Pool available through association
- HOA & community: Homeowners association (Inframark); Annual association fee ($900); Community amenities: playground, community pool
Exterior
- Parking: Attached garage (1 car)
- Security: Prewired for security
- Utilities: Public water; Public sewer
- Home design: Residential property; Built in 2024; Slab foundation; Composition roof
- Construction: Cement siding
- Exterior features: Fenced backyard; Subdivision lot setting; Association pool
Interior
- Kitchen: Dishwasher; Gas cooktop; Gas oven; Gas range; Microwave; Disposal; Refrigerator; Breakfast bar; Pantry; ENERGY STAR qualified appliances
- Bedrooms: Primary bedroom on second level (approx. 14 x 10); Bedroom on second level (approx. 10 x 9)
- Flooring: Carpet; Vinyl
- Bathrooms: 2 full bathrooms; 1 half bathroom
- Heating & cooling: Central heating (gas); Central air conditioning (electric); Attic fan; Programmable thermostat
- Interior features: Breakfast bar; Granite counters; Kitchen/family room combo; Pantry; Programmable thermostat; Ventilation (improved indoor air quality)
- Laundry & utility: Washer hookup; Electric dryer hookup; Washer; Dryer
Neighborhood map
What this means for you Summary
Snapshot
- This is a 2-bed/2.5-bath single-family listed at $175k. Condition is rated excellent.
Deal economics
- At list price, monthly cash flow is $-222 ($-3k/yr) — negative.
- To cash-flow at today's rent, offer at most $136k (22.4% below list).
- Meets the 1% rule at list price ($2k rent vs $175k).
- Recommended offer: $136k (22.4% below list) — sets the bar for cash-flow.
Location & tenants
- Location reads 66/100 on livability (#646 in TX) — a middle-class / working-renter tenant base. Strengths: crime A+, cost of living A+, housing A+; Watch: amenities F, commute F, health & safety F.
- New Caney ISD (suburban): math 31% / reading 32% proficiency, ranked #570 of 826 in TX (top 69%) — families likely to look elsewhere, expect single-tenant / working-renter base with shorter leases.
- Zoned schools: New Caney El (math 25% / reading 25%, grade F, #3,013 of 4,322 statewide, top 70%, 642 students, 89% FRL); Keefer Crossing Middle (math 35% / reading 31%, grade F, #930 of 1,662 statewide, top 57%, 1,213 students, 81% FRL); New Caney H S (math 24% / reading 31%, grade F, #1,183 of 1,632 statewide, top 73%, 2,428 students, 78% FRL) — zoned schools average 83% FRL vs 57% district-wide (26 pts higher); higher-poverty schools than district average — tighter screening recommended.
- Market conditions: Rents flat; 979 active listings in the ZIP; 4 comparable units currently listed for rent nearby; rentals at typical pace (median 25d on market — plan ~3-4 weeks tenant-placement turnaround); solid renter incomes; 13,259 units permitted in Montgomery County in 2024 (1,402 in 5+ unit buildings).
Forward outlook
- Local home prices are declining (-3.0%/yr); year-one equity from $1k of loan paydown is wiped out by about $5k of value loss. Plan a longer hold.
- Montgomery County population projected at +65% by 2050 — long-run rental-demand tailwind backs the buy-and-hold thesis.
Negotiation context
- It's been on market 37 days — a 3% lower offer ($170k) is reasonable based on typical stale-listing flexibility.
- 5 sale attempts since 2y ago with the ask held roughly flat each time — persistent listings suggest the price (not the market) is what's stuck; bring a comps-based counter.
Risks & watch-outs
- Watch-outs: property tax is 3.7% of price.
Questions for the listing agent
- What do current leases actually rent for vs. the listed asking? Can we see a recent rent roll and the last 12 months of T-12 income?
- It's been on market 37 days. Have you received any prior offers? Is the seller open to a 22% concession, seller financing, or rate buy-down credit?
- Property tax is high relative to price — has the assessment been appealed recently, and will the sale trigger a re-assessment?
- What does the HOA fee cover, when was the last increase, and are there any pending special assessments or reserve-fund shortfalls?
- Is there a deadline driving the sale (1031 exchange, divorce, estate, relocation)? That informs how much negotiation room exists.
- Schools are F-rated, which usually means shorter tenancies and higher turnover. Who's the typical renter profile here, and what's been the actual vacancy rate?
- The area grade is low — what's the realistic commute time and amenity access for the typical tenant pool here? Any planned neighborhood developments (good or bad) we should know about?
- What's the average days-on-market for RENTAL listings here right now (not sales)? A rising rental-DOM trend means longer vacancies and softer asking-rent achievability than the comps imply.
- What's the recent tenant-quality profile in this submarket — average credit score on applications, eviction rate, late-payment / NSF rate, and stable-employment percentage? A property-management company in the area should have these aggregated.
- How much new for-sale + rental construction is in the pipeline within 1–3 miles? Heavy new supply typically softens prices + rents 12–24 months out; constrained supply supports both.
Investment metrics
- 1% rule
- 1.00% ✓
- Cap rate
- 4.77%
- Cash-on-cash
- -5.43%
- DSCR
- 0.76
- GRM
- 8.3
CMA / ARV
- ARV (median comp)
- $202,812
- List price
- $175,000
- Delta
- -13.71%
- Verdict
- UNDERPRICED
- Comps
- 20 within 1.0 mi
Show comp detail 12 sales within ~0.75 mi
| Address | Dist | Beds/Ba | Sqft | Sold | Price | $/sf | Match |
|---|---|---|---|---|---|---|---|
| 18328 Buscemi Dr | 0.14mi | 3/2.0 (+1) | 1,084 (-1%) | 14mo | $232,990 | $215 | 74 |
| 18319 Palazzo Romano Ln | 0.06mi | 2/2.5 | 1,013 (-7%) | 15mo | $204,990 | $202 | 73 |
| 18433 Dicarlo Dr | 0.10mi | 2/2.5 | 1,013 (-7%) | 14mo | $201,990 | $199 | 72 |
| 18414 Dicarlo Dr | 0.09mi | 2/2.5 | 1,013 (-7%) | 15mo | $201,990 | $199 | 71 |
| 21483 Montecagnano Ave | 0.19mi | 3/2.0 (+1) | 1,084 (-1%) | 15mo | $236,990 | $219 | 70 |
| 21459 Montecagnano Ave | 0.24mi | 3/2.0 (+1) | 1,084 (-1%) | 15mo | $232,990 | $215 | 68 |
| 21443 Montecagnano Ave | 0.27mi | 3/2.0 (+1) | 1,084 (-1%) | 14mo | $234,990 | $217 | 68 |
| 18318 Palazzo Romano Ln | 0.05mi | 3/2.5 (+1) | 1,189 (+9%) | 16mo | $214,990 | $181 | 65 |
| 18687 San Salvo Dr | 0.21mi | 3/2.5 (+1) | 1,189 (+9%) | 7mo | $199,990 | $168 | 64 |
| 18425 Dicarlo Dr | 0.11mi | 3/2.5 (+1) | 1,189 (+9%) | 15mo | $211,990 | $178 | 63 |
| 18413 Dicarlo Dr | 0.11mi | 3/2.5 (+1) | 1,189 (+9%) | 15mo | $211,990 | $178 | 63 |
| 18722 Clearwater Brook Dr | 0.75mi | 3/2.0 (+1) | 1,188 (+9%) | 3mo | $204,500 | $172 | 40 |
Match score weights: distance 35% · size 25% · config 20% · recency 20%. Top-matched comps best support the ARV.
Projected returns pro-forma
-3.0% appreciation · 0.21% rent growth · sell at horizon
- IRR
- -29.8%
- Equity multiple
- 0.04×
- Total profit
- $-47,009
- Equity at exit
- $26,093
- IRR
- -57.7%
- Equity multiple
- -0.56×
- Total profit
- $-76,646
- Equity at exit
- $15,131
Cash invested: $49,000 (down + closing). Projections, not guarantees.
Landlord ↔ Tenant lean methodology
- Overall (STATE)
- 87 Strongly Landlord-Friendly
- State Texas
- 87 Strongly Landlord-Friendly · R+5
- County
- — inherits STATE
- City
- — inherits STATE
ZIP-level market 77357
- Home prices YoY
- -24.7%
- Rents YoY
- 0.2%
- Active inventory
- 979
- Price-to-rent
- 8.3×
Monthly cashflow live
- Estimated rent
- $1,758 medium interval (Pro) →
- Mortgage (P&I)
- −$918
- Tax from tax record
- −$545 /mo · $6,542/yr
- Insurance
- −$73
- HOA
- −$75
- Vacancy / Maint / Mgmt
- −$369
- Net cashflow
- $-222
Break-even live
UW: 25.0% down · 7.5% · 30yr · 1.5% tax · 5.0% vac · 8.0% maint · 8.0% mgmt
Financing live
Cash to close
- Down payment
- $43,750
- Closing costs
- $5,250
- Reserves months
- —
- Total cash needed
- —
Loan-product check · same deal, 3 products live
Conventional
25% down · 7.5% · 30yr
- Down + closing
- —
- Monthly P&I
- —
- Monthly cashflow
- —
- DSCR
- —
- Eligible?
- —
Personal DTI + credit; lowest rate.
DSCR
20% down · 8.5% · 30yr
- Down + closing
- —
- Monthly P&I
- —
- Monthly cashflow
- —
- DSCR
- —
- Eligible?
- —
No personal income docs; deal must DSCR.
Hard money
10% down · 12.0% · 12mo
- Down + closing
- —
- Monthly P&I
- —
- Monthly cashflow
- —
- DSCR
- —
- Eligible?
- —
Short-term bridge; refi at stabilization.
Rent comps 4 comps
| Address | Beds | Baths | Sqft | Rent | $/sqft | DOM | Units | Dist |
|---|---|---|---|---|---|---|---|---|
| 18243 Via Aurelia Dr New Caney, TX | 3.0 | 2.5 | 1477 | $1,725 | $1.17 | 4d | 1 | 0.04mi |
| 18242 Via Aurelia Dr New Caney, TX | 3.0 | 2.0 | 1117 | $1,750 | $1.57 | 5d | 1 | 0.04mi |
| 22048 Newton Dr New Caney, TX | 3.0 | 2.0 | 924 | $1,650 | $1.79 | 24d | 1 | 1.24mi |
| 21504 Mexican John Rd New Caney, TX | 3.0 | 2.0 | 1216 | $1,500 | $1.23 | 44d | 1 | 1.42mi |
HOA detail
- Monthly dues
- $75 · $900/yr
Listing history 28 events
-
2026-06-18days on market $175,000 Active 37 DOM
-
2026-06-17days on market $175,000 Active 36 DOM
-
2026-06-16days on market $175,000 Active 35 DOM
-
2026-06-15days on market $175,000 Active 34 DOM
-
2026-06-13days on market $175,000 Active 32 DOM
-
2026-06-09days on market $175,000 Active 28 DOM
-
2026-06-08days on market $175,000 Active 27 DOM
-
2026-06-07days on market $175,000 Active 26 DOM
-
2026-06-04days on market $175,000 Active 23 DOM
-
2026-06-03days on market $175,000 Active 22 DOM
-
2026-06-02days on market $175,000 Active 21 DOM
-
2026-06-01days on market $175,000 Active 20 DOM
-
2026-05-31days on market $175,000 Active 19 DOM
-
2026-05-12$175,000 Active 950-char remark
-
2025-09-06historical $1,600
-
2025-09-05historical
-
2025-07-08$1,600
-
2025-07-01historical $1,600
-
2025-07-01$1,600
-
2025-06-24price $190,000
-
2025-05-23$195,000 Active
-
2025-05-20historical
-
2024-12-30soldstatus Sold
Show marketing remark (423 chars)
NEW! Lennar Homes Wellton Collection, ''Kofa'' Plan with Elevation ''D" in Beautiful Tavola West! In this terrific new home, an open concept living area is in the back of the first floor with a modern kitchen and family room. Upstairs, a room is situated at the front of the home, perfect for a secondary bedroom or home office. The owner’s suite is tucked into the back with a full bathroom and walk-in closet.
-
2024-12-11status Pending
Show marketing remark (423 chars)
NEW! Lennar Homes Wellton Collection, ''Kofa'' Plan with Elevation ''D" in Beautiful Tavola West! In this terrific new home, an open concept living area is in the back of the first floor with a modern kitchen and family room. Upstairs, a room is situated at the front of the home, perfect for a secondary bedroom or home office. The owner’s suite is tucked into the back with a full bathroom and walk-in closet.
-
2024-12-11price $201,990
Show marketing remark (423 chars)
NEW! Lennar Homes Wellton Collection, ''Kofa'' Plan with Elevation ''D" in Beautiful Tavola West! In this terrific new home, an open concept living area is in the back of the first floor with a modern kitchen and family room. Upstairs, a room is situated at the front of the home, perfect for a secondary bedroom or home office. The owner’s suite is tucked into the back with a full bathroom and walk-in closet.
-
2024-11-27price $180,000
Show marketing remark (423 chars)
NEW! Lennar Homes Wellton Collection, ''Kofa'' Plan with Elevation ''D" in Beautiful Tavola West! In this terrific new home, an open concept living area is in the back of the first floor with a modern kitchen and family room. Upstairs, a room is situated at the front of the home, perfect for a secondary bedroom or home office. The owner’s suite is tucked into the back with a full bathroom and walk-in closet.
-
2024-11-27price $201,990
Show marketing remark (423 chars)
NEW! Lennar Homes Wellton Collection, ''Kofa'' Plan with Elevation ''D" in Beautiful Tavola West! In this terrific new home, an open concept living area is in the back of the first floor with a modern kitchen and family room. Upstairs, a room is situated at the front of the home, perfect for a secondary bedroom or home office. The owner’s suite is tucked into the back with a full bathroom and walk-in closet.
-
2024-11-22$180,000 Active
Show marketing remark (423 chars)
NEW! Lennar Homes Wellton Collection, ''Kofa'' Plan with Elevation ''D" in Beautiful Tavola West! In this terrific new home, an open concept living area is in the back of the first floor with a modern kitchen and family room. Upstairs, a room is situated at the front of the home, perfect for a secondary bedroom or home office. The owner’s suite is tucked into the back with a full bathroom and walk-in closet.
ⓘ Source: listings_history table (triggers on properties + properties_extension) + one-shot
backfill from property_details.listing_events for pre-trigger history.
Tax reassessment forecast TX · Resets to sale price
- Current annual tax
- $6,542 · $545/mo
- Projected year-2 tax
- $6,542 · $545/mo
- Expected delta
- $0/yr ($0/mo · 0.0%)
ⓘ Screening estimate from a state-policy table — verify with the county assessor before closing.
Nearby sold comps map
Loading sold comps map…
Walkable amenities ~0.75 mi
Loading nearby amenities…
Taxation est. · year 1
- Rental income
- $21,100
- − Mortgage interest
- −$9,803
- − Property taxes
- −$6,542
- − Insurance
- −$875
- − Repairs & maintenance
- −$1,688
- − Management
- −$1,688
- − HOA
- −$900
- − Depreciation
- −$5,091
- Taxable loss
- −$5,487
- Est. tax savings @ 24.0%
- +$1,317
- After-tax cash flow
- $-1,344/yr
For passive investors: Depreciation is non-cash, so a rental often shows a tax loss while cash-flowing — sheltering income. Rental losses are passive: they offset passive income freely, and up to $25,000/yr can offset ordinary (W-2) income if you actively participate and your MAGI is under $100k (phasing out to $0 by $150k); unused losses carry forward. On sale, claimed depreciation is recaptured at up to 25%, and gains may owe capital-gains tax (a 1031 exchange can defer both). Figures are a year-1 estimate at your 24.0% rate — not tax advice; consult a CPA.
Condition & rehab AI · 6 photos
This nearly new home in Tavola West is in excellent condition with modern finishes and a well-maintained exterior. It offers a great opportunity for a buyer seeking a move-in-ready property.
Value-add opportunities
- Both Painting exterior and interior walls — Fresh paint enhances curb appeal and interior aesthetics.
- Both Landscaping improvements — Enhanced landscaping can increase both resale and rental value.
- Both Add smart home features — Smart home features can increase both resale and rental value by adding modern conveniences.
Renovation cost estimate screening
Value-add ROI direction
- Both Painting exterior and interior walls — Fresh paint enhances curb appeal and interior aesthetics. ↑
- Both Landscaping improvements — Enhanced landscaping can increase both resale and rental value. ↑
- Both Add smart home features — Smart home features can increase both resale and rental value by adding modern conveniences. ↑
ⓘ Cost ranges are severity-bucket heuristics (US national rule-of-thumb). Get contractor quotes + a written scope before underwriting a rehab budget.
Schools (NCES district)
- District
- New Caney ISD
- NCES district ID
- 4832400
- Math proficiency
- 31% ▼ -16.00%
- Reading proficiency
- 32% ▼ -6.00%
- Median HH income
- $55,380
- Composite
- 27.97/100
- National rank
- #6857
- State rank
- #570 of 826 in TX
Livability — Woodbranch
- Score
- 66/100
- State rank
- #646
- US rank
- #12243
Category grades
Schools grade is shown separately in the Schools card above.
Census & demographics
- County
- Montgomery County · 663,713 people
- Metro
- Houston-The Woodlands-Sugar Land, TX
- Population (ZIP)
- 37,592
- Household income
- $76,050
- Rent vs Own
- Severe rent burden
- 487.0
Population outlook (Montgomery County) Hauer SSP2
- Today (2025)
- 713,896 people
- By 2030
- 805,263 · +12.8%
- By 2040
- 992,708 · +39.1%
- By 2050
- 1,179,590 · +65.2%
- By 2075
- 1,628,084 · +128.1%
- By 2100
- 1,937,880 · +171.5%
Race, ethnicity, and origin ACS 2023
- Neighborhood character
- Diverse neighborhood (Simpson 0.56)
- Race & ethnicity
- Hispanic / Latino 49% White 45% Two or more races 31% Black 3%
- Hispanic origin (detail)
- Mexican 40%
- Common ancestry
- Lithuanian 2% Romanian 1% Iranian 1%
- Foreign-born
- 23% · Canada, Jamaica
- Languages at home
- 58% English-only · Spanish 40% Other Indo-European 1%
Political lean MEDSL · Montgomery
- 2024 margin
- Solid R (+45.5) · D 26.8% · R 72.3%
- 2008→2024 swing
- +7.2pp toward D · 2008: -52.7pp · 2024: -45.5pp
- All cycles
- 2024: R+45.5 2020: R+43.8 2016: R+51.4 2012: R+60.7 2008: R+52.7
Not yet ingested
- Civics
- —
Market trends
- HPI YoY
- ▼ -87.71%
- Current HPI
- 266.8315
- Rent YoY
- ▲ 0.21%
- Metro
- Houston-The Woodlands-Sugar Land, TX
- State GDP YoY
- ▲ 3.95%
- F500 in state
- 110
Industry mix (Fortune 500 HQ in TX)
| Industry | F500 HQs | Revenue |
|---|---|---|
| Energy | 16 | $1,198B |
|
||
| Technology | 5 | $198B |
|
||
| Engineering / Construction | 4 | $72B |
|
||
| Energy Services | 3 | $60B |
|
||
| Utilities | 3 | $41B |
|
||
| Healthcare | 2 | $330B |
|
||
Price history
-2.8% since first listed15 events — show timeline
- 2026-05-12 Listed $175,000 HARMLS
- 2025-09-06 Rental Removed $1,600 HARMLS
- 2025-09-05 Listing Removed — HARMLS
- 2025-07-08 Listed for Rent $1,600 HARMLS
- 2025-07-01 Rental Removed $1,600 HARMLS
- 2025-07-01 Listed for Rent $1,600 HARMLS
- 2025-06-24 Price Changed $190,000 HARMLS
- 2025-05-23 Listed $195,000 HARMLS
- 2025-05-20 Coming Soon — HARMLS
- 2024-12-30 Sold (MLS) — HARMLS
- 2024-12-11 Pending — HARMLS
- 2024-12-11 Price Changed $201,990 HARMLS
- 2024-11-27 Price Changed $180,000 HARMLS
- 2024-11-27 Price Changed $201,990 HARMLS
- 2024-11-22 Listed $180,000 HARMLS
Property tax history
+486.2%/yrLatest (2025): $6,542 · +486.2% YoY. Source: county tax records.
Cash-flow waterfall
monthlySold comps — $/sqft
last 12 mo · ≤1 miLoading sold comps…