 Triplex
48 Cedar Ave · Newark, NJ
Flood risk 4/10 · Minor
- FEMA flood zone
- X (unshaded)
- Chance of flooding over 30 yrs
- 0.22%
- Est. flood insurance / yr
- $507 – $1,088
Fire risk 1/10 · Minimal
- Est. fire insurance / yr
- $526 – $976
Heat risk 7/10 · Major
- Hot days now (above 100°F)
- 7 days/yr
- Hot days in 30 yrs
- 15 days/yr
Wind risk 6/10 · Moderate
- Chance of severe wind over 30 yrs
- 27.0%
Air-quality risk 4/10 · Minor
- Unhealthy air days now
- 4 days/yr
- Unhealthy air days in 30 yrs
- 5 days/yr
Risk factors via First Street. Map © Google.
Why this score? — see what drove the D grade
The composite is a weighted blend of 9 inputs, each scored 0–100. Each bar is that input's sub-score; the figure is the points it added to the 100-point composite (weight × sub-score).
- Cash flow +12.3/30.0
- ARV discount +7.5/15.0
- Appreciation +5.0/10.0
- Condition / age +4.0/5.0
- DSCR +3.7/10.0
- 1% rule +3.5/10.0
- Livability +3.4/5.0
- Rent growth +2.5/5.0
- Schools +1.4/10.0
$749,999
🖨 Deal sheet (PDF) 📄 Offer letter ✓ Due diligence
Multi-family units
County records classify this as Multi-Family (2-4 Unit). Listing-text estimate: 3 units. confirmed
Listing remarks
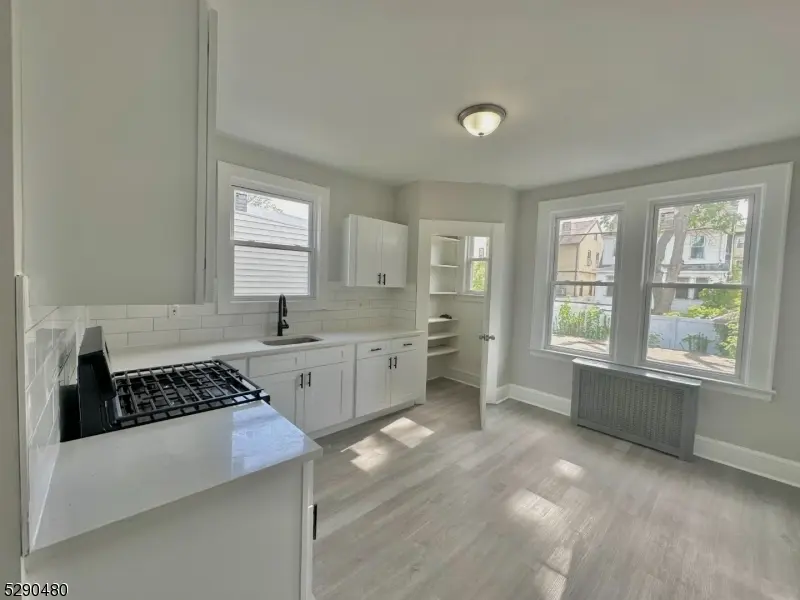
48 Cedar Ave is a well-maintained 3-family property offering strong rental potential and immediate cash flow. The 1st floor features 3 bedrooms, 1 bath, currently rented at $2,150/month. The 2nd floor unit includes 3 bedrooms, 1 bath, with access to the basement and garage, generating $2,798/month. The 3rd floor offers a 2-bedroom, 1 bath unit, currently vacant, but perfect for an owner-occupant or to lease for additional income (projected at $1,750/month). Ideally located just off South Orange Ave, this property provides convenient access to major highways, public transportation, shopping, and schools. Whether you're an investor looking to expand your portfolio or a buyer seeking to offset
Key facts
- Access to basement
- Shopping
- Schools
Tags
Property features AI
Finance
- Financial info: 3 total units; Reported net operating income, gross income, and total operating expenses listed as $0
Exterior
- Parking: One detached garage (1 garage space); One additional parking space; Driveway with 1-car width
- Utilities: Public water; Public sewer; Electric service available; Natural gas available
- Home design: Three-story multi-unit building
- Construction: Year built listed as approximate
- Exterior features: Wood siding; Asphalt shingle roof
Interior
- Kitchen: Gas range/oven in each unit
- Bedrooms: Unit 1: 3 bedrooms; Unit 2: 3 bedrooms; Unit 3: 2 bedrooms
- Bathrooms: Three full bathrooms and one half bathroom total; Unit 1: 1 bathroom; Unit 2: 1 bathroom; Unit 3: 1 bathroom
- Heating & cooling: Three heating units (natural gas); Window air conditioning units
- Interior features: Finished full basement; Carbon monoxide detectors; Fire alarm systems in each unit
- Laundry & utility: Utilities include electric and natural gas
Neighborhood map
What this means for you Summary
Snapshot
- This is a 2×3bd/1ba + 1×2bd/1ba units multifamily listed at $750k. Condition is rated good.
Deal economics
- At list price, monthly cash flow is $-137 ($-2k/yr) — negative. Per door: $-46/mo.
- To cash-flow at today's rent, offer at most $730k (2.6% below list).
- To meet the 1% rule (rent ≥ 1% of price), the offer needs to be $639k (14.8% below list).
- Recommended offer: $639k (14.8% below list) — sets the bar for 1% rule.
- Cap rate 6.1% vs local median 3.0% in Newark — top-decile yield for the area; either an underpriced asset or a hidden risk that comps aren't pricing in. Stress-test before assuming the spread holds.
Location & tenants
- Location reads 67/100 on livability (#343 in NJ) — a middle-class / working-renter tenant base. Strengths: commute A+, amenities A-; Watch: housing D+, crime F, employment D-.
- Newark Public School District (urban): math 9% / reading 26% proficiency, ranked #452 of 472 in NJ (top 96%) — low school quality limits family demand, transient renter base, plan for 1-2y turnover; 79% free/reduced lunch — lower-income household profile, screen leases tightly.
- Zoned schools: Ann Street School (math 13% / reading 34%, grade F, #921 of 1,303 statewide, top 71%, 1,200 students, 78% FRL); East Side High School (math 17% / reading 22%, grade F, #357 of 399 statewide, top 90%, 2,255 students, 77% FRL) — zoned schools at 77% FRL track the district average.
- Market conditions: 1 active listings in the ZIP; 3,364 units permitted in Essex County in 2024 (2,551 in 5+ unit buildings).
Forward outlook
- In year one you build about $28k of equity ($5k loan paydown + $22k appreciation (3.0% local appreciation)).
- Essex County population projected at +3% by 2050 — modest demand growth; plan on rents tracking national, not racing it.
- By year 2, paydown + projected appreciation supports a ~$45k cash-out refi (75% LTV) — recoverable capital for the next deal without selling this one.
Negotiation context
- It's been on market 41 days — a 3% lower offer ($727k) is reasonable based on typical stale-listing flexibility.
Risks & watch-outs
- Watch-outs: built in 1930 — expect roof / HVAC / electrical / plumbing capex.
- Climate carrying-cost: major wind risk, 27% chance of damaging wind over 30y; extreme-heat days projected 7→15/yr by 2055 (HVAC capex compounding) — expect insurance premiums to compound above CPI over the hold.
Questions for the listing agent
- What do current leases actually rent for vs. the listed asking? Can we see a recent rent roll and the last 12 months of T-12 income?
- It's been on market 41 days. Have you received any prior offers? Is the seller open to a 15% concession, seller financing, or rate buy-down credit?
- Can we see the unit-by-unit rent roll, current vacancy, and any below-market leases? What's the average tenancy length?
- What capital expenditures (roof, boiler, parking lot, exteriors) have been made in the last 5 years, and what's planned in the next 2?
- Built in 1930 — when were the roof, HVAC, electrical panel, plumbing, and water heater last replaced?
- Is there a deadline driving the sale (1031 exchange, divorce, estate, relocation)? That informs how much negotiation room exists.
- Schools are D-rated, which usually means shorter tenancies and higher turnover. Who's the typical renter profile here, and what's been the actual vacancy rate?
- Crime grade is F in this area — have there been break-ins, vandalism, or insurance claims at this property in the last 3 years? What carrier currently insures it and at what premium?
- The area grade is low — what's the realistic commute time and amenity access for the typical tenant pool here? Any planned neighborhood developments (good or bad) we should know about?
- What's the average days-on-market for RENTAL listings here right now (not sales)? A rising rental-DOM trend means longer vacancies and softer asking-rent achievability than the comps imply.
- What's the recent tenant-quality profile in this submarket — average credit score on applications, eviction rate, late-payment / NSF rate, and stable-employment percentage? A property-management company in the area should have these aggregated.
- How much new apartment / multifamily construction is in the pipeline within 1–3 miles? Heavy new supply (>2% of stock underway) typically softens rents 12–24 months out; light construction supports rent growth.
Investment metrics
- 1% rule
- 0.85% ✗
- Cap rate
- 6.07%
- Cash-on-cash
- -0.78%
- DSCR
- 0.97
- GRM
- 9.8
CMA / ARV
No comps found within radius.
Show comp detail 12 sales within ~0.75 mi
| Address | Dist | Beds/Ba | Sqft | Sold | Price | $/sf | Match |
|---|---|---|---|---|---|---|---|
| 29 Cedar Ave | 0.05mi | 10/3.0 (+1) | — | 1mo | $700,000 | — | 77 |
| 16 Alexander St | 0.28mi | 8/3.0 (-1) | — | 0mo | $560,000 | — | 67 |
| 132 S Munn Ave | 0.40mi | 9/4.0 | — | 4mo | $450,000 | — | 64 |
| 76-78 Halstead St | 0.49mi | 9/3.0 | — | 1mo | $810,000 | — | 61 |
| 552 Norwood St | 0.45mi | 8/3.0 (-1) | — | 0mo | $550,000 | — | 59 |
| 20 Stuyvesant Ave | 0.52mi | 9/3.0 | — | 4mo | $650,000 | — | 58 |
| 487 S 20th St | 0.61mi | 8/3.0 (-1) | — | 4mo | $750,000 | — | 48 |
| 163-165 Brookdale Ave | 0.67mi | 10/4.0 (+1) | — | 2mo | $570,000 | — | 48 |
| 275 Rhode Island Ave | 0.63mi | 8/3.0 (-1) | — | 5mo | $812,000 | — | 47 |
| 232-236 West End Ave | 0.72mi | 8/3.0 (-1) | — | 1mo | $540,000 | — | 46 |
| 443 Norwood St | 0.46mi | 8/8.0 (-1) | — | 4mo | $840,000 | — | 43 |
| 413 S 16th St | 0.75mi | 8/6.0 (-1) | — | 2mo | $750,000 | — | 36 |
Match score weights: distance 35% · size 25% · config 20% · recency 20%. Top-matched comps best support the ARV.
Projected returns pro-forma
3.0% appreciation · 3.0% rent growth · sell at horizon
- IRR
- 6.8%
- Equity multiple
- 1.39×
- Total profit
- $81,697
- Equity at exit
- $337,232
- IRR
- 9.6%
- Equity multiple
- 2.44×
- Total profit
- $303,343
- Equity at exit
- $519,715
Cash invested: $210,000 (down + closing). Projections, not guarantees.
Landlord ↔ Tenant lean methodology
- Overall (CITY)
- 0 Strongly Tenant-Friendly
- State New Jersey
- 21 Tenant-Leaning · D+6
- County
- — inherits STATE
- City Newark
- 0 Strongly Tenant-Friendly · D+59
ZIP-level market 07106-1217
- Active inventory
- 1
- Price-to-rent
- 28.6×
Monthly cashflow live
- Estimated rent
- $6,387 high interval (Pro) →
- Mortgage (P&I)
- −$3,933
- Tax est. 1.5%
- −$937 /mo · $11,250/yr
- Insurance
- −$312
- HOA
- −$0
- Vacancy / Maint / Mgmt
- −$1,341
- Net cashflow
- $-137
Break-even live
Sensitivity live
| Price | -10% $381 | -5% $122 | +0% $-137 | +5% $-396 | +10% $-656 |
|---|---|---|---|---|---|
| Rent | -10% $-642 | -5% $-390 | +0% $-137 | +5% $115 | +10% $367 |
| Rate | -1.0pp $240 | -0.5pp $53 | base $-137 | +0.5pp $-332 | +1.0pp $-529 |
3-unit breakdown (identical units grouped — click to expand)
| Units | Beds | Baths | Est. rent |
|---|---|---|---|
| 2× units | 3 | 1 | $4,372 |
| #1 | 3 | 1 | $2,186 |
| #2 | 3 | 1 | $2,186 |
| 1× unit | 2 | 1 | $2,014 |
| Total (3 units) | $6,387 | ||
UW: 25.0% down · 7.5% · 30yr · 1.5% tax · 5.0% vac · 8.0% maint · 8.0% mgmt
Financing live
Cash to close
- Down payment
- $187,500
- Closing costs
- $22,500
- Reserves months
- —
- Total cash needed
- —
Loan-product check · same deal, 3 products live
Conventional
25% down · 7.5% · 30yr
- Down + closing
- —
- Monthly P&I
- —
- Monthly cashflow
- —
- DSCR
- —
- Eligible?
- —
Personal DTI + credit; lowest rate.
DSCR
20% down · 8.5% · 30yr
- Down + closing
- —
- Monthly P&I
- —
- Monthly cashflow
- —
- DSCR
- —
- Eligible?
- —
No personal income docs; deal must DSCR.
Hard money
10% down · 12.0% · 12mo
- Down + closing
- —
- Monthly P&I
- —
- Monthly cashflow
- —
- DSCR
- —
- Eligible?
- —
Short-term bridge; refi at stabilization.
Listing history 16 events
-
2026-06-21days on market $749,999 Active 41 DOM
-
2026-06-18days on market $749,999 Active 38 DOM
-
2026-06-17days on market $749,999 Active 37 DOM
-
2026-06-16days on market $749,999 Active 36 DOM
-
2026-06-15days on market $749,999 Active 35 DOM
-
2026-06-13days on market $749,999 Active 33 DOM
-
2026-06-13days on market $749,999 Active 32 DOM
-
2026-06-09days on market $749,999 Active 29 DOM
-
2026-06-08days on market $749,999 Active 28 DOM
-
2026-06-07days on market $749,999 Active 27 DOM
-
2026-06-04days on market $749,999 Active 24 DOM
-
2026-06-03days on market $749,999 Active 23 DOM
-
2026-06-02days on market $749,999 Active 22 DOM
-
2026-06-01days on market $749,999 Active 21 DOM
-
2026-05-31days on market $749,999 Active 20 DOM
-
2026-05-11$749,999 Active 793-char remark
ⓘ Source: listings_history table (triggers on properties + properties_extension) + one-shot
backfill from property_details.listing_events for pre-trigger history.
Climate risk First Street
- Flood 4/10 Moderate FEMA zone X (unshaded) · 22% chance over 30 yrs
- Wildfire 1/10 Low
- Heat 7/10 Severe 7 d/yr ≥100°F today · 15 d/yr by 30 yrs out
- Wind 6/10 Major 27% chance of damaging wind over 30 yrs
- Air quality 4/10 Moderate 4 unhealthy d/yr today · 5 by 30 yrs out
Nearby sold comps map
Loading sold comps map…
Walkable amenities ~0.75 mi
Loading nearby amenities…
Taxation est. · year 1
- Rental income
- $76,644
- − Mortgage interest
- −$42,012
- − Property taxes
- −$11,250
- − Insurance
- −$3,750
- − Repairs & maintenance
- −$6,132
- − Management
- −$6,132
- − Depreciation
- −$21,818
- Taxable loss
- −$14,449
- Est. tax savings @ 24.0%
- +$3,468
- After-tax cash flow
- $1,820/yr
For passive investors: Depreciation is non-cash, so a rental often shows a tax loss while cash-flowing — sheltering income. Rental losses are passive: they offset passive income freely, and up to $25,000/yr can offset ordinary (W-2) income if you actively participate and your MAGI is under $100k (phasing out to $0 by $150k); unused losses carry forward. On sale, claimed depreciation is recaptured at up to 25%, and gains may owe capital-gains tax (a 1031 exchange can defer both). Figures are a year-1 estimate at your 24.0% rate — not tax advice; consult a CPA.
Condition & rehab AI · 9 photos
This 3-family property is in excellent condition with minimal repairs needed. It offers strong rental potential and immediate cash flow.
Value-add opportunities
- Both Painting exterior and interior walls — Enhances curb appeal and interior aesthetics
- Both Reorganizing and decluttering interior spaces — Improves flow and makes the property more appealing
- Both Upgrading light fixtures — Modernizes the property and improves energy efficiency
Renovation cost estimate screening
Value-add ROI direction
- Both Painting exterior and interior walls — Enhances curb appeal and interior aesthetics ↑
- Both Reorganizing and decluttering interior spaces — Improves flow and makes the property more appealing ↑
- Both Upgrading light fixtures — Modernizes the property and improves energy efficiency ↑
ⓘ Cost ranges are severity-bucket heuristics (US national rule-of-thumb). Get contractor quotes + a written scope before underwriting a rehab budget.
Schools (NCES district)
- District
- Newark Public School District
- NCES district ID
- 3411340
- Math proficiency
- 9% ▼ -17.00%
- Reading proficiency
- 26% ▼ -10.00%
- Median HH income
- $33,891
- Composite
- 14.24/100
- National rank
- #9449
- State rank
- #452 of 472 in NJ
Livability — Newark
- Score
- 67/100
- State rank
- #343
- US rank
- #11138
Category grades
Schools grade is shown separately in the Schools card above.
Census & demographics
- Census place
- Newark, NJ
Population outlook (Essex County) Hauer SSP2
- Today (2025)
- 825,042 people
- By 2030
- 834,010 · +1.1%
- By 2040
- 846,221 · +2.6%
- By 2050
- 850,047 · +3.0%
- By 2075
- 837,009 · +1.5%
- By 2100
- 784,345 · -4.9%
Not yet ingested
- Political lean
- —
- Race & ethnicity
- —
- Common origin
- —
- Civics
- —
Market trends
- HPI YoY
- —
- Current HPI
- —
- Rent YoY
- —
- Metro
- —
- State GDP YoY
- ▲ 2.05%
- F500 in state
- 34
Industry mix (Fortune 500 HQ in NJ)
| Industry | F500 HQs | Revenue |
|---|---|---|
| Consumer Goods | 3 | $31B |
|
||
| Pharmaceuticals | 2 | $153B |
|
||
| Technology | 2 | $21B |
|
||
| Insurance | 2 | $20B |
|
||
| Healthcare | 2 | $19B |
|
||
| Financial Services | 1 | $70B |
|
||
Price history
1 event — show timeline
- 2026-05-11 Listed $749,999 GSMLS
Cash-flow waterfall
monthlySold comps — $/sqft
last 12 mo · ≤1 miLoading sold comps…