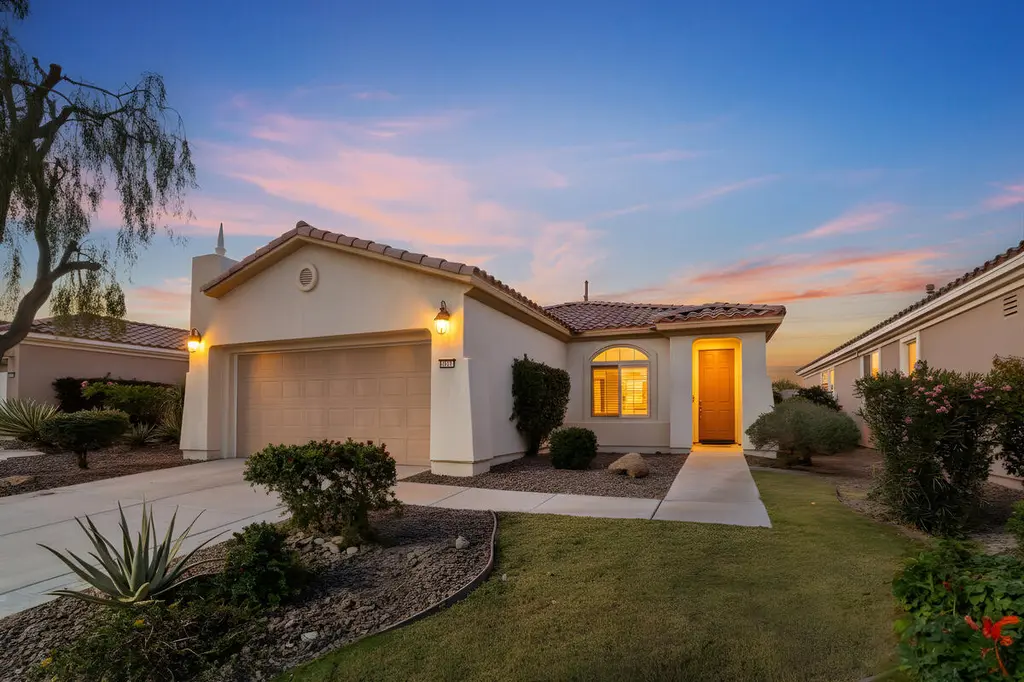
80410 Avenida Linda Vis · Indio, CA
Flood risk 1/10 · Minimal
- FEMA flood zone
- X (shaded)
- Chance of flooding over 30 yrs
- 0.0%
- Est. flood insurance / yr
- $507 – $1,088
Fire risk 6/10 · Moderate
- Est. fire insurance / yr
- $659 – $1,223
Heat risk 10/10 · Severe
- Hot days now (above 114°F)
- 7 days/yr
- Hot days in 30 yrs
- 19 days/yr
Wind risk 1/10 · Minimal
- Chance of severe wind over 30 yrs
- —
Air-quality risk 4/10 · Minor
- Unhealthy air days now
- 5 days/yr
- Unhealthy air days in 30 yrs
- 7 days/yr
Risk factors via First Street. Map © Google.
Why this score? — see what drove the D- grade
The composite is a weighted blend of 9 inputs, each scored 0–100. Each bar is that input's sub-score; the figure is the points it added to the 100-point composite (weight × sub-score).
- ARV discount +14.3/15.0
- Cash flow +7.0/30.0
- Rent growth +5.0/5.0
- Schools +3.8/10.0
- 1% rule +2.9/10.0
- Livability +2.7/5.0
- Condition / age +2.5/5.0
- DSCR +1.2/10.0
- Appreciation +0.0/10.0
$369,000
🖨 Deal sheet 📄 Offer letter ✓ Due diligence
Listing remarks MLS
Huge Price Reduction-Great investment property opportunity! Move-in ready San Ysidro model: 1,463 sq ft, 2 beds, 2 baths plus den with new carpet, paint, ceiling fans, dishwasher, and a newer refrigerator. Nearly $15,000 in recent improvements, including inspections and repairs. North-facing backyard offers shade and partial mountain views. With all these recent upgrades and the prime location in a vibrant, active adult community, this home provides the perfect blend of comfort and convenience for enjoying the desert lifestyle. Whether you're looking to unwind in the shaded backyard, connect with neighbors through a variety of social clubs, or take advantage of world-class amenities just steps from your door, this property is an ideal choice for those seeking both relaxation and recreation in the heart of the Coachella Valley. Located in Sun City Shadow Hills, a premier 55+ community featuring two clubhouses, three pools (one indoor), two fitness centers, golf courses, pickleball, tennis, bocce, billiards, and over 50 clubs. This is your opportunity, see it today!
Key facts
- Two clubhouses
- Two fitness centers
- Three pools
Tags
Neighborhood map
What this means for you Summary
Snapshot
- This is a 2-bed/2.0-bath single-family listed at $369k.
Deal economics
- At list price, monthly cash flow is $-533 ($-6k/yr) — negative.
- To cash-flow at today's rent, offer at most $275k (25.5% below list).
- To meet the 1% rule (rent ≥ 1% of price), the offer needs to be $292k (20.9% below list).
- Recommended offer: $275k (25.5% below list) — sets the bar for cash-flow.
Location & tenants
- Location reads 53/100 on livability (#927 in CA) — a working-class tenant base; expect higher turnover. Strengths: housing B+; Watch: employment D, schools F, crime F.
- Desert Sands Unified (suburban): math 31% / reading 56% proficiency, ranked #199 of 517 in CA (top 38%) — families likely to look elsewhere, expect single-tenant / working-renter base with shorter leases.
- Market conditions: Rents rising fast (+11.6%/yr); 441 active listings in the ZIP; 36 comparable units currently listed for rent nearby; rentals lingering (median 44d on market — plan ~5-8 weeks vacancy on turnover, expect pricing pressure); 61% of comp listings sitting > 30 days — soft ceiling on asking rent; solid renter incomes; 9,195 units permitted in Riverside County in 2024 (1,512 in 5+ unit buildings).
- This rent runs 36% of the median local income ($97k/yr) — at the standard rent-burdened threshold; future hikes will face affordability resistance.
Forward outlook
- Local home prices are declining (-3.0%/yr); year-one equity from $3k of loan paydown is wiped out by about $11k of value loss. Plan a longer hold.
- Riverside County population projected at +22% by 2050 — long-run rental-demand tailwind backs the buy-and-hold thesis.
Negotiation context
- It's been on market 180 days — a 12% lower offer ($325k) is reasonable based on typical stale-listing flexibility.
- 9 sale attempts since 22y ago; this cycle's ask has dropped $30k (8%) from the opening price — seller is motivated, your offer sets the floor, not the list.
- Current owner paid $170k; list at $369k implies a 117% gain — meaningful room to come down on a strong offer.
Risks & watch-outs
- Climate carrying-cost: major wildfire risk; extreme-heat days projected 7→19/yr by 2055 (HVAC capex compounding) — expect insurance premiums to compound above CPI over the hold.
Questions for the listing agent
- What do current leases actually rent for vs. the listed asking? Can we see a recent rent roll and the last 12 months of T-12 income?
- It's been on market 180 days. Have you received any prior offers? Is the seller open to a 26% concession, seller financing, or rate buy-down credit?
- What does the HOA fee cover, when was the last increase, and are there any pending special assessments or reserve-fund shortfalls?
- Why hasn't it sold? Are there any deal-killer items the seller is aware of (foundation, flood, title, zoning, code violations)?
- Is there a deadline driving the sale (1031 exchange, divorce, estate, relocation)? That informs how much negotiation room exists.
- Schools are F-rated, which usually means shorter tenancies and higher turnover. Who's the typical renter profile here, and what's been the actual vacancy rate?
- Crime grade is F in this area — have there been break-ins, vandalism, or insurance claims at this property in the last 3 years? What carrier currently insures it and at what premium?
- The area grade is low — what's the realistic commute time and amenity access for the typical tenant pool here? Any planned neighborhood developments (good or bad) we should know about?
- What's the average days-on-market for RENTAL listings here right now (not sales)? A rising rental-DOM trend means longer vacancies and softer asking-rent achievability than the comps imply.
- What's the recent tenant-quality profile in this submarket — average credit score on applications, eviction rate, late-payment / NSF rate, and stable-employment percentage? A property-management company in the area should have these aggregated.
- How much new for-sale + rental construction is in the pipeline within 1–3 miles? Heavy new supply typically softens prices + rents 12–24 months out; constrained supply supports both.
Investment metrics
- 1% rule
- 0.79% ✗
- Cap rate
- 4.56%
- Cash-on-cash
- -6.19%
- DSCR
- 0.72
- GRM
- 10.5
CMA / ARV
- ARV (median comp)
- $435,186
- List price
- $369,000
- Delta
- -15.21%
- Verdict
- UNDERPRICED
- Comps
- 20 within 1.0 mi
Show comp detail 12 sales within ~0.75 mi
| Address | Dist | Beds/Ba | Sqft | Sold | Price | $/sf | Match |
|---|---|---|---|---|---|---|---|
| 80323 Avenida Linda Vis | 0.09mi | 2/2.0 | 1,463 (0%) | 2mo | $370,000 | $253 | 94 |
| 80326 Avenida Linda Vis | 0.09mi | 2/2.0 | 1,463 (0%) | 2mo | $365,000 | $249 | 94 |
| 80273 Avenida Linda Vis | 0.14mi | 2/2.0 | 1,463 (0%) | 0mo | $408,000 | $279 | 93 |
| 80265 Avenida Linda Vis | 0.15mi | 2/2.0 | 1,463 (0%) | 0mo | $385,000 | $263 | 93 |
| 80358 Avenida Linda Vis | 0.05mi | 2/2.0 | 1,571 (+7%) | 5mo | $440,000 | $280 | 81 |
| 40848 Calle Santa Cruz | 0.43mi | 2/2.0 | 1,463 (0%) | 2mo | $419,000 | $286 | 78 |
| 40798 Calle Santa Cruz | 0.41mi | 2/2.0 | 1,463 (0%) | 4mo | $440,000 | $301 | 77 |
| 40125 Calle Las Positas | 0.08mi | 3/2.0 (+1) | 1,571 (+7%) | 4mo | $449,900 | $286 | 76 |
| 80775 Camino Santa Paula | 0.50mi | 2/2.0 | 1,432 (-2%) | 3mo | $429,000 | $300 | 71 |
| 80731 Camino Los Campos | 0.74mi | 2/2.0 | 1,463 (0%) | 0mo | $395,000 | $270 | 65 |
| 80555 Avenida San Fernando | 0.71mi | 2/2.0 | 1,488 (+2%) | 4mo | $399,900 | $269 | 60 |
| 80629 Avenida San Fernando | 0.73mi | 3/2.0 (+1) | 1,432 (-2%) | 3mo | $415,000 | $290 | 55 |
Match score weights: distance 35% · size 25% · config 20% · recency 20%. Top-matched comps best support the ARV.
Projected returns pro-forma
-3.0% appreciation · 8.0% rent growth · sell at horizon
- IRR
- -20.8%
- Equity multiple
- 0.24×
- Total profit
- $-78,089
- Equity at exit
- $55,019
- IRR
- -4.9%
- Equity multiple
- 0.61×
- Total profit
- $-40,586
- Equity at exit
- $31,904
Cash invested: $103,320 (down + closing). Projections, not guarantees.
Landlord ↔ Tenant lean methodology
- Overall (STATE)
- 18 Strongly Tenant-Friendly
- State California
- 18 Strongly Tenant-Friendly · D+13
- County
- — inherits STATE
- City
- — inherits STATE
ZIP-level market 92203
- Home prices YoY
- -25.0%
- Rents YoY
- 11.6%
- Active inventory
- 441
- Price-to-rent
- 10.5×
Monthly cashflow live
- Estimated rent
- $2,919 high interval (Pro) →
- Mortgage (P&I)
- −$1,935
- Tax from tax record
- −$352 /mo · $4,230/yr
- Insurance
- −$154
- HOA
- −$398
- Vacancy / Maint / Mgmt
- −$613
- Net cashflow
- $-533
Break-even live
UW: 25.0% down · 7.5% · 30yr · 1.5% tax · 5.0% vac · 8.0% maint · 8.0% mgmt
Financing live
Cash to close
- Down payment
- $92,250
- Closing costs
- $11,070
- Reserves months
- —
- Total cash needed
- —
Loan-product check · same deal, 3 products live
Conventional
25% down · 7.5% · 30yr
- Down + closing
- —
- Monthly P&I
- —
- Monthly cashflow
- —
- DSCR
- —
- Eligible?
- —
Personal DTI + credit; lowest rate.
DSCR
20% down · 8.5% · 30yr
- Down + closing
- —
- Monthly P&I
- —
- Monthly cashflow
- —
- DSCR
- —
- Eligible?
- —
No personal income docs; deal must DSCR.
Hard money
10% down · 12.0% · 12mo
- Down + closing
- —
- Monthly P&I
- —
- Monthly cashflow
- —
- DSCR
- —
- Eligible?
- —
Short-term bridge; refi at stabilization.
Rent comps 36 comps
| Address | Beds | Baths | Sqft | Rent | $/sqft | DOM | Units | Dist |
|---|---|---|---|---|---|---|---|---|
| 40201 Calle Santa Claudia Indio, CA | 2.0 | 2.0 | 1571 | $2,500 | $1.59 | 43d | 1 | 0.13mi |
| 80181 Camino San Mateo Unit NA Indio, CA | 2.0 | 2.0 | 1823 | $3,200 | $1.76 | 43d | 1 | 0.42mi |
| 80592 Avenida Santa Carmen Indio, CA | 2.0 | 2.5 | 1753 | $2,700 | $1.54 | 43d | 1 | 0.55mi |
| 80528 Avenida San Fernando Indio, CA | 2.0 | 2.0 | 1257 | $3,900 | $3.10 | 43d | 1 | 0.67mi |
| 81098 Avenida Vidrio Indio, CA | 2.0 | 2.0 | 1295 | $4,000 | $3.09 | 43d | 1 | 0.71mi |
| 80528 Avenida Camarillo Indio, CA | 2.0 | 2.0 | 1374 | $2,600 | $1.89 | 43d | 1 | 0.72mi |
| 80538 Avenida Camarillo Indio, CA | 2.0 | 2.0 | 1571 | $2,500 | $1.59 | 43d | 1 | 0.72mi |
| 41444 Via Arleta Indio, CA | 2.0 | 2.0 | 1374 | $2,500 | $1.82 | 24d | 1 | 0.79mi |
| 40087 Corte Azul Indio, CA | 2.0 | 2.0 | 1763 | $2,800 | $1.59 | 16d | 1 | 0.80mi |
| 41544 Via Arleta Indio, CA | 2.0 | 2.0 | 1374 | $2,500 | $1.82 | 24d | 1 | 0.83mi |
| 41562 Via Arleta Indio, CA | 2.0 | 2.0 | 1276 | $2,800 | $2.19 | 24d | 1 | 0.83mi |
| 38757 Camino Aguacero Indio, CA | 2.0 | 2.0 | 1321 | $3,400 | $2.57 | 18d | 1 | 0.91mi |
| 81220 Corte Tolon Indio, CA | 2.0 | 2.0 | 1723 | $4,500 | $2.61 | 24d | 1 | 0.91mi |
| 39310 Calle Popoca Indio, CA | 2.0 | 2.0 | 1321 | $2,950 | $2.23 | 24d | 1 | 0.97mi |
| 81363 Corte Compras Indio, CA | 2.0 | 2.0 | 1512 | $4,300 | $2.84 | 43d | 1 | 1.00mi |
| 39205 Calle Popoca Indio, CA | 2.0 | 2.0 | 1660 | $5,800 | $3.49 | 43d | 1 | 1.02mi |
| 81340 Corte Compras Indio, CA | 2.0 | 2.0 | 1321 | $3,000 | $2.27 | 43d | 1 | 1.05mi |
| 81211 Camino Lampazos Indio, CA | 3.0 | 2.0 | 1756 | $3,375 | $1.92 | 16d | 1 | 1.08mi |
| 79891 Avenue 42 Unit 1 Bermuda Dunes, CA | 2.0 | 2.0 | 1400 | $1,895 | $1.35 | 20d | 1 | 1.13mi |
| 79740 Avenue 42 Unit 4 Bermuda Dunes, CA | 2.0 | 2.0 | 1000 | $2,395 | $2.40 | 4d | 1 | 1.17mi |
| 79740 Avenue 42 Unit A Bermuda Dunes, CA | 2.0 | 2.0 | 1000 | $2,395 | $2.40 | 43d | 1 | 1.17mi |
| 79740 Avenue 42 Unit D Bermuda Dunes, CA | 2.0 | 2.0 | 1000 | $2,395 | $2.40 | 2d | 1 | 1.17mi |
| 81566 Avenida Sombra Indio, CA | 2.0 | 2.0 | 1763 | $2,245 | $1.27 | 5d | 1 | 1.18mi |
| 79700 Avenue 42 Unit B Bermuda Dunes, CA | 2.0 | 2.0 | 1100 | $2,395 | $2.18 | 43d | 1 | 1.19mi |
| 41085 Calle Pampas Indio, CA | 2.0 | 2.0 | 1488 | $2,700 | $1.81 | 43d | 1 | 1.23mi |
| 79661 Avenue 42 Unit C Bermuda Dunes, CA | 2.0 | 2.0 | 1100 | $2,095 | $1.90 | 43d | 1 | 1.23mi |
| 81579 Avenida Contento Indio, CA | 2.0 | 2.0 | 1257 | $4,600 | $3.66 | 43d | 1 | 1.29mi |
| 42391 Palisades Dr Indio, CA | 3.0 | 2.0 | 1679 | $2,975 | $1.77 | 43d | 1 | 1.31mi |
| 81672 Avenida Viesca Indio, CA | 3.0 | 2.0 | 1756 | $4,500 | $2.56 | 43d | 1 | 1.34mi |
| 79400 Avenue 42 Unit C Bermuda Dunes, CA | 2.0 | 2.0 | 1000 | $1,995 | $2.00 | 43d | 1 | 1.37mi |
| 81543 Avenida Celaya Indio, CA | 3.0 | 3.0 | 1700 | $3,500 | $2.06 | 43d | 1 | 1.42mi |
| 81710 Avenida Parito Indio, CA | 2.0 | 2.0 | 1488 | $2,700 | $1.81 | 14d | 1 | 1.45mi |
| 81673 Avenida Alturas Indio, CA | 2.0 | 2.0 | 1432 | $2,700 | $1.89 | 43d | 1 | 1.45mi |
| 81720 Avenida Parito Indio, CA | 2.0 | 2.0 | 1257 | $2,600 | $2.07 | 43d | 1 | 1.45mi |
| 78992 Apricot Ln Palm Desert, CA | 3.0 | 2.0 | 1664 | $2,950 | $1.77 | 10d | 1 | 1.46mi |
| 81656 Avenida de Baile Indio, CA | 2.0 | 2.0 | 1488 | $4,300 | $2.89 | 43d | 1 | 1.47mi |
HOA detail
- Monthly dues
- $398 · $4,776/yr
- Likely covers
- poolgym
Listing history 41 events
-
2026-06-18days on market $369,000 Active 180 DOM
-
2026-06-17days on market $369,000 Active 179 DOM
-
2026-06-16days on market $369,000 Active 178 DOM
-
2026-06-15days on market $369,000 Active 177 DOM
-
2026-06-13days on market $369,000 Active 175 DOM
-
2026-06-09days on market $369,000 Active 171 DOM
-
2026-06-08days on market $369,000 Active 170 DOM
-
2026-06-07days on market $369,000 Active 169 DOM
-
2026-06-04days on market $369,000 Active 166 DOM
-
2026-06-03days on market $369,000 Active 165 DOM
-
2026-06-02days on market $369,000 Active 164 DOM
-
2026-06-01days on market $369,000 Active 163 DOM
-
2026-05-31days on market $369,000 Active 162 DOM
-
2026-03-25price $369,000 1080-char remark
Show marketing remark (1080 chars)
Huge Price Reduction-Great investment property opportunity! Move-in ready San Ysidro model: 1,463 sq ft, 2 beds, 2 baths plus den with new carpet, paint, ceiling fans, dishwasher, and a newer refrigerator. Nearly $15,000 in recent improvements, including inspections and repairs. North-facing backyard offers shade and partial mountain views. With all these recent upgrades and the prime location in a vibrant, active adult community, this home provides the perfect blend of comfort and convenience for enjoying the desert lifestyle. Whether you're looking to unwind in the shaded backyard, connect with neighbors through a variety of social clubs, or take advantage of world-class amenities just steps from your door, this property is an ideal choice for those seeking both relaxation and recreation in the heart of the Coachella Valley. Located in Sun City Shadow Hills, a premier 55+ community featuring two clubhouses, three pools (one indoor), two fitness centers, golf courses, pickleball, tennis, bocce, billiards, and over 50 clubs. This is your opportunity, see it today!
-
2026-02-03price $389,000 1080-char remark
Show marketing remark (1080 chars)
Huge Price Reduction-Great investment property opportunity! Move-in ready San Ysidro model: 1,463 sq ft, 2 beds, 2 baths plus den with new carpet, paint, ceiling fans, dishwasher, and a newer refrigerator. Nearly $15,000 in recent improvements, including inspections and repairs. North-facing backyard offers shade and partial mountain views. With all these recent upgrades and the prime location in a vibrant, active adult community, this home provides the perfect blend of comfort and convenience for enjoying the desert lifestyle. Whether you're looking to unwind in the shaded backyard, connect with neighbors through a variety of social clubs, or take advantage of world-class amenities just steps from your door, this property is an ideal choice for those seeking both relaxation and recreation in the heart of the Coachella Valley. Located in Sun City Shadow Hills, a premier 55+ community featuring two clubhouses, three pools (one indoor), two fitness centers, golf courses, pickleball, tennis, bocce, billiards, and over 50 clubs. This is your opportunity, see it today!
-
2025-12-19$399,000 Active 1080-char remark
Show marketing remark (1080 chars)
Huge Price Reduction-Great investment property opportunity! Move-in ready San Ysidro model: 1,463 sq ft, 2 beds, 2 baths plus den with new carpet, paint, ceiling fans, dishwasher, and a newer refrigerator. Nearly $15,000 in recent improvements, including inspections and repairs. North-facing backyard offers shade and partial mountain views. With all these recent upgrades and the prime location in a vibrant, active adult community, this home provides the perfect blend of comfort and convenience for enjoying the desert lifestyle. Whether you're looking to unwind in the shaded backyard, connect with neighbors through a variety of social clubs, or take advantage of world-class amenities just steps from your door, this property is an ideal choice for those seeking both relaxation and recreation in the heart of the Coachella Valley. Located in Sun City Shadow Hills, a premier 55+ community featuring two clubhouses, three pools (one indoor), two fitness centers, golf courses, pickleball, tennis, bocce, billiards, and over 50 clubs. This is your opportunity, see it today!
-
2025-11-19status Active
-
2025-11-19historical
-
2025-11-18status Active
-
2025-11-09historical Active Under Contract
-
2025-10-06price $389,000
-
2025-08-15price $398,500
-
2025-05-12price $424,500
-
2025-03-24$449,500 Active
-
2010-09-30soldstatus $170,000 Closed
-
2010-09-29soldstatus $174,000
-
2010-08-31historical
-
2010-07-17historical Contingent
-
2010-06-23price $170,000
-
2010-06-14status Active
-
2010-06-13historical Contingent
-
2010-06-10price $175,000 Active
-
2010-06-10status Active
-
2010-03-02price $200,000
-
2009-08-24historical Contingent
-
2009-08-02$175,000 Active
-
2006-10-17historical
-
2006-03-15$325,000
-
2005-03-14soldstatus $300,000
-
2005-02-08historical
-
2004-12-28$307,900
ⓘ Source: listings_history table (triggers on properties + properties_extension) + one-shot
backfill from property_details.listing_events for pre-trigger history.
Tax reassessment forecast CA · Resets to sale price
- Current annual tax
- $4,230 · $352/mo
- Projected year-2 tax
- $4,230 · $352/mo
- Expected delta
- $0/yr ($0/mo · 0.0%)
ⓘ Screening estimate from a state-policy table — verify with the county assessor before closing.
Climate risk First Street
- Flood 1/10 Low FEMA zone X (shaded) · 0% chance over 30 yrs
- Wildfire 6/10 Major
- Heat 10/10 Extreme 7 d/yr ≥114°F today · 19 d/yr by 30 yrs out
- Wind 1/10 Low
- Air quality 4/10 Moderate 5 unhealthy d/yr today · 7 by 30 yrs out
Nearby sold comps map
Loading sold comps map…
Walkable amenities ~0.75 mi
Loading nearby amenities…
Taxation est. · year 1
- Rental income
- $35,033
- − Mortgage interest
- −$20,670
- − Property taxes
- −$4,230
- − Insurance
- −$1,845
- − Repairs & maintenance
- −$2,803
- − Management
- −$2,803
- − HOA
- −$4,776
- − Depreciation
- −$10,735
- Taxable loss
- −$12,827
- Est. tax savings @ 24.0%
- +$3,079
- After-tax cash flow
- $-3,317/yr
For passive investors: Depreciation is non-cash, so a rental often shows a tax loss while cash-flowing — sheltering income. Rental losses are passive: they offset passive income freely, and up to $25,000/yr can offset ordinary (W-2) income if you actively participate and your MAGI is under $100k (phasing out to $0 by $150k); unused losses carry forward. On sale, claimed depreciation is recaptured at up to 25%, and gains may owe capital-gains tax (a 1031 exchange can defer both). Figures are a year-1 estimate at your 24.0% rate — not tax advice; consult a CPA.
Schools (NCES district)
- District
- Desert Sands Unified
- NCES district ID
- 0611110
- Math proficiency
- 31% ▼ -4.00%
- Reading proficiency
- 56% ▲ 7.00%
- Median HH income
- $54,957
- Composite
- 37.77/100
- National rank
- #4346
- State rank
- #199 of 517 in CA
Livability — Indio
- Score
- 53/100
- State rank
- #927
- US rank
- #24244
Category grades
Schools grade is shown separately in the Schools card above.
Census & demographics
- Census place
- Indio, CA
- County
- Riverside County · 2,287,001 people
- City population
- 100,560
- Metro
- Riverside-San Bernardino-Ontario, CA
- Population (ZIP)
- 34,735
- Household income
- $97,311
- Rent vs Own
- Severe rent burden
- 565.0
Population outlook (Riverside County) Hauer SSP2
- Today (2025)
- 2,664,475 people
- By 2030
- 2,802,692 · +5.2%
- By 2040
- 3,050,904 · +14.5%
- By 2050
- 3,256,783 · +22.2%
- By 2075
- 3,655,058 · +37.2%
- By 2100
- 3,766,594 · +41.4%
Race, ethnicity, and origin ACS 2023
- Neighborhood character
- Diverse neighborhood (Simpson 0.57)
- Race & ethnicity
- Hispanic / Latino 51% White 41% Two or more races 29% Asian 3% Black 2%
- Hispanic origin (detail)
- Mexican 48%
- Common ancestry
- Italian 3% Lithuanian 2% Romanian 2%
- Foreign-born
- 14% · Canada
- Languages at home
- 64% English-only · Spanish 33% Tagalog/Filipino 1% Other Indo-European 1%
Political lean MEDSL · Riverside
- 2024 margin
- Toss-up / Even · D 48.0% · R 49.3% · Other 2.6%
- 2008→2024 swing
- -3.6pp toward R · 2008: 2.3pp · 2024: -1.3pp
- All cycles
- 2024: R+1.3 2020: D+8.0 2016: D+4.3 2012: R+0.4 2008: D+2.3
Not yet ingested
- Civics
- —
Market trends
- HPI YoY
- ▼ -98.51%
- Current HPI
- 295.6456
- Rent YoY
- ▲ 11.64%
- Metro
- Riverside-San Bernardino-Ontario, CA
- State GDP YoY
- ▲ 3.21%
- F500 in state
- 116
Industry mix (Fortune 500 HQ in CA)
| Industry | F500 HQs | Revenue |
|---|---|---|
| Technology | 27 | $1,492B |
|
||
| Financial Services | 3 | $174B |
|
||
| Retail | 3 | $44B |
|
||
| Insurance | 3 | $26B |
|
||
| Media / Entertainment | 2 | $115B |
|
||
| Pharmaceuticals / Biotech | 2 | $62B |
|
||
Price history
+19.8% since first listed28 events — show timeline
- 2026-03-25 Price Changed $369,000 GPSMLS
- 2026-02-03 Price Changed $389,000 GPSMLS
- 2025-12-19 Listed $399,000 GPSMLS
- 2025-11-19 Relisted — CRMLS
- 2025-11-19 Listing Removed — CRMLS
- 2025-11-18 Relisted — CRMLS
- 2025-11-09 Contingent — CRMLS
- 2025-10-06 Price Changed $389,000 CRMLS
- 2025-08-15 Price Changed $398,500 CRMLS
- 2025-05-12 Price Changed $424,500 CRMLS
- 2025-03-24 Listed $449,500 CRMLS
- 2010-09-30 Sold (MLS) $170,000 GPSMLS
- 2010-09-29 Sold (Public Records) $174,000 Public Records
- 2010-08-31 Listing Removed — GPSMLS
- 2010-07-17 Contingent — GPSMLS
- 2010-06-23 Price Changed $170,000 GPSMLS
- 2010-06-14 Relisted — GPSMLS
- 2010-06-13 Contingent — GPSMLS
- 2010-06-10 Relisted — GPSMLS
- 2010-06-10 Price Changed $175,000 GPSMLS
- 2010-03-02 Price Changed $200,000 GPSMLS
- 2009-08-24 Contingent — GPSMLS
- 2009-08-02 Listed $175,000 GPSMLS
- 2006-10-17 Listing Removed — GPSMLS
- 2006-03-15 Listed $325,000 GPSMLS
- 2005-03-14 Sold (Public Records) $300,000 Public Records
- 2005-02-08 Listing Removed — GPSMLS
- 2004-12-28 Listed $307,900 GPSMLS
Property tax history
+0.4%/yrLatest (2025): $4,230 · +8.4% YoY. Source: county tax records.
Cash-flow waterfall
monthlySold comps — $/sqft
last 12 mo · ≤1 miLoading sold comps…