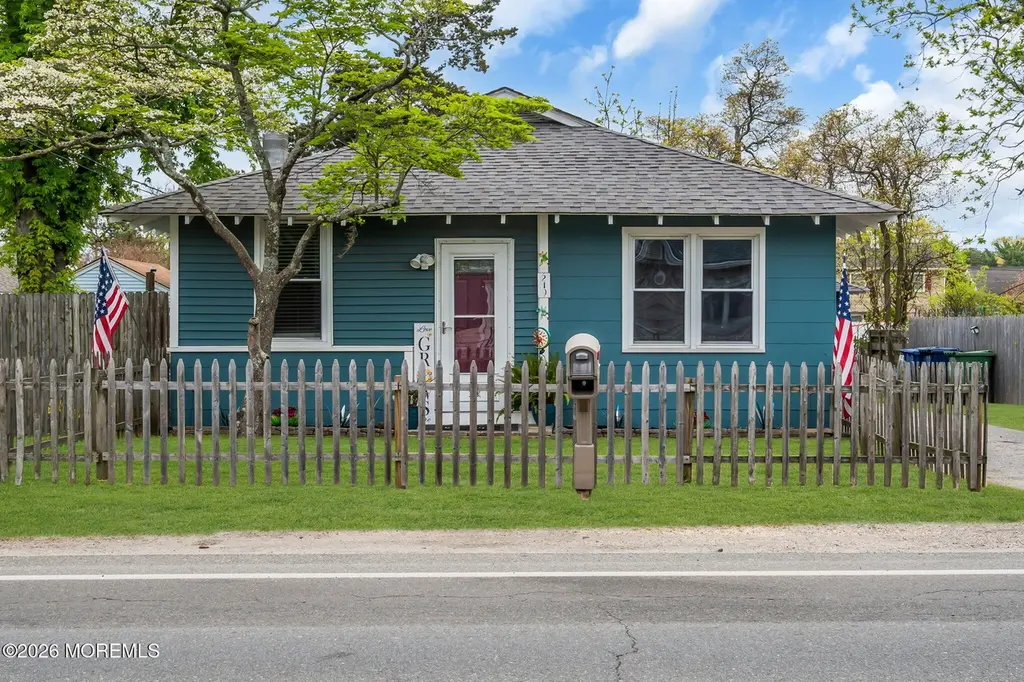
219 Beachwood Blvd · Beachwood, NJ
Flood risk 1/10 · Minimal
- FEMA flood zone
- X (unshaded)
- Chance of flooding over 30 yrs
- 0.0%
- Est. flood insurance / yr
- $507 – $1,088
Fire risk 3/10 · Minor
- Est. fire insurance / yr
- $526 – $976
Heat risk 7/10 · Major
- Hot days now (above 100°F)
- 7 days/yr
- Hot days in 30 yrs
- 15 days/yr
Wind risk 6/10 · Moderate
- Chance of severe wind over 30 yrs
- 72.0%
Air-quality risk 3/10 · Minor
- Unhealthy air days now
- 3 days/yr
- Unhealthy air days in 30 yrs
- 3 days/yr
Risk factors via First Street. Map © Google.
Why this score? — see what drove the D grade
The composite is a weighted blend of 9 inputs, each scored 0–100. Each bar is that input's sub-score; the figure is the points it added to the 100-point composite (weight × sub-score).
- Cash flow +12.7/30.0
- ARV discount +12.1/15.0
- DSCR +3.8/10.0
- Livability +3.6/5.0
- 1% rule +3.4/10.0
- Schools +2.9/10.0
- Rent growth +2.5/5.0
- Condition / age +2.5/5.0
- Appreciation +0.0/10.0
$375,000
🖨 Deal sheet (PDF) 📄 Offer letter ✓ Due diligence
Listing remarks MLS
Renovated w. newer kitchen incl. cabinets, appliance pkg, newer pergo-like maple floors, fresh paint thru-out, jacuzzi, marble fireplace, det gar, 26 living/dinrm combo, newer windows & Timberline roof. Newer above-ground oil tank, Yankee basement. Gas in street. ,Oil Tank Above Ground
Key facts
- 7,840 sq ft lot
- Garage
- Built 1914
Property features AI
Exterior
- Parking: 1-car garage
- Utilities: Public sewer
- Home design: Fee simple ownership
- Construction: Partial basement with walk-out access
- Exterior features: Shingle roof; Level topography
Interior
- Kitchen: Dishwasher; Microwave; Stove; Refrigerator; Kitchen has screens (window/door screens)
- Bedrooms: 3 bedrooms (all on the first level)
- Bathrooms: 1 full bathroom
- Heating & cooling: Forced air heating; Central air conditioning
- Interior features: Window treatments and blinds/shades; Ceiling fan(s); Fireplace (1)
Neighborhood map
What this means for you Summary
Snapshot
- This is a 2-bed/1.0-bath single-family listed at $375k.
Deal economics
- At list price, monthly cash flow is $-41 ($-495/yr) — negative.
- To cash-flow at today's rent, offer at most $368k (1.9% below list).
- To meet the 1% rule (rent ≥ 1% of price), the offer needs to be $314k (16.2% below list).
- Recommended offer: $314k (16.2% below list) — sets the bar for 1% rule.
- Cap rate 6.2% vs local median 3.5% in Beachwood — top-decile yield for the area; either an underpriced asset or a hidden risk that comps aren't pricing in. Stress-test before assuming the spread holds.
Location & tenants
- Location reads 72/100 on livability (#203 in NJ) — a middle-class / working-renter tenant base. Strengths: crime A+, employment A+, housing A+; Watch: amenities F, commute F, cost of living F.
- Toms River Regional School District (suburban): math 18% / reading 44% proficiency, ranked #316 of 472 in NJ (top 67%) — families likely to look elsewhere, expect single-tenant / working-renter base with shorter leases.
- Zoned schools: Pine Beach Elementary School (math 17% / reading 42%, grade F, #731 of 1,303 statewide, top 59%, 401 students, 41% FRL); Toms River Intermediate School South (math 15% / reading 43%, grade F, #321 of 431 statewide, top 77%, 1,048 students, 36% FRL); Toms River High School South (math 18% / reading 43%, grade F, #279 of 399 statewide, top 71%, 1,359 students, 27% FRL).
- Market conditions: 52 active listings in the ZIP; 10 comparable units currently listed for rent nearby; rentals leasing fast (median 14d on market — plan ~1-2 weeks tenant-placement turnaround); 4,434 units permitted in Ocean County in 2024 (868 in 5+ unit buildings).
Forward outlook
- Local home prices are declining (-3.0%/yr); year-one equity from $3k of loan paydown is wiped out by about $11k of value loss. Plan a longer hold.
- Ocean County population projected to shrink 8% by 2050 — rents likely to lag national; underwrite the cash flow, not the appreciation.
Negotiation context
- Only 13 days on market — expect competitive offers; lowballing is unlikely to land.
- 3 sale attempts since 30y ago; this cycle's ask has dropped $20k (5%) from the opening price — seller is motivated, your offer sets the floor, not the list.
- Current owner paid $230k; list at $375k implies a 63% gain — meaningful room to come down on a strong offer.
Risks & watch-outs
- Watch-outs: built in 1914 — expect roof / HVAC / electrical / plumbing capex.
- Climate carrying-cost: major wind risk, 72% chance of damaging wind over 30y; extreme-heat days projected 7→15/yr by 2055 (HVAC capex compounding) — expect insurance premiums to compound above CPI over the hold.
Questions for the listing agent
- What do current leases actually rent for vs. the listed asking? Can we see a recent rent roll and the last 12 months of T-12 income?
- Built in 1914 — when were the roof, HVAC, electrical panel, plumbing, and water heater last replaced?
- Is there a deadline driving the sale (1031 exchange, divorce, estate, relocation)? That informs how much negotiation room exists.
- The area grade is low — what's the realistic commute time and amenity access for the typical tenant pool here? Any planned neighborhood developments (good or bad) we should know about?
- What's the average days-on-market for RENTAL listings here right now (not sales)? A rising rental-DOM trend means longer vacancies and softer asking-rent achievability than the comps imply.
- What's the recent tenant-quality profile in this submarket — average credit score on applications, eviction rate, late-payment / NSF rate, and stable-employment percentage? A property-management company in the area should have these aggregated.
- How much new for-sale + rental construction is in the pipeline within 1–3 miles? Heavy new supply typically softens prices + rents 12–24 months out; constrained supply supports both.
Investment metrics
- 1% rule
- 0.84% ✗
- Cap rate
- 6.16%
- Cash-on-cash
- -0.47%
- DSCR
- 0.98
- GRM
- 9.9
CMA / ARV
- ARV (median comp)
- $418,197
- List price
- $375,000
- Delta
- -10.33%
- Verdict
- UNDERPRICED
- Comps
- 20 within 1.0 mi
Show comp detail 12 sales within ~0.75 mi
| Address | Dist | Beds/Ba | Sqft | Sold | Price | $/sf | Match |
|---|---|---|---|---|---|---|---|
| 65 Shell St | 0.19mi | 2/1.0 | 1,188 (-5%) | 4mo | $470,000 | $396 | 80 |
| 308 Seaman Ave | 0.09mi | 2/1.0 | 1,136 (-9%) | 6mo | $366,000 | $322 | 76 |
| 152 Forepeak Ave | 0.32mi | 3/1.0 (+1) | 1,200 (-4%) | 2mo | $433,000 | $361 | 72 |
| 145 Cable Ave | 0.20mi | 3/1.0 (+1) | 1,110 (-11%) | 0mo | $355,000 | $320 | 67 |
| 46 Bowline St | 0.37mi | 3/1.0 (+1) | 1,338 (+7%) | 5mo | $416,000 | $311 | 62 |
| 200 Pacific Ave | 0.42mi | 3/1.5 (+1) | 1,296 (+4%) | 6mo | $415,000 | $320 | 62 |
| 208 Longboat Ave | 0.37mi | 3/2.0 (+1) | 1,144 (-8%) | 4mo | $380,000 | $332 | 56 |
| 76 Maple St | 0.66mi | 3/1.0 (+1) | 1,187 (-5%) | 5mo | $510,000 | $430 | 52 |
| 808 Beach Ave | 0.69mi | 3/1.5 (+1) | 1,300 (+4%) | 5mo | $475,000 | $365 | 49 |
| 50 Maple St | 0.68mi | 3/1.0 (+1) | 1,374 (+10%) | 1mo | $440,000 | $320 | 46 |
| 645 Beachwood Blvd | 0.51mi | 3/1.0 (+1) | 1,103 (-12%) | 7mo | $405,000 | $367 | 46 |
| 744 Anchor Ave | 0.64mi | 3/2.0 (+1) | 1,120 (-10%) | 1mo | $475,000 | $424 | 43 |
Match score weights: distance 35% · size 25% · config 20% · recency 20%. Top-matched comps best support the ARV.
Projected returns pro-forma
-3.0% appreciation · 3.0% rent growth · sell at horizon
- IRR
- -17.1%
- Equity multiple
- 0.40×
- Total profit
- $-63,387
- Equity at exit
- $55,914
- IRR
- -9.0%
- Equity multiple
- 0.44×
- Total profit
- $-58,554
- Equity at exit
- $32,423
Cash invested: $105,000 (down + closing). Projections, not guarantees.
Landlord ↔ Tenant lean methodology
- Overall (STATE)
- 21 Tenant-Leaning
- State New Jersey
- 21 Tenant-Leaning · D+6
- County
- — inherits STATE
- City
- — inherits STATE
ZIP-level market 08722
- Home prices YoY
- -30.3%
- Active inventory
- 52
- Price-to-rent
- 9.9×
Monthly cashflow live
- Estimated rent
- $3,144 high interval (Pro) →
- Mortgage (P&I)
- −$1,967
- Tax from tax record
- −$402 /mo · $4,822/yr
- Insurance
- −$156
- HOA
- −$0
- Vacancy / Maint / Mgmt
- −$660
- Net cashflow
- $-41
Break-even live
Sensitivity live
| Price | -10% $171 | -5% $65 | +0% $-41 | +5% $-147 | +10% $-254 |
|---|---|---|---|---|---|
| Rent | -10% $-290 | -5% $-165 | +0% $-41 | +5% $83 | +10% $207 |
| Rate | -1.0pp $148 | -0.5pp $54 | base $-41 | +0.5pp $-138 | +1.0pp $-237 |
UW: 25.0% down · 7.5% · 30yr · 1.5% tax · 5.0% vac · 8.0% maint · 8.0% mgmt
Financing live
Cash to close
- Down payment
- $93,750
- Closing costs
- $11,250
- Reserves months
- —
- Total cash needed
- —
Loan-product check · same deal, 3 products live
Conventional
25% down · 7.5% · 30yr
- Down + closing
- —
- Monthly P&I
- —
- Monthly cashflow
- —
- DSCR
- —
- Eligible?
- —
Personal DTI + credit; lowest rate.
DSCR
20% down · 8.5% · 30yr
- Down + closing
- —
- Monthly P&I
- —
- Monthly cashflow
- —
- DSCR
- —
- Eligible?
- —
No personal income docs; deal must DSCR.
Hard money
10% down · 12.0% · 12mo
- Down + closing
- —
- Monthly P&I
- —
- Monthly cashflow
- —
- DSCR
- —
- Eligible?
- —
Short-term bridge; refi at stabilization.
Rent comps 10 comps
| Address | Beds | Baths | Sqft | Rent | $/sqft | DOM | Units | Dist |
|---|---|---|---|---|---|---|---|---|
| 254 Admiral Ave Beachwood, NJ | 3.0 | 2.0 | 1400 | $3,250 | $2.32 | 0d | 1 | 0.29mi |
| 408 Forepeak Ave Beachwood, NJ | 3.0 | 1.0 | 1138 | $3,500 | $3.08 | 3d | 1 | 0.33mi |
| 744 Cable Ave Beachwood, NJ | 3.0 | 2.0 | 1178 | $3,000 | $2.55 | 45d | 1 | 0.64mi |
| 60 Birch St Beachwood, NJ | 3.0 | 2.0 | 1450 | $2,600 | $1.79 | 45d | 1 | 0.76mi |
| 18 Maiden Ln Toms River, NJ | 3.0 | 1.0 | 1218 | $2,750 | $2.26 | 8d | 1 | 0.91mi |
| 944 Longboat Ave Beachwood, NJ | 3.0 | 1.5 | 1250 | $2,695 | $2.16 | 13d | 1 | 0.92mi |
| 379 Dover Rd Toms River, NJ | 2.0 | 2.0 | 1156 | $4,196 | $3.63 | 0d | 6 | 1.00mi |
| 29 Adelphi Rd Toms River, NJ | 3.0 | 1.0 | 864 | $2,700 | $3.12 | 18d | 1 | 1.08mi |
| 28 Brandies Rd Toms River, NJ | 3.0 | 1.0 | 864 | $2,800 | $3.24 | 0d | 1 | 1.37mi |
| 416 Hooper Ave Toms River, NJ | 3.0 | 1.5 | 1330 | $3,000 | $2.26 | 45d | 1 | 1.41mi |
Listing history 13 events
-
2026-05-13status Pending 965-char remark
-
2026-05-09price $375,000 965-char remark
-
2026-04-30$395,000 Active 965-char remark
-
2026-04-27historical $395,000 965-char remark
-
2006-11-13soldstatus $230,000
-
2006-10-31soldstatus $230,000 293-char remark
Show marketing remark (293 chars)
Renovated w. newer kitchen incl. cabinets, appliance pkg, newer pergo-like maple floors, fresh paint thru-out, jacuzzi, marble fireplace, det gar, 26 living/dinrm combo, newer windows & Timberline roof. Newer above-ground oil tank, Yankee basement. Gas in street. ,Oil Tank Above Ground
-
2006-07-15$237,500 293-char remark
Show marketing remark (293 chars)
Renovated w. newer kitchen incl. cabinets, appliance pkg, newer pergo-like maple floors, fresh paint thru-out, jacuzzi, marble fireplace, det gar, 26 living/dinrm combo, newer windows & Timberline roof. Newer above-ground oil tank, Yankee basement. Gas in street. ,Oil Tank Above Ground
-
2005-04-29soldstatus $190,000
-
2003-10-10soldstatus $135,000
-
1997-05-01soldstatus $63,000
-
1997-03-24soldstatus $62,000
Show marketing remark (326 chars)
ROUTE 9 OR ROUTE 166 TO BEACHWOOD BLVD. LOCK BOX ON REAR DOOR. 2 BR PLUS DEN OR NURSERY, DETACHED 1-CAR GAR & YANKEE BSMT HOME IN GOOD CONDITION, RENOVATED IN '61 NICE LR W/ FIREPLACE NOTE FOUNDATION ON RT SIDE NATURAL GAS IN HOUSE FOR COOKING & HOT WATER, OIL FOR HEAT. LOCK BOX ON REAR DOOR. ESTATE WANTS SOLD!!!
-
1997-01-15historical
Show marketing remark (326 chars)
ROUTE 9 OR ROUTE 166 TO BEACHWOOD BLVD. LOCK BOX ON REAR DOOR. 2 BR PLUS DEN OR NURSERY, DETACHED 1-CAR GAR & YANKEE BSMT HOME IN GOOD CONDITION, RENOVATED IN '61 NICE LR W/ FIREPLACE NOTE FOUNDATION ON RT SIDE NATURAL GAS IN HOUSE FOR COOKING & HOT WATER, OIL FOR HEAT. LOCK BOX ON REAR DOOR. ESTATE WANTS SOLD!!!
-
1996-11-26$68,900
Show marketing remark (326 chars)
ROUTE 9 OR ROUTE 166 TO BEACHWOOD BLVD. LOCK BOX ON REAR DOOR. 2 BR PLUS DEN OR NURSERY, DETACHED 1-CAR GAR & YANKEE BSMT HOME IN GOOD CONDITION, RENOVATED IN '61 NICE LR W/ FIREPLACE NOTE FOUNDATION ON RT SIDE NATURAL GAS IN HOUSE FOR COOKING & HOT WATER, OIL FOR HEAT. LOCK BOX ON REAR DOOR. ESTATE WANTS SOLD!!!
ⓘ Source: listings_history table (triggers on properties + properties_extension) + one-shot
backfill from property_details.listing_events for pre-trigger history.
Tax reassessment forecast NJ · Partial reset (capped growth)
- Current annual tax
- $4,822 · $402/mo
- Projected year-2 tax
- $7,080 · $590/mo
- Expected delta
- +$2,258/yr (+$188/mo · 46.8%)
ⓘ Screening estimate from a state-policy table — verify with the county assessor before closing.
Climate risk First Street
- Flood 1/10 Low FEMA zone X (unshaded) · 0% chance over 30 yrs
- Wildfire 3/10 Moderate
- Heat 7/10 Severe 7 d/yr ≥100°F today · 15 d/yr by 30 yrs out
- Wind 6/10 Major 72% chance of damaging wind over 30 yrs
- Air quality 3/10 Moderate 3 unhealthy d/yr today · 3 by 30 yrs out
Nearby sold comps map
Loading sold comps map…
Walkable amenities ~0.75 mi
Loading nearby amenities…
Taxation est. · year 1
- Rental income
- $37,722
- − Mortgage interest
- −$21,006
- − Property taxes
- −$4,822
- − Insurance
- −$1,875
- − Repairs & maintenance
- −$3,018
- − Management
- −$3,018
- − Depreciation
- −$10,909
- Taxable loss
- −$6,925
- Est. tax savings @ 24.0%
- +$1,662
- After-tax cash flow
- $1,167/yr
For passive investors: Depreciation is non-cash, so a rental often shows a tax loss while cash-flowing — sheltering income. Rental losses are passive: they offset passive income freely, and up to $25,000/yr can offset ordinary (W-2) income if you actively participate and your MAGI is under $100k (phasing out to $0 by $150k); unused losses carry forward. On sale, claimed depreciation is recaptured at up to 25%, and gains may owe capital-gains tax (a 1031 exchange can defer both). Figures are a year-1 estimate at your 24.0% rate — not tax advice; consult a CPA.
Schools (NCES district)
- District
- Toms River Regional School District
- NCES district ID
- 3416230
- Math proficiency
- 18% ▼ -19.00%
- Reading proficiency
- 44% ▼ -10.00%
- Median HH income
- $72,370
- Composite
- 29.07/100
- National rank
- #6602
- State rank
- #316 of 472 in NJ
Livability — Beachwood
- Score
- 72/100
- State rank
- #203
- US rank
- #5721
Category grades
Schools grade is shown separately in the Schools card above.
Census & demographics
- Census place
- Beachwood, NJ
- City population
- 11,002
- Population (ZIP)
- 11,002
Population outlook (Ocean County) Hauer SSP2
- Today (2025)
- 586,991 people
- By 2030
- 581,403 · -1.0%
- By 2040
- 564,913 · -3.8%
- By 2050
- 538,149 · -8.3%
- By 2075
- 468,845 · -20.1%
- By 2100
- 350,297 · -40.3%
Race, ethnicity, and origin ACS 2023
- Neighborhood character
- Predominantly White (78%)
- Race & ethnicity
- White 78% Hispanic / Latino 14% Two or more races 8% Black 4% Asian 1%
- Hispanic origin (detail)
- Mexican 3% Puerto Rican 4% Dominican 1%
- Common ancestry
- Romanian 11% Scotch-Irish 1% Serbian 1%
- Foreign-born
- 7% · Canada, Jamaica
- Languages at home
- 90% English-only · Spanish 7% Other Indo-European 1% French/Haitian/Cajun 1%
Political lean MEDSL · Ocean
- 2024 margin
- Solid R (+36.0) · D 31.4% · R 67.4% · Other 1.2%
- 2008→2024 swing
- -17.6pp toward R · 2008: -18.4pp · 2024: -36.0pp
- All cycles
- 2024: R+36.0 2020: R+28.7 2016: R+34.0 2012: R+17.7 2008: R+18.4
Not yet ingested
- Civics
- —
Market trends
- HPI YoY
- ▼ -170.97%
- Current HPI
- 393.5736
- Rent YoY
- —
- Metro
- —
- State GDP YoY
- ▲ 2.05%
- F500 in state
- 34
Industry mix (Fortune 500 HQ in NJ)
| Industry | F500 HQs | Revenue |
|---|---|---|
| Consumer Goods | 3 | $31B |
|
||
| Pharmaceuticals | 2 | $153B |
|
||
| Technology | 2 | $21B |
|
||
| Insurance | 2 | $20B |
|
||
| Healthcare | 2 | $19B |
|
||
| Financial Services | 1 | $70B |
|
||
Price history
+444.3% since first listed13 events — show timeline
- 2026-05-13 Pending — MOMLS
- 2026-05-09 Price Changed $375,000 MOMLS
- 2026-04-30 Listed $395,000 MOMLS
- 2026-04-27 Coming Soon $395,000 MOMLS
- 2006-11-13 Sold (Public Records) $230,000 Public Records
- 2006-10-31 Sold (MLS) $230,000 BRIGHT MLS
- 2006-07-15 Listed $237,500 BRIGHT MLS
- 2005-04-29 Sold (Public Records) $190,000 Public Records
- 2003-10-10 Sold (Public Records) $135,000 Public Records
- 1997-05-01 Sold (Public Records) $63,000 Public Records
- 1997-03-24 Sold (MLS) $62,000 MOMLS
- 1997-01-15 Delisted — MOMLS
- 1996-11-26 Listed $68,900 MOMLS
Property tax history
+2.4%/yrLatest (2025): $4,822 · +9.7% YoY. Source: county tax records.
Cash-flow waterfall
monthlySold comps — $/sqft
last 12 mo · ≤1 miLoading sold comps…