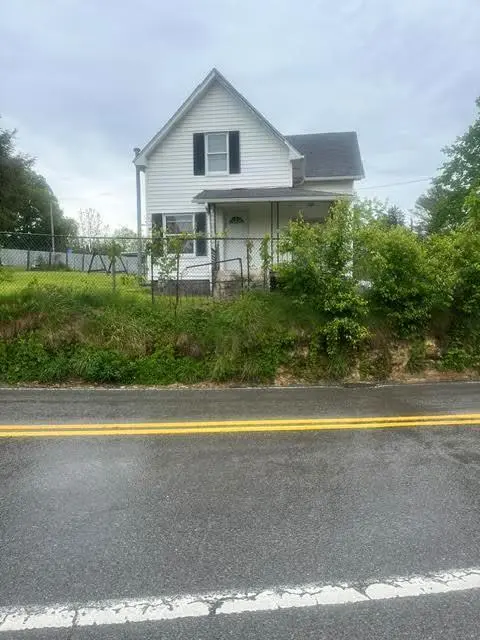
165 Rural Acres Dr · Sprague, WV
Flood risk 1/10 · Minimal
- FEMA flood zone
- X (unshaded)
- Chance of flooding over 30 yrs
- 0.0%
- Est. flood insurance / yr
- $507 – $1,088
Fire risk 2/10 · Minimal
- Est. fire insurance / yr
- $787 – $1,461
Heat risk 2/10 · Minimal
- Hot days now (above 92°F)
- 7 days/yr
- Hot days in 30 yrs
- 20 days/yr
Wind risk 1/10 · Minimal
- Chance of severe wind over 30 yrs
- —
Air-quality risk 1/10 · Minimal
- Unhealthy air days now
- 0 days/yr
- Unhealthy air days in 30 yrs
- 0 days/yr
Risk factors via First Street. Map © Google.
Why this score? — see what drove the D grade
The composite is a weighted blend of 9 inputs, each scored 0–100. Each bar is that input's sub-score; the figure is the points it added to the 100-point composite (weight × sub-score).
- Cash flow +14.4/30.0
- ARV discount +8.1/15.0
- DSCR +4.4/10.0
- 1% rule +4.0/10.0
- Rent growth +3.6/5.0
- Schools +3.0/10.0
- Livability +2.5/5.0
- Condition / age +2.2/5.0
- Appreciation +0.0/10.0
$147,000
🖨 Deal sheet (PDF) 📄 Offer letter ✓ Due diligence
Listing remarks
The layout of this traditional two-story home features functional defined rooms. Property is situated on a large and level fenced yard with workshop/storage building with electricity. Tire swing conveys! Charming wrap around porch and convenient location add to the appeal of the property. Efficient kitchen, mud room that could be utilized as pantry/extra storage. Bathroom has additional built-in storage.
Key facts
- Wrap around porch
- Fenced yard
- Efficient kitchen
Tags
Property features AI
Exterior
- Parking: No garage
- Utilities: Public water; Public sewer
- Home design: Residential property; Two levels
- Construction: Vinyl siding; Asphalt roof; Crawl space foundation; Built with two stories
- Exterior features: Garden; Covered patio/porch; Fenced yard; Shed(s); Level, landscaped lot; Has view
Interior
- Kitchen: Cooktop; Refrigerator
- Flooring: Carpet; Laminate
- Bathrooms: 1 full bathroom
- Heating & cooling: Natural gas heating; Ceiling fan(s); No central air
- Interior features: Ceiling fans
- Laundry & utility: Washer hookup; Gas water heater
Neighborhood map
What this means for you Summary
Snapshot
- This is a 3-bed/1.0-bath single-family listed at $147k. Condition is rated fair.
Deal economics
- At list price, monthly cash flow is $29 ($351/yr) — positive.
- The deal already cash-flows at list — no discount required.
- To meet the 1% rule (rent ≥ 1% of price), the offer needs to be $132k (10.0% below list).
- Recommended offer: $132k (10.0% below list) — sets the bar for 1% rule.
Location & tenants
- Location reads: area grade D — affects rentability + tenant quality, not the cash-flow math above.
- Raleigh County Schools (rural): math 29% / reading 42% proficiency, ranked #14 of 55 in WV (top 26%) — families likely to look elsewhere, expect single-tenant / working-renter base with shorter leases.
- Zoned schools: Beckley Elementary (math 17% / reading 22%, grade F, #350 of 377 statewide, top 95%, 320 students, 0% FRL); Beckley-Stratton Middle School (math 14% / reading 27%, grade F, #102 of 109 statewide, top 94%, 674 students, 0% FRL); Woodrow Wilson High School (math 24% / reading 56%, grade F, #20 of 110 statewide, top 17%, 1,330 students, 0% FRL) — zoned schools average 0% FRL vs 46% district-wide (46 pts lower); this property's tenant base skews higher-income than the district average.
- Market conditions: Rents rising fast (+4.2%/yr); 112 active listings in the ZIP; 41 units permitted in Raleigh County in 2024 (0 in 5+ unit buildings).
Forward outlook
- Local home prices are declining (-3.0%/yr); year-one equity from $1k of loan paydown is wiped out by about $4k of value loss. Plan a longer hold.
- Raleigh County population projected at -16% by 2050 — secular population decline; favor cash flow + early exit over multi-decade hold.
Negotiation context
- It's been on market 38 days — a 3% lower offer ($143k) is reasonable based on typical stale-listing flexibility.
Risks & watch-outs
- Watch-outs: built in 1935 — expect roof / HVAC / electrical / plumbing capex.
Questions for the listing agent
- It's been on market 38 days. Have you received any prior offers? Is the seller open to a 10% concession, seller financing, or rate buy-down credit?
- Have any recent inspections been done? Can we get a copy of the seller's disclosures and any deferred-maintenance estimates?
- Built in 1935 — when were the roof, HVAC, electrical panel, plumbing, and water heater last replaced?
- Is there a deadline driving the sale (1031 exchange, divorce, estate, relocation)? That informs how much negotiation room exists.
- The area grade is low — what's the realistic commute time and amenity access for the typical tenant pool here? Any planned neighborhood developments (good or bad) we should know about?
- What's the average days-on-market for RENTAL listings here right now (not sales)? A rising rental-DOM trend means longer vacancies and softer asking-rent achievability than the comps imply.
- What's the recent tenant-quality profile in this submarket — average credit score on applications, eviction rate, late-payment / NSF rate, and stable-employment percentage? A property-management company in the area should have these aggregated.
- How much new for-sale + rental construction is in the pipeline within 1–3 miles? Heavy new supply typically softens prices + rents 12–24 months out; constrained supply supports both.
Investment metrics
- 1% rule
- 0.90% ✗
- Cap rate
- 6.53%
- Cash-on-cash
- 0.85%
- DSCR
- 1.04
- GRM
- 9.3
CMA / ARV
- ARV (on-the-fly)
- $149,072
- Comps found
- 10
Show comp detail 10 sales within ~0.75 mi
| Address | Dist | Beds/Ba | Sqft | Sold | Price | $/sf | Match |
|---|---|---|---|---|---|---|---|
| 123 Ashwood St | 0.28mi | 3/1.5 | 1,220 (-1%) | 14mo | $125,000 | $102 | 72 |
| 122 Lori St | 0.10mi | 3/1.0 | 1,120 (-9%) | 13mo | $150,000 | $134 | 70 |
| 337 Mankin Ave | 0.68mi | 3/1.0 | 1,250 (+2%) | 10mo | $169,000 | $135 | 57 |
| 216 Dorcas Ave | 0.48mi | 4/2.0 (+1) | 1,287 (+4%) | 11mo | $153,000 | $119 | 52 |
| 104 Catlett St | 0.74mi | 3/1.0 | 1,211 (-2%) | 20mo | $147,000 | $121 | 46 |
| 223 Canterbury Dr | 0.37mi | 3/1.0 | 1,058 (-14%) | 17mo | $160,000 | $151 | 45 |
| 406 Orchard Ave | 0.69mi | 3/2.0 | 1,334 (+8%) | 12mo | $130,000 | $97 | 40 |
| 128 N Second St | 0.67mi | 2/1.0 (-1) | 1,344 (+9%) | 11mo | $69,900 | $52 | 39 |
| 405 Vine St | 0.72mi | 3/1.0 | 1,070 (-13%) | 8mo | $162,900 | $152 | 37 |
| 214 Saunders Ave | 0.69mi | 3/2.0 | 1,056 (-14%) | 9mo | $86,000 | $81 | 32 |
Match score weights: distance 35% · size 25% · config 20% · recency 20%. Top-matched comps best support the ARV.
Projected returns pro-forma
-3.0% appreciation · 4.25% rent growth · sell at horizon
- IRR
- -13.5%
- Equity multiple
- 0.51×
- Total profit
- $-20,254
- Equity at exit
- $21,918
- IRR
- -2.8%
- Equity multiple
- 0.80×
- Total profit
- $-8,068
- Equity at exit
- $12,710
Cash invested: $41,160 (down + closing). Projections, not guarantees.
Landlord ↔ Tenant lean methodology
- Overall (STATE)
- 83 Strongly Landlord-Friendly
- State West Virginia
- 83 Strongly Landlord-Friendly · R+22
- County
- — inherits STATE
- City
- — inherits STATE
ZIP-level market 25801
- Home prices YoY
- -17.8%
- Rents YoY
- 4.2%
- Active inventory
- 112
- Price-to-rent
- 9.3×
Monthly cashflow live
- Estimated rent
- $1,323 medium interval (Pro) →
- Mortgage (P&I)
- −$771
- Tax est. 1.5%
- −$184 /mo · $2,205/yr
- Insurance
- −$61
- HOA
- −$0
- Vacancy / Maint / Mgmt
- −$278
- Net cashflow
- $29
Break-even live
Sensitivity live
| Price | -10% $131 | -5% $80 | +0% $29 | +5% $-22 | +10% $-72 |
|---|---|---|---|---|---|
| Rent | -10% $-75 | -5% $-23 | +0% $29 | +5% $81 | +10% $134 |
| Rate | -1.0pp $103 | -0.5pp $67 | base $29 | +0.5pp $-9 | +1.0pp $-48 |
UW: 25.0% down · 7.5% · 30yr · 1.5% tax · 5.0% vac · 8.0% maint · 8.0% mgmt
Financing live
Cash to close
- Down payment
- $36,750
- Closing costs
- $4,410
- Reserves months
- —
- Total cash needed
- —
Loan-product check · same deal, 3 products live
Conventional
25% down · 7.5% · 30yr
- Down + closing
- —
- Monthly P&I
- —
- Monthly cashflow
- —
- DSCR
- —
- Eligible?
- —
Personal DTI + credit; lowest rate.
DSCR
20% down · 8.5% · 30yr
- Down + closing
- —
- Monthly P&I
- —
- Monthly cashflow
- —
- DSCR
- —
- Eligible?
- —
No personal income docs; deal must DSCR.
Hard money
10% down · 12.0% · 12mo
- Down + closing
- —
- Monthly P&I
- —
- Monthly cashflow
- —
- DSCR
- —
- Eligible?
- —
Short-term bridge; refi at stabilization.
Listing history 16 events
-
2026-06-19days on market $147,000 Active 38 DOM
-
2026-06-18days on market $147,000 Active 37 DOM
-
2026-06-17days on market $147,000 Active 36 DOM
-
2026-06-16days on market $147,000 Active 35 DOM
-
2026-06-15days on market $147,000 Active 34 DOM
-
2026-06-14days on market $147,000 Active 32 DOM
-
2026-06-12days on market $147,000 Active 31 DOM
-
2026-06-09days on market $147,000 Active 28 DOM
-
2026-06-08days on market $147,000 Active 27 DOM
-
2026-06-07days on market $147,000 Active 26 DOM
-
2026-06-03days on market $147,000 Active 22 DOM
-
2026-06-02days on market $147,000 Active 21 DOM
-
2026-06-01days on market $147,000 Active 20 DOM
-
2026-05-31days on market $147,000 Active 19 DOM
-
2026-05-30days on market $147,000 Active 18 DOM
-
2026-05-12$147,000 Active
ⓘ Source: listings_history table (triggers on properties + properties_extension) + one-shot
backfill from property_details.listing_events for pre-trigger history.
Climate risk First Street
- Flood 1/10 Low FEMA zone X (unshaded) · 0% chance over 30 yrs
- Wildfire 2/10 Low
- Heat 2/10 Low 7 d/yr ≥92°F today · 20 d/yr by 30 yrs out
- Wind 1/10 Low
- Air quality 1/10 Low 0 unhealthy d/yr today · 0 by 30 yrs out
Nearby sold comps map
Loading sold comps map…
Walkable amenities ~0.75 mi
Loading nearby amenities…
Taxation est. · year 1
- Rental income
- $15,875
- − Mortgage interest
- −$8,234
- − Property taxes
- −$2,205
- − Insurance
- −$735
- − Repairs & maintenance
- −$1,270
- − Management
- −$1,270
- − Depreciation
- −$4,276
- Taxable loss
- −$2,116
- Est. tax savings @ 24.0%
- +$508
- After-tax cash flow
- $858/yr
For passive investors: Depreciation is non-cash, so a rental often shows a tax loss while cash-flowing — sheltering income. Rental losses are passive: they offset passive income freely, and up to $25,000/yr can offset ordinary (W-2) income if you actively participate and your MAGI is under $100k (phasing out to $0 by $150k); unused losses carry forward. On sale, claimed depreciation is recaptured at up to 25%, and gains may owe capital-gains tax (a 1031 exchange can defer both). Figures are a year-1 estimate at your 24.0% rate — not tax advice; consult a CPA.
Condition & rehab AI · 20 photos
This traditional two-story home requires moderate repairs and updates to improve its condition and value. The exterior siding and interior walls show some discoloration, and the worn carpet needs replacing. Painting and updating the kitchen and interior walls would significantly enhance the home's curb appeal and value.
Repairs flagged
- Minor exterior siding — Some discoloration
- Major flooring — Worn carpet
- Minor interior walls — Some discoloration
Value-add opportunities
- Both Paint exterior siding — Enhances curb appeal and value
- Both Replace carpet — Improves comfort and value
- Both Update kitchen cabinets — Modernizes space and increases value
- Both Paint interior walls — Freshens up space and increases value
Renovation cost estimate screening
| Repair item | Severity | Est. cost |
|---|---|---|
| exterior siding · Some discoloration | Minor | $500–3,000 |
| flooring · Worn carpet | Major | $15,000–50,000 |
| interior walls · Some discoloration | Minor | $500–3,000 |
| Total estimated repair cost · 3 items | $16,000–56,000 |
Value-add ROI direction
- Both Paint exterior siding — Enhances curb appeal and value ↑
- Both Replace carpet — Improves comfort and value ↑
- Both Update kitchen cabinets — Modernizes space and increases value ↑
- Both Paint interior walls — Freshens up space and increases value ↑
ⓘ Cost ranges are severity-bucket heuristics (US national rule-of-thumb). Get contractor quotes + a written scope before underwriting a rehab budget.
Schools (NCES district)
- District
- Raleigh County Schools
- NCES district ID
- 5401230
- Math proficiency
- 29% ▼ -8.00%
- Reading proficiency
- 42% ▼ -3.00%
- Median HH income
- $39,828
- Composite
- 29.74/100
- National rank
- #6445
- State rank
- #14 of 55 in WV
Livability — Sprague
No livability data for this city. (Only ~50 U.S. cities are tracked.)
Census & demographics
- Census place
- Sprague, WV
- County
- Raleigh County · 31,128 people
- Metro
- Beckley, WV
- Population (ZIP)
- 31,128
- Household income
- $56,836
- Rent vs Own
- Severe rent burden
- 1384.0
Population outlook (Raleigh County) Hauer SSP2
- Today (2025)
- 73,505 people
- By 2030
- 70,954 · -3.5%
- By 2040
- 66,038 · -10.2%
- By 2050
- 61,919 · -15.8%
- By 2075
- 51,954 · -29.3%
- By 2100
- 39,724 · -46.0%
Race, ethnicity, and origin ACS 2023
- Neighborhood character
- Predominantly White (81%)
- Race & ethnicity
- White 81% Black 10% Two or more races 7% Hispanic / Latino 2% Asian 2%
- Common ancestry
- Slovak 2% Italian 1% Lithuanian 1%
- Foreign-born
- 2% · Canada
- Languages at home
- 96% English-only · Spanish 2% Other Indo-European 1%
Political lean MEDSL · Raleigh
- 2024 margin
- Solid R (+54.3) · D 22.0% · R 76.3% · Other 1.6%
- 2008→2024 swing
- -28.5pp toward R · 2008: -25.9pp · 2024: -54.3pp
- All cycles
- 2024: R+54.3 2020: R+50.4 2016: R+52.8 2012: R+44.6 2008: R+25.9
Not yet ingested
- Civics
- —
Market trends
- HPI YoY
- ▼ -45.60%
- Current HPI
- 210.0114
- Rent YoY
- ▲ 4.25%
- Metro
- Beckley, WV
- State GDP YoY
- —
- F500 in state
- 0
Price history
1 event — show timeline
- 2026-05-12 Listed $147,000 BBOR
Cash-flow waterfall
monthlySold comps — $/sqft
last 12 mo · ≤1 miLoading sold comps…