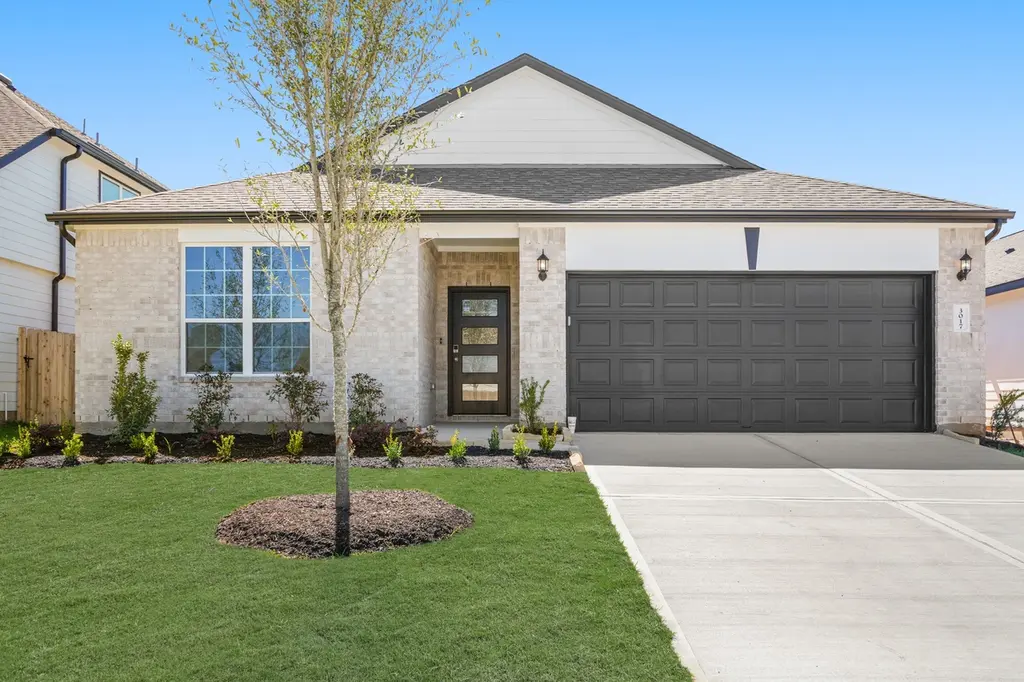
3017 Mistflower Trl · Pattison, TX
Flood risk No data
- FEMA flood zone
- —
- Chance of flooding over 30 yrs
- —
- Est. flood insurance / yr
- —
Fire risk No data
- Est. fire insurance / yr
- —
Heat risk No data
- Hot days now (above threshold)
- —
- Hot days in 30 yrs
- —
Wind risk No data
- Chance of severe wind over 30 yrs
- —
Air-quality risk No data
- Unhealthy air days now
- —
- Unhealthy air days in 30 yrs
- —
Risk factors via First Street. Map © Google.
Why this score? — see what drove the D- grade
The composite is a weighted blend of 9 inputs, each scored 0–100. Each bar is that input's sub-score; the figure is the points it added to the 100-point composite (weight × sub-score).
- Cash flow +12.2/30.0
- ARV discount +9.3/15.0
- DSCR +3.6/10.0
- Livability +3.2/5.0
- 1% rule +2.5/10.0
- Condition / age +2.5/5.0
- Rent growth +2.2/5.0
- Schools +2.0/10.0
- Appreciation +0.0/10.0
$289,990
🖨 Deal sheet (PDF) 📄 Offer letter ✓ Due diligence
Listing remarks MLS
The Pearl plan is a well-designed 1-story home with 3 bedrooms, 2 bathrooms, and an open-concept living and kitchen area. This floorplan features a covered patio, an oversized pantry, a kitchen island with bar seating, a large family room, and a 2-car garage. The primary suite includes a walk-in closet with ample space connected to a private bathroom. The Pearl also features a dedicated laundry room and additional closet space for storage.
Key facts
- Gourmet kitchen
- 42 inch cabinets
- Granite countertops
Tags
Neighborhood map
What this means for you Summary
Snapshot
- This is a 3-bed/2.0-bath single-family listed at $290k.
Deal economics
- At list price, monthly cash flow is $-60 ($-726/yr) — negative.
- To cash-flow at today's rent, offer at most $279k (3.7% below list).
- To meet the 1% rule (rent ≥ 1% of price), the offer needs to be $219k (24.5% below list).
- Recommended offer: $219k (24.5% below list) — sets the bar for 1% rule.
- Cap rate 6.0% vs local median 4.4% in Pattison — top-decile yield for the area; either an underpriced asset or a hidden risk that comps aren't pricing in. Stress-test before assuming the spread holds.
Location & tenants
- Location reads 63/100 on livability (#876 in TX) — a middle-class / working-renter tenant base. Strengths: housing A+, crime A, cost of living A; Watch: schools F, amenities F, commute F.
- Royal ISD (rural): math 23% / reading 23% proficiency, ranked #744 of 826 in TX (top 90%) — low school quality limits family demand, transient renter base, plan for 1-2y turnover; 77% free/reduced lunch — lower-income household profile, screen leases tightly.
- Market conditions: Rents soft (-1.0%/yr); 997 active listings in the ZIP; 2 comparable units currently listed for rent nearby; solid renter incomes; 483 units permitted in Waller County in 2024 (89 in 5+ unit buildings).
- This rent runs 31% of the median local income ($84k/yr) — at the standard rent-burdened threshold; future hikes will face affordability resistance.
Forward outlook
- Local home prices are declining (-3.0%/yr); year-one equity from $2k of loan paydown is wiped out by about $9k of value loss. Plan a longer hold.
- Waller County population projected at +62% by 2050 — long-run rental-demand tailwind backs the buy-and-hold thesis.
Negotiation context
- It's been on market 148 days — a 12% lower offer ($255k) is reasonable based on typical stale-listing flexibility.
- 2 sale attempts with the ask held roughly flat each time — persistent listings suggest the price (not the market) is what's stuck; bring a comps-based counter.
Questions for the listing agent
- What do current leases actually rent for vs. the listed asking? Can we see a recent rent roll and the last 12 months of T-12 income?
- It's been on market 148 days. Have you received any prior offers? Is the seller open to a 25% concession, seller financing, or rate buy-down credit?
- What does the HOA fee cover, when was the last increase, and are there any pending special assessments or reserve-fund shortfalls?
- Why hasn't it sold? Are there any deal-killer items the seller is aware of (foundation, flood, title, zoning, code violations)?
- Is there a deadline driving the sale (1031 exchange, divorce, estate, relocation)? That informs how much negotiation room exists.
- Schools are F-rated, which usually means shorter tenancies and higher turnover. Who's the typical renter profile here, and what's been the actual vacancy rate?
- The area grade is low — what's the realistic commute time and amenity access for the typical tenant pool here? Any planned neighborhood developments (good or bad) we should know about?
- What's the average days-on-market for RENTAL listings here right now (not sales)? A rising rental-DOM trend means longer vacancies and softer asking-rent achievability than the comps imply.
- What's the recent tenant-quality profile in this submarket — average credit score on applications, eviction rate, late-payment / NSF rate, and stable-employment percentage? A property-management company in the area should have these aggregated.
- How much new for-sale + rental construction is in the pipeline within 1–3 miles? Heavy new supply typically softens prices + rents 12–24 months out; constrained supply supports both.
Investment metrics
- 1% rule
- 0.75% ✗
- Cap rate
- 6.04%
- Cash-on-cash
- -0.89%
- DSCR
- 0.96
- GRM
- 11.0
CMA / ARV
- ARV (median comp)
- $301,893
- List price
- $289,990
- Delta
- -3.94%
- Verdict
- FAIR
- Comps
- 20 within 1.0 mi
Show comp detail 12 sales within ~0.75 mi
| Address | Dist | Beds/Ba | Sqft | Sold | Price | $/sf | Match |
|---|---|---|---|---|---|---|---|
| 3004 Mistflower Trl | 0.04mi | 3/2.0 | 1,898 (0%) | 2mo | $289,990 | $153 | 97 |
| 3036 Mistflower Trl | 0.03mi | 3/2.5 | 1,920 (+1%) | 1mo | $314,990 | $164 | 94 |
| 3020 Bristlegrass St | 0.12mi | 3/2.0 | 1,898 (0%) | 2mo | $289,990 | $153 | 92 |
| 3016 Bristlegrass St | 0.11mi | 3/2.0 | 1,961 (+3%) | 3mo | $324,990 | $166 | 87 |
| 3037 Bristlegrass St | 0.15mi | 3/2.0 | 1,961 (+3%) | 4mo | $299,990 | $153 | 85 |
| 3000 Sunflower Ln | 0.22mi | 3/2.0 | 1,915 (+1%) | 6mo | $276,990 | $145 | 84 |
| 3045 Buckthorn Dr | 0.11mi | 3/2.5 | 2,026 (+7%) | 3mo | $328,484 | $162 | 79 |
| 3013 Bristlegrass St | 0.10mi | 4/3.0 (+1) | 2,050 (+8%) | 4mo | $334,990 | $163 | 70 |
| 3036 Plateau Dr | 0.13mi | 4/2.5 (+1) | 2,049 (+8%) | 5mo | $299,728 | $146 | 70 |
| 3009 El Dorado Dr | 0.08mi | 4/3.0 (+1) | 2,084 (+10%) | 2mo | $337,398 | $162 | 69 |
| 3033 Buckthorn Dr | 0.09mi | 4/3.0 (+1) | 2,125 (+12%) | 3mo | $332,006 | $156 | 64 |
| 3061 Arrowwood Dr | 0.15mi | 4/3.0 (+1) | 2,084 (+10%) | 5mo | $330,335 | $159 | 64 |
Match score weights: distance 35% · size 25% · config 20% · recency 20%. Top-matched comps best support the ARV.
Projected returns pro-forma
-3.0% appreciation · 0.0% rent growth · sell at horizon
- IRR
- -20.8%
- Equity multiple
- 0.29×
- Total profit
- $-57,356
- Equity at exit
- $43,238
- IRR
- -21.9%
- Equity multiple
- 0.01×
- Total profit
- $-80,093
- Equity at exit
- $25,073
Cash invested: $81,197 (down + closing). Projections, not guarantees.
Landlord ↔ Tenant lean methodology
- Overall (STATE)
- 87 Strongly Landlord-Friendly
- State Texas
- 87 Strongly Landlord-Friendly · R+5
- County
- — inherits STATE
- City
- — inherits STATE
ZIP-level market 77423
- Rents YoY
- -1.0%
- Active inventory
- 997
- Price-to-rent
- 11.0×
Monthly cashflow live
- Estimated rent
- $2,188 medium interval (Pro) →
- Mortgage (P&I)
- −$1,521
- Tax from tax record
- −$90 /mo · $1,077/yr
- Insurance
- −$121
- HOA
- −$58
- Vacancy / Maint / Mgmt
- −$460
- Net cashflow
- $-60
Break-even live
Sensitivity live
| Price | -10% $104 | -5% $22 | +0% $-60 | +5% $-143 | +10% $-225 |
|---|---|---|---|---|---|
| Rent | -10% $-233 | -5% $-147 | +0% $-60 | +5% $26 | +10% $112 |
| Rate | -1.0pp $86 | -0.5pp $13 | base $-60 | +0.5pp $-136 | +1.0pp $-212 |
UW: 25.0% down · 7.5% · 30yr · 1.5% tax · 5.0% vac · 8.0% maint · 8.0% mgmt
Financing live
Cash to close
- Down payment
- $72,498
- Closing costs
- $8,700
- Reserves months
- —
- Total cash needed
- —
Loan-product check · same deal, 3 products live
Conventional
25% down · 7.5% · 30yr
- Down + closing
- —
- Monthly P&I
- —
- Monthly cashflow
- —
- DSCR
- —
- Eligible?
- —
Personal DTI + credit; lowest rate.
DSCR
20% down · 8.5% · 30yr
- Down + closing
- —
- Monthly P&I
- —
- Monthly cashflow
- —
- DSCR
- —
- Eligible?
- —
No personal income docs; deal must DSCR.
Hard money
10% down · 12.0% · 12mo
- Down + closing
- —
- Monthly P&I
- —
- Monthly cashflow
- —
- DSCR
- —
- Eligible?
- —
Short-term bridge; refi at stabilization.
Rent comps 2 comps
| Address | Beds | Baths | Sqft | Rent | $/sqft | DOM | Units | Dist |
|---|---|---|---|---|---|---|---|---|
| 3005 Wood Lily Dr Brookshire, TX | 4.0 | 3.0 | 1751 | $1,975 | $1.13 | 44d | 1 | 0.39mi |
| 3045 Wood Lily Dr Brookshire, TX | 4.0 | 2.0 | 1534 | $1,850 | $1.21 | 44d | 1 | 0.45mi |
HOA detail
- Monthly dues
- $58 · $696/yr
Listing history 17 events
-
2026-06-18days on market $289,990 Active 148 DOM
-
2026-06-17days on market $289,990 Active 147 DOM
-
2026-06-16days on market $289,990 Active 146 DOM
-
2026-06-15days on market $289,990 Active 145 DOM
-
2026-06-13days on market $289,990 Active 143 DOM
-
2026-06-10days on market $289,990 Active 139 DOM
-
2026-06-08days on market $289,990 Active 138 DOM
-
2026-06-07days on market $289,990 Active 137 DOM
-
2026-06-04days on market $289,990 Active 134 DOM
-
2026-06-03days on market $289,990 Active 133 DOM
-
2026-06-02days on market $289,990 Active 132 DOM
-
2026-06-01days on market $289,990 Active 131 DOM
-
2026-05-31days on market $289,990 Active 130 DOM
-
2026-03-11price $294,990 443-char remark
Show marketing remark (443 chars)
The Pearl plan is a well-designed 1-story home with 3 bedrooms, 2 bathrooms, and an open-concept living and kitchen area. This floorplan features a covered patio, an oversized pantry, a kitchen island with bar seating, a large family room, and a 2-car garage. The primary suite includes a walk-in closet with ample space connected to a private bathroom. The Pearl also features a dedicated laundry room and additional closet space for storage.
-
2026-03-09price $294,990 681-char remark
Show marketing remark (681 chars)
Love where you live in Bluestem in Brookshire, TX! The Pearl floor plan is a charming 1-story home with 3 bedrooms, 2 bathrooms, and a 2-car garage. This home has it all, including a mud room/drop zone and vinyl plank flooring throughout. The gourmet kitchen is sure to please with 42-inch cabinets, granite countertops, and stainless-steel appliances! Retreat to the secluded Owner's Suite featuring double sinks with granite countertops, separate tub and shower, spacious walk-in closet, and tray ceiling for some dramatic flair! Enjoy the great outdoors with a sprinkler system and a covered patio! Don't miss your opportunity to call Bluestem home, schedule a visit today!
-
2026-01-21$299,990 Active 681-char remark
Show marketing remark (681 chars)
Love where you live in Bluestem in Brookshire, TX! The Pearl floor plan is a charming 1-story home with 3 bedrooms, 2 bathrooms, and a 2-car garage. This home has it all, including a mud room/drop zone and vinyl plank flooring throughout. The gourmet kitchen is sure to please with 42-inch cabinets, granite countertops, and stainless-steel appliances! Retreat to the secluded Owner's Suite featuring double sinks with granite countertops, separate tub and shower, spacious walk-in closet, and tray ceiling for some dramatic flair! Enjoy the great outdoors with a sprinkler system and a covered patio! Don't miss your opportunity to call Bluestem home, schedule a visit today!
-
2026-01-16$299,990 Active 443-char remark
Show marketing remark (443 chars)
The Pearl plan is a well-designed 1-story home with 3 bedrooms, 2 bathrooms, and an open-concept living and kitchen area. This floorplan features a covered patio, an oversized pantry, a kitchen island with bar seating, a large family room, and a 2-car garage. The primary suite includes a walk-in closet with ample space connected to a private bathroom. The Pearl also features a dedicated laundry room and additional closet space for storage.
ⓘ Source: listings_history table (triggers on properties + properties_extension) + one-shot
backfill from property_details.listing_events for pre-trigger history.
Tax reassessment forecast TX · Resets to sale price
- Current annual tax
- $1,077 · $90/mo
- Projected year-2 tax
- $5,307 · $442/mo
- Expected delta
- +$4,230/yr (+$353/mo · 392.9%)
ⓘ Screening estimate from a state-policy table — verify with the county assessor before closing.
Nearby sold comps map
Loading sold comps map…
Walkable amenities ~0.75 mi
Loading nearby amenities…
Taxation est. · year 1
- Rental income
- $26,260
- − Mortgage interest
- −$16,244
- − Property taxes
- −$1,077
- − Insurance
- −$1,450
- − Repairs & maintenance
- −$2,101
- − Management
- −$2,101
- − HOA
- −$696
- − Depreciation
- −$8,436
- Taxable loss
- −$5,844
- Est. tax savings @ 24.0%
- +$1,403
- After-tax cash flow
- $677/yr
For passive investors: Depreciation is non-cash, so a rental often shows a tax loss while cash-flowing — sheltering income. Rental losses are passive: they offset passive income freely, and up to $25,000/yr can offset ordinary (W-2) income if you actively participate and your MAGI is under $100k (phasing out to $0 by $150k); unused losses carry forward. On sale, claimed depreciation is recaptured at up to 25%, and gains may owe capital-gains tax (a 1031 exchange can defer both). Figures are a year-1 estimate at your 24.0% rate — not tax advice; consult a CPA.
Schools (NCES district)
- District
- Royal ISD
- NCES district ID
- 4838190
- Math proficiency
- 23% ▼ -11.00%
- Reading proficiency
- 23% ▼ -6.00%
- Median HH income
- $41,059
- Composite
- 19.55/100
- National rank
- #8760
- State rank
- #744 of 826 in TX
Livability — Pattison
- Score
- 63/100
- State rank
- #876
- US rank
- #15789
Category grades
Schools grade is shown separately in the Schools card above.
Census & demographics
- County
- Waller County · 18,767 people
- City population
- 18,767
- Metro
- Houston-The Woodlands-Sugar Land, TX
- Population (ZIP)
- 18,767
- Household income
- $84,490
- Rent vs Own
- Severe rent burden
- 20.0
Population outlook (Waller County) Hauer SSP2
- Today (2025)
- 60,772 people
- By 2030
- 67,616 · +11.3%
- By 2040
- 82,283 · +35.4%
- By 2050
- 98,276 · +61.7%
- By 2075
- 142,860 · +135.1%
- By 2100
- 175,596 · +188.9%
Race, ethnicity, and origin ACS 2023
- Neighborhood character
- Diverse neighborhood (Simpson 0.64)
- Race & ethnicity
- Hispanic / Latino 41% White 41% Black 14% Two or more races 13% Asian 2% Native American 1%
- Hispanic origin (detail)
- Mexican 30% Cuban 2%
- Common ancestry
- Lithuanian 2% Italian 2% Slovak 1%
- Foreign-born
- 17% · Canada, China, Dominican Republic
- Languages at home
- 65% English-only · Spanish 32% French/Haitian/Cajun 1% Other Indo-European 1%
Political lean MEDSL · Waller
- 2024 margin
- Strong R (+25.0) · D 37.0% · R 62.0% · Other 1.0%
- 2008→2024 swing
- -17.9pp toward R · 2008: -7.2pp · 2024: -25.0pp
- All cycles
- 2024: R+25.0 2020: R+26.7 2016: R+28.6 2012: R+17.6 2008: R+7.2
Not yet ingested
- Civics
- —
Market trends
- HPI YoY
- ▼ -125.28%
- Current HPI
- 204.8709
- Rent YoY
- ▼ -1.01%
- Metro
- Houston-The Woodlands-Sugar Land, TX
- State GDP YoY
- ▲ 3.95%
- F500 in state
- 110
Industry mix (Fortune 500 HQ in TX)
| Industry | F500 HQs | Revenue |
|---|---|---|
| Energy | 16 | $1,198B |
|
||
| Technology | 5 | $198B |
|
||
| Engineering / Construction | 4 | $72B |
|
||
| Energy Services | 3 | $60B |
|
||
| Utilities | 3 | $41B |
|
||
| Healthcare | 2 | $330B |
|
||
Price history
-1.7% since first listed4 events — show timeline
- 2026-03-11 Price Changed $294,990 Zillow
- 2026-03-09 Price Changed $294,990 HARMLS
- 2026-01-21 Listed $299,990 HARMLS
- 2026-01-16 Listed $299,990 Zillow
Property tax history
+8.1%/yrLatest (2025): $1,077 · +8.1% YoY. Source: county tax records.
Cash-flow waterfall
monthlySold comps — $/sqft
last 12 mo · ≤1 miLoading sold comps…