 🌊 Lakefront
649 Ponderosa Dr · Onalaska, TX
Flood risk 1/10 · Minimal
- FEMA flood zone
- X (unshaded)
- Chance of flooding over 30 yrs
- 0.0%
- Est. flood insurance / yr
- $507 – $1,088
Fire risk 4/10 · Minor
- Est. fire insurance / yr
- $1,222 – $2,270
Heat risk 8/10 · Major
- Hot days now (above 111°F)
- 7 days/yr
- Hot days in 30 yrs
- 23 days/yr
Wind risk 8/10 · Major
- Chance of severe wind over 30 yrs
- 99.0%
Air-quality risk 1/10 · Minimal
- Unhealthy air days now
- 0 days/yr
- Unhealthy air days in 30 yrs
- 0 days/yr
Risk factors via First Street. Map © Google.
Why this score? — see what drove the B grade
The composite is a weighted blend of 9 inputs, each scored 0–100. Each bar is that input's sub-score; the figure is the points it added to the 100-point composite (weight × sub-score).
- Cash flow +30.0/30.0
- DSCR +10.0/10.0
- 1% rule +9.6/10.0
- ARV discount +7.5/15.0
- Appreciation +4.7/10.0
- Schools +4.1/10.0
- Livability +3.0/5.0
- Rent growth +2.5/5.0
- Condition / age +2.5/5.0
$79,900
🖨 Deal sheet (PDF) 📄 Offer letter ✓ Due diligence
Listing remarks
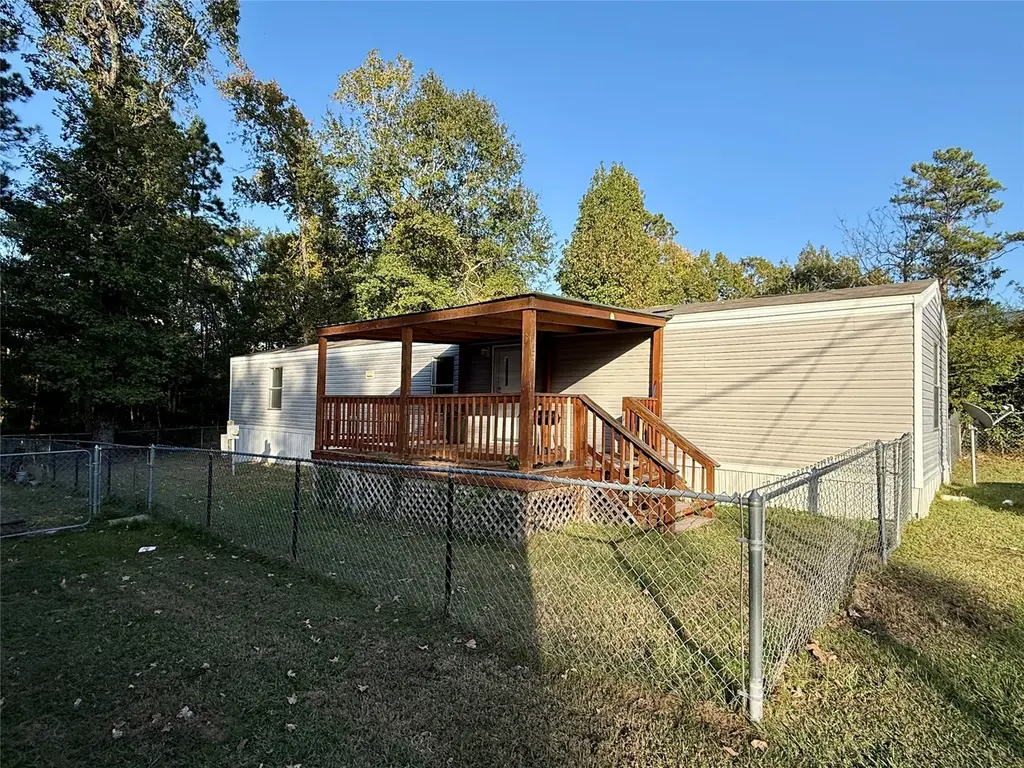
Enjoy lake access in this charming home located in a Lake Front Community near Lake Livingston. This MOVE IN READY property features 3 bedrooms, 2 baths, open concept living area, and a functional floor plan. With a fully fenced yard, covered front porch, and all appliances included, this home is perfect for easy living. Residents also have access to a community boat ramp and public utilities. Don't miss out on this opportunity, schedule your personal showing today.
Key facts
- Covered front porch
- Community boat ramp
- Lake access
Tags
Property features AI
Finance
- Other: Has additional parcel(s)
- HOA & community: Ponderosa Ridge POA; Annual association fee of $75 (covers common areas)
Exterior
- Parking: Additional parking available
- Utilities: Public water; Public sewer
- Home design: Residential property; Built in 2018; Block foundation; Composition roof
- Construction: Vinyl siding
- Exterior features: Fully fenced yard; Subdivision setting; Asphalt road access
Interior
- Kitchen: Dishwasher; Electric oven; Electric range
- Bedrooms: Three bedrooms total; Primary bedroom on the first floor (approx. 14 x 13); Bedroom on the first floor (approx. 14 x 11); Bedroom on the first floor (approx. 11 x 10)
- Flooring: Carpet; Vinyl
- Bathrooms: Two full bathrooms
- Heating & cooling: Central heating (electric); Central air conditioning (electric)
- Interior features: Kitchen and family room combined; Kitchen and dining area combined; Ceiling fans
- Laundry & utility: Washer hookup; Electric dryer hookup
Neighborhood map
What this means for you Summary
Snapshot
- This is a 3-bed/2.0-bath land listed at $80k.
Deal economics
- At list price, monthly cash flow is $365 ($4k/yr) — positive.
- The deal already cash-flows at list — no discount required.
- Meets the 1% rule at list price ($1k rent vs $80k).
- Recommended offer: $79k (1.5% below list) — sets the bar for market timing.
- Cap rate 11.8% vs local median 2.8% in Onalaska — top-decile yield for the area; either an underpriced asset or a hidden risk that comps aren't pricing in. Stress-test before assuming the spread holds.
Location & tenants
- Location reads 60/100 on livability (#1,055 in TX) — a middle-class / working-renter tenant base. Strengths: cost of living A+, housing A+; Watch: employment C-, crime D+, amenities F.
- Onalaska ISD (rural): math 50% / reading 48% proficiency, ranked #213 of 826 in TX (top 26%) — families likely to look elsewhere, expect single-tenant / working-renter base with shorter leases.
- Zoned schools: Onalaska El (math 52% / reading 42%, grade D-, #1,006 of 4,322 statewide, top 25%, 712 students, 70% FRL); Onalaska Jr/Sr High (math 48% / reading 55%, grade D+, #478 of 1,632 statewide, top 29%, 527 students, 58% FRL).
- Market conditions: 353 active listings in the ZIP; 2 comparable units currently listed for rent nearby; 769 units permitted in Polk County in 2024 (0 in 5+ unit buildings).
Forward outlook
- In year one you build about $66 of equity ($552 loan paydown + $-486 appreciation (-0.6% local appreciation)).
- Polk County population projected at +16% by 2050 — long-run rental-demand tailwind backs the buy-and-hold thesis.
- At projected returns (-0.6% appreciation + 3.0% rent growth), your $22k cash investment doubles in ~5 years — after that, you're playing with house money.
Negotiation context
- It's been on market 26 days — a 2% lower offer ($79k) is reasonable based on typical stale-listing flexibility.
- 3 sale attempts since 6y ago with the ask held roughly flat each time — persistent listings suggest the price (not the market) is what's stuck; bring a comps-based counter.
Risks & watch-outs
- Climate carrying-cost: severe wind risk, 99% chance of damaging wind over 30y; extreme-heat days projected 7→23/yr by 2055 (HVAC capex compounding) — expect insurance premiums to compound above CPI over the hold.
Questions for the listing agent
- What does the HOA fee cover, when was the last increase, and are there any pending special assessments or reserve-fund shortfalls?
- Is there a deadline driving the sale (1031 exchange, divorce, estate, relocation)? That informs how much negotiation room exists.
- Schools are D-rated, which usually means shorter tenancies and higher turnover. Who's the typical renter profile here, and what's been the actual vacancy rate?
- Crime grade is D in this area — have there been break-ins, vandalism, or insurance claims at this property in the last 3 years? What carrier currently insures it and at what premium?
- This sits on a lake — are riparian / water-frontage rights deeded with the parcel? Any dock permits, shoreline easements, or HOA water-use restrictions?
- What's the documented flood / surge / shoreline-erosion history here (FEMA AND non-FEMA — e.g., storm surge, creek backup, septic-field saturation)?
- Any water-quality or seasonal algae-bloom issues that affect tenant satisfaction or short-term-rental demand?
- What's the average days-on-market for RENTAL listings here right now (not sales)? A rising rental-DOM trend means longer vacancies and softer asking-rent achievability than the comps imply.
- What's the recent tenant-quality profile in this submarket — average credit score on applications, eviction rate, late-payment / NSF rate, and stable-employment percentage? A property-management company in the area should have these aggregated.
- How much new for-sale + rental construction is in the pipeline within 1–3 miles? Heavy new supply typically softens prices + rents 12–24 months out; constrained supply supports both.
Investment metrics
- 1% rule
- 1.46% ✓
- Cap rate
- 11.78%
- Cash-on-cash
- 19.59%
- DSCR
- 1.87
- GRM
- 5.7
CMA / ARV
No comps found within radius.
Projected returns pro-forma
-0.61% appreciation · 3.0% rent growth · sell at horizon
- IRR
- 17.9%
- Equity multiple
- 1.84×
- Total profit
- $18,688
- Equity at exit
- $20,799
- IRR
- 23.1%
- Equity multiple
- 3.43×
- Total profit
- $54,313
- Equity at exit
- $23,156
Cash invested: $22,372 (down + closing). Projections, not guarantees.
Landlord ↔ Tenant lean methodology
- Overall (STATE)
- 87 Strongly Landlord-Friendly
- State Texas
- 87 Strongly Landlord-Friendly · R+5
- County
- — inherits STATE
- City
- — inherits STATE
ZIP-level market 77360
- Home prices YoY
- -0.4%
- Active inventory
- 353
- Price-to-rent
- 5.7×
Monthly cashflow live
- Estimated rent
- $1,169 medium interval (Pro) →
- Mortgage (P&I)
- −$419
- Tax est. 1.5%
- −$100 /mo · $1,198/yr
- Insurance
- −$33
- HOA
- −$6
- Vacancy / Maint / Mgmt
- −$245
- Net cashflow
- $365
Break-even live
Sensitivity live
| Price | -10% $420 | -5% $393 | +0% $365 | +5% $338 | +10% $310 |
|---|---|---|---|---|---|
| Rent | -10% $273 | -5% $319 | +0% $365 | +5% $411 | +10% $458 |
| Rate | -1.0pp $405 | -0.5pp $386 | base $365 | +0.5pp $345 | +1.0pp $323 |
UW: 25.0% down · 7.5% · 30yr · 1.5% tax · 5.0% vac · 8.0% maint · 8.0% mgmt
Financing live
Cash to close
- Down payment
- $19,975
- Closing costs
- $2,397
- Reserves months
- —
- Total cash needed
- —
Loan-product check · same deal, 3 products live
Conventional
25% down · 7.5% · 30yr
- Down + closing
- —
- Monthly P&I
- —
- Monthly cashflow
- —
- DSCR
- —
- Eligible?
- —
Personal DTI + credit; lowest rate.
DSCR
20% down · 8.5% · 30yr
- Down + closing
- —
- Monthly P&I
- —
- Monthly cashflow
- —
- DSCR
- —
- Eligible?
- —
No personal income docs; deal must DSCR.
Hard money
10% down · 12.0% · 12mo
- Down + closing
- —
- Monthly P&I
- —
- Monthly cashflow
- —
- DSCR
- —
- Eligible?
- —
Short-term bridge; refi at stabilization.
Rent comps 2 comps
| Address | Beds | Baths | Sqft | Rent | $/sqft | DOM | Units | Dist |
|---|---|---|---|---|---|---|---|---|
| 132 Broken Arrow Onalaska, TX | 3.0 | 2.0 | 1000 | $1,400 | $1.40 | 45d | 1 | 1.24mi |
| 120 Farm to Market Road 356 Unit 4 Onalaska, TX | 2.0 | 1.0 | 754 | $875 | $1.16 | 45d | 1 | 1.39mi |
HOA detail
- Monthly dues
- $6 · $72/yr
Listing history 24 events
-
2026-06-21days on market $79,900 Active 26 DOM
-
2026-06-19days on market $79,900 Active 24 DOM
-
2026-06-18days on market $79,900 Active 23 DOM
-
2026-06-17days on market $79,900 Active 22 DOM
-
2026-06-16days on market $79,900 Active 21 DOM
-
2026-06-15days on market $79,900 Active 20 DOM
-
2026-06-14days on market $79,900 Active 18 DOM
-
2026-06-13days on market $79,900 Active 17 DOM
-
2026-06-10days on market $79,900 Active 15 DOM
-
2026-06-09days on market $79,900 Active 14 DOM
-
2026-06-08days on market $79,900 Active 13 DOM
-
2026-06-07days on market $79,900 Active 12 DOM
-
2026-06-05days on market $79,900 Active 9 DOM
-
2026-06-03days on market $79,900 Active 8 DOM
-
2026-06-02days on market $79,900 Active 7 DOM
-
2026-06-01days on market $79,900 Active 6 DOM
-
2026-05-31days on market $79,900 Active 5 DOM
-
2026-05-30days on market $79,900 Active 4 DOM
-
2026-05-17historical
-
2026-03-27price $89,900
-
2026-02-15price $94,900
-
2025-11-17$99,500 Active
-
2021-01-25historical
-
2020-11-25$79,900
ⓘ Source: listings_history table (triggers on properties + properties_extension) + one-shot
backfill from property_details.listing_events for pre-trigger history.
Climate risk First Street
- Flood 1/10 Low FEMA zone X (unshaded) · 0% chance over 30 yrs
- Wildfire 4/10 Moderate
- Heat 8/10 Severe 7 d/yr ≥111°F today · 23 d/yr by 30 yrs out
- Wind 8/10 Severe 99% chance of damaging wind over 30 yrs
- Air quality 1/10 Low 0 unhealthy d/yr today · 0 by 30 yrs out
Nearby sold comps map
Loading sold comps map…
Walkable amenities ~0.75 mi
Loading nearby amenities…
Taxation est. · year 1
- Rental income
- $14,026
- − Mortgage interest
- −$4,476
- − Property taxes
- −$1,198
- − Insurance
- −$400
- − Repairs & maintenance
- −$1,122
- − Management
- −$1,122
- − HOA
- −$72
- − Depreciation
- −$2,324
- Taxable income
- $3,312
- Est. tax owed @ 24.0%
- −$795
- After-tax cash flow
- $3,588/yr
For passive investors: Depreciation is non-cash, so a rental often shows a tax loss while cash-flowing — sheltering income. Rental losses are passive: they offset passive income freely, and up to $25,000/yr can offset ordinary (W-2) income if you actively participate and your MAGI is under $100k (phasing out to $0 by $150k); unused losses carry forward. On sale, claimed depreciation is recaptured at up to 25%, and gains may owe capital-gains tax (a 1031 exchange can defer both). Figures are a year-1 estimate at your 24.0% rate — not tax advice; consult a CPA.
Schools (NCES district)
- District
- Onalaska ISD
- NCES district ID
- 4833690
- Math proficiency
- 50% ▼ -10.00%
- Reading proficiency
- 48% ▼ -1.00%
- Median HH income
- $38,882
- Composite
- 40.91/100
- National rank
- #3616
- State rank
- #213 of 826 in TX
Livability — Onalaska
- Score
- 60/100
- State rank
- #1055
- US rank
- #18716
Category grades
Schools grade is shown separately in the Schools card above.
Census & demographics
- Census place
- Onalaska, TX
- Population (ZIP)
- 6,130
Population outlook (Polk County) Hauer SSP2
- Today (2025)
- 51,049 people
- By 2030
- 53,243 · +4.3%
- By 2040
- 56,528 · +10.7%
- By 2050
- 59,243 · +16.1%
- By 2075
- 63,528 · +24.4%
- By 2100
- 60,376 · +18.3%
Race, ethnicity, and origin ACS 2023
- Neighborhood character
- Predominantly White (86%)
- Race & ethnicity
- White 86% Two or more races 10% Hispanic / Latino 8%
- Hispanic origin (detail)
- Mexican 7%
- Common ancestry
- Lithuanian 4% Italian 2% Romanian 2%
- Foreign-born
- 1% · Canada
- Languages at home
- 95% English-only · Spanish 5%
Political lean MEDSL · Polk
- 2024 margin
- Solid R (+58.9) · D 20.2% · R 79.1%
- 2008→2024 swing
- -21.7pp toward R · 2008: -37.2pp · 2024: -58.9pp
- All cycles
- 2024: R+58.9 2020: R+54.5 2016: R+56.5 2012: R+48.2 2008: R+37.2
Not yet ingested
- Civics
- —
Market trends
- HPI YoY
- ▼ -0.61%
- Current HPI
- 150.9486
- Rent YoY
- —
- Metro
- —
- State GDP YoY
- ▲ 3.95%
- F500 in state
- 110
Industry mix (Fortune 500 HQ in TX)
| Industry | F500 HQs | Revenue |
|---|---|---|
| Energy | 16 | $1,198B |
|
||
| Technology | 5 | $198B |
|
||
| Engineering / Construction | 4 | $72B |
|
||
| Energy Services | 3 | $60B |
|
||
| Utilities | 3 | $41B |
|
||
| Healthcare | 2 | $330B |
|
||
Price history
+0.0% since first listed7 events — show timeline
- 2026-05-26 Listed $79,900 HARMLS
- 2026-05-17 Listing Removed — HARMLS
- 2026-03-27 Price Changed $89,900 HARMLS
- 2026-02-15 Price Changed $94,900 HARMLS
- 2025-11-17 Listed $99,500 HARMLS
- 2021-01-25 Listing Removed — HARMLS
- 2020-11-25 Listed $79,900 HARMLS
Property tax history
+6.3%/yrLatest (2025): $33 · +0.2% YoY. Source: county tax records.
Cash-flow waterfall
monthlySold comps — $/sqft
last 12 mo · ≤1 miLoading sold comps…