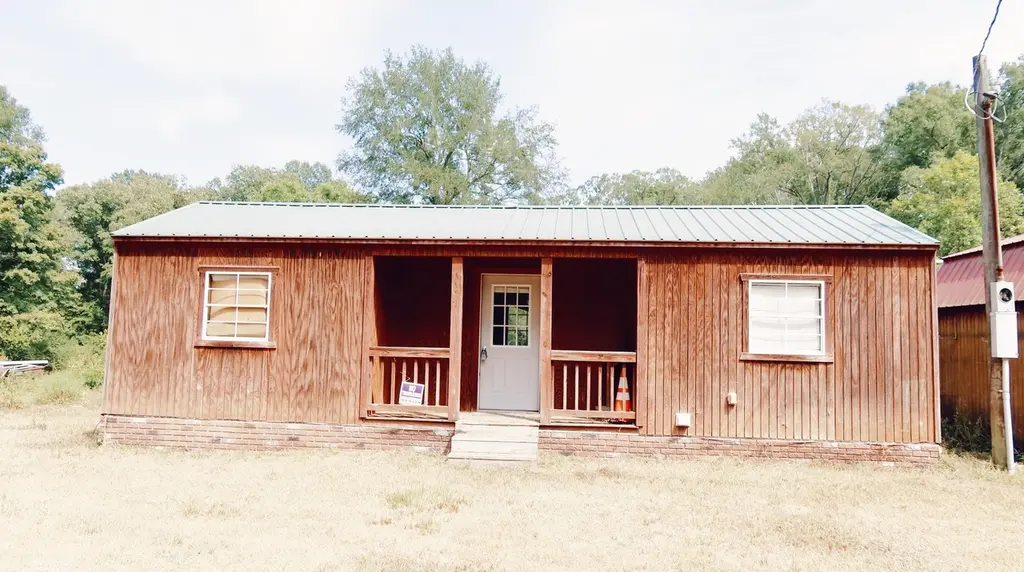
4935 Blocker Rd · Marshall, TX
Flood risk 8/10 · Major
- FEMA flood zone
- A
- Chance of flooding over 30 yrs
- 0.99%
- Est. flood insurance / yr
- $1,009 – $1,996
Fire risk 4/10 · Minor
- Est. fire insurance / yr
- $1,222 – $2,270
Heat risk 7/10 · Major
- Hot days now (above 111°F)
- 7 days/yr
- Hot days in 30 yrs
- 23 days/yr
Wind risk 6/10 · Moderate
- Chance of severe wind over 30 yrs
- 59.0%
Air-quality risk 2/10 · Minimal
- Unhealthy air days now
- 1 days/yr
- Unhealthy air days in 30 yrs
- 1 days/yr
Risk factors via First Street. Map © Google.
Why this score? — see what drove the B grade
The composite is a weighted blend of 9 inputs, each scored 0–100. Each bar is that input's sub-score; the figure is the points it added to the 100-point composite (weight × sub-score).
- Cash flow +30.0/30.0
- DSCR +10.0/10.0
- 1% rule +9.3/10.0
- ARV discount +7.5/15.0
- Appreciation +5.0/10.0
- Schools +4.5/10.0
- Livability +3.4/5.0
- Rent growth +2.5/5.0
- Condition / age +1.0/5.0
$55,000
🖨 Deal sheet 📄 Offer letter ✓ Due diligence
Listing remarks MLS
Looking to downsize or want an investment property? Look no further! This 1 bed/1 bath efficiency comes with a small kitchen and includes washer/dryer hookups. It sits on 1 acre, is mostly fenced, has a creek and comes with a storage building as well as a covered shed. It is being sold "AS-IS" and is priced to sell at only $55,000!
Key facts
- Covered shed
- Storage building
- Washer dryer hookups
Tags
Neighborhood map
What this means for you Summary
Snapshot
- This is a 1-bed/1.0-bath single-family listed at $55k. Condition is rated poor.
Deal economics
- At list price, monthly cash flow is $117 ($1k/yr) — positive.
- The deal already cash-flows at list — no discount required.
- Meets the 1% rule at list price ($787 rent vs $55k).
- Recommended offer: $48k (12.0% below list) — sets the bar for market timing.
Location & tenants
- Location reads 68/100 on livability (#451 in TX) — a middle-class / working-renter tenant base. Strengths: cost of living A+, housing A+; Watch: schools F, amenities F, commute F.
- Elysian Fields ISD (rural): math 52% / reading 54% proficiency, ranked #136 of 826 in TX (top 16%) — acceptable for families but not a draw, mixed tenant base, ~2y average lease.
- Market conditions: 13 active listings in the ZIP; 85 units permitted in Harrison County in 2024 (15 in 5+ unit buildings).
Forward outlook
- In year one you build about $2k of equity ($380 loan paydown + $2k appreciation (3.0% local appreciation)).
- At projected returns (3.0% appreciation + 3.0% rent growth), your $15k cash investment doubles in ~5 years — after that, you're playing with house money.
Negotiation context
- It's been on market 239 days — a 12% lower offer ($48k) is reasonable based on typical stale-listing flexibility.
- 4 sale attempts since 2y ago; this cycle's ask has dropped $8k (12%) from the opening price — seller is motivated, your offer sets the floor, not the list.
Risks & watch-outs
- Watch-outs: flood insurance adds $125/mo.
- Climate carrying-cost: in FEMA flood zone A (mandatory federal flood insurance); major wind risk, 59% chance of damaging wind over 30y; extreme-heat days projected 7→23/yr by 2055 (HVAC capex compounding) — expect insurance premiums to compound above CPI over the hold.
Questions for the listing agent
- It's been on market 239 days. Have you received any prior offers? Is the seller open to a 12% concession, seller financing, or rate buy-down credit?
- Have any recent inspections been done? Can we get a copy of the seller's disclosures and any deferred-maintenance estimates?
- What's the actual annual flood-insurance premium (NFIP or private), and is the property in a SFHA with mandatory coverage?
- Why hasn't it sold? Are there any deal-killer items the seller is aware of (foundation, flood, title, zoning, code violations)?
- Is there a deadline driving the sale (1031 exchange, divorce, estate, relocation)? That informs how much negotiation room exists.
- Schools are F-rated, which usually means shorter tenancies and higher turnover. Who's the typical renter profile here, and what's been the actual vacancy rate?
- What's the average days-on-market for RENTAL listings here right now (not sales)? A rising rental-DOM trend means longer vacancies and softer asking-rent achievability than the comps imply.
- What's the recent tenant-quality profile in this submarket — average credit score on applications, eviction rate, late-payment / NSF rate, and stable-employment percentage? A property-management company in the area should have these aggregated.
- How much new for-sale + rental construction is in the pipeline within 1–3 miles? Heavy new supply typically softens prices + rents 12–24 months out; constrained supply supports both.
Investment metrics
- 1% rule
- 1.43% ✓
- Cap rate
- 11.57%
- Cash-on-cash
- 18.84%
- DSCR
- 1.84
- GRM
- 5.8
CMA / ARV
No comps found within radius.
Projected returns pro-forma
3.0% appreciation · 3.0% rent growth · sell at horizon
- IRR
- 16.1%
- Equity multiple
- 1.92×
- Total profit
- $14,137
- Equity at exit
- $24,730
- IRR
- 17.7%
- Equity multiple
- 3.60×
- Total profit
- $40,055
- Equity at exit
- $38,112
Cash invested: $15,400 (down + closing). Projections, not guarantees.
Landlord ↔ Tenant lean methodology
- Overall (STATE)
- 87 Strongly Landlord-Friendly
- State Texas
- 87 Strongly Landlord-Friendly · R+5
- County
- — inherits STATE
- City
- — inherits STATE
ZIP-level market 75642
- Active inventory
- 13
- Price-to-rent
- 5.8×
Monthly cashflow live
- Estimated rent
- $787 medium interval (Pro) →
- Mortgage (P&I)
- −$288
- Tax est. 1.5%
- −$69 /mo · $825/yr
- Insurance
- −$23
- Flood insurance flood zone
- −$125 /mo · $1,502/yr
- HOA
- −$0
- Vacancy / Maint / Mgmt
- −$165
- Net cashflow
- $117
Break-even live
UW: 25.0% down · 7.5% · 30yr · 1.5% tax · 5.0% vac · 8.0% maint · 8.0% mgmt
Financing live
Cash to close
- Down payment
- $13,750
- Closing costs
- $1,650
- Reserves months
- —
- Total cash needed
- —
Loan-product check · same deal, 3 products live
Conventional
25% down · 7.5% · 30yr
- Down + closing
- —
- Monthly P&I
- —
- Monthly cashflow
- —
- DSCR
- —
- Eligible?
- —
Personal DTI + credit; lowest rate.
DSCR
20% down · 8.5% · 30yr
- Down + closing
- —
- Monthly P&I
- —
- Monthly cashflow
- —
- DSCR
- —
- Eligible?
- —
No personal income docs; deal must DSCR.
Hard money
10% down · 12.0% · 12mo
- Down + closing
- —
- Monthly P&I
- —
- Monthly cashflow
- —
- DSCR
- —
- Eligible?
- —
Short-term bridge; refi at stabilization.
Listing history 20 events
-
2026-06-18days on market $55,000 Active 239 DOM
-
2026-06-17days on market $55,000 Active 238 DOM
-
2026-06-16days on market $55,000 Active 237 DOM
-
2026-06-15days on market $55,000 Active 236 DOM
-
2026-06-13days on market $55,000 Active 234 DOM
-
2026-06-12days on market $55,000 Active 233 DOM
-
2026-06-09days on market $55,000 Active 230 DOM
-
2026-06-08days on market $55,000 Active 229 DOM
-
2026-06-08days on market $55,000 Active 228 DOM
-
2026-06-07days on market $55,000 Active 227 DOM
-
2026-06-03days on market $55,000 Active 224 DOM
-
2026-06-02days on market $55,000 Active 223 DOM
-
2026-06-01days on market $55,000 Active 222 DOM
-
2026-05-31days on market $55,000 Active 221 DOM
-
2026-04-03status Active 343-char remark
Show marketing remark (343 chars)
Looking to downsize or want an investment property? Look no further! This 1 bed/1 bath efficiency comes with a small kitchen and includes washer/dryer hookups. It sits on 1 acre, is mostly fenced, has a creek and comes with a storage building as well as a covered shed. It is being sold "AS-IS" and is priced to sell at only $55,000!
-
2026-04-03price $55,000 343-char remark
Show marketing remark (343 chars)
Looking to downsize or want an investment property? Look no further! This 1 bed/1 bath efficiency comes with a small kitchen and includes washer/dryer hookups. It sits on 1 acre, is mostly fenced, has a creek and comes with a storage building as well as a covered shed. It is being sold "AS-IS" and is priced to sell at only $55,000!
-
2025-09-10$62,500 Active 343-char remark
Show marketing remark (343 chars)
Looking to downsize or want an investment property? Look no further! This 1 bed/1 bath efficiency comes with a small kitchen and includes washer/dryer hookups. It sits on 1 acre, is mostly fenced, has a creek and comes with a storage building as well as a covered shed. It is being sold "AS-IS" and is priced to sell at only $55,000!
-
2025-04-09status Pending
-
2025-01-24$59,900 Active
-
2024-06-06$59,900 Active
ⓘ Source: listings_history table (triggers on properties + properties_extension) + one-shot
backfill from property_details.listing_events for pre-trigger history.
Climate risk First Street
- Flood 8/10 Severe FEMA zone A · 99% chance over 30 yrs
- Wildfire 4/10 Moderate
- Heat 7/10 Severe 7 d/yr ≥111°F today · 23 d/yr by 30 yrs out
- Wind 6/10 Major 59% chance of damaging wind over 30 yrs
- Air quality 2/10 Low 1 unhealthy d/yr today · 1 by 30 yrs out
Nearby sold comps map
Loading sold comps map…
Walkable amenities ~0.75 mi
Loading nearby amenities…
Taxation est. · year 1
- Rental income
- $9,446
- − Mortgage interest
- −$3,081
- − Property taxes
- −$825
- − Insurance
- −$1,778
- − Repairs & maintenance
- −$756
- − Management
- −$756
- − Depreciation
- −$1,600
- Taxable income
- $651
- Est. tax owed @ 24.0%
- −$156
- After-tax cash flow
- $1,242/yr
For passive investors: Depreciation is non-cash, so a rental often shows a tax loss while cash-flowing — sheltering income. Rental losses are passive: they offset passive income freely, and up to $25,000/yr can offset ordinary (W-2) income if you actively participate and your MAGI is under $100k (phasing out to $0 by $150k); unused losses carry forward. On sale, claimed depreciation is recaptured at up to 25%, and gains may owe capital-gains tax (a 1031 exchange can defer both). Figures are a year-1 estimate at your 24.0% rate — not tax advice; consult a CPA.
Condition & rehab AI · 9 photos
This property requires extensive repairs and renovations to become move-in ready. Immediate attention is needed to address structural and safety issues.
Repairs flagged
- Major Exposed framing — Structural integrity compromised
- Major Exposed drywall — Safety hazard
- Major Exposed ductwork — Ventilation system compromised
Value-add opportunities
- Resale Complete kitchen cabinets and countertops — Enhances functionality and aesthetic appeal
- Resale Complete bathroom fixtures and cabinet doors — Enhances functionality and aesthetic appeal
- Resale Replace siding and roof — Improves structural integrity and appearance
- Resale Paint interior and exterior — Enhances aesthetic appeal
- Both Landscaping and curb appeal — Enhances property value and curb appeal
Renovation cost estimate screening
| Repair item | Severity | Est. cost |
|---|---|---|
| Exposed framing · Structural integrity compromised | Major | $15,000–50,000 |
| Exposed drywall · Safety hazard | Major | $15,000–50,000 |
| Exposed ductwork · Ventilation system compromised | Major | $15,000–50,000 |
| Total estimated repair cost · 3 items | $45,000–150,000 |
Value-add ROI direction
- Resale Complete kitchen cabinets and countertops — Enhances functionality and aesthetic appeal ↑
- Resale Complete bathroom fixtures and cabinet doors — Enhances functionality and aesthetic appeal ↑
- Resale Replace siding and roof — Improves structural integrity and appearance ↑
- Resale Paint interior and exterior — Enhances aesthetic appeal ↑
- Both Landscaping and curb appeal — Enhances property value and curb appeal ↑
ⓘ Cost ranges are severity-bucket heuristics (US national rule-of-thumb). Get contractor quotes + a written scope before underwriting a rehab budget.
Schools (NCES district)
- District
- Elysian Fields ISD
- NCES district ID
- 4818480
- Math proficiency
- 52% ▼ -3.00%
- Reading proficiency
- 54% ▲ 2.00%
- Median HH income
- $48,512
- Composite
- 45.13/100
- National rank
- #2684
- State rank
- #136 of 826 in TX
Livability — Marshall
- Score
- 68/100
- State rank
- #451
- US rank
- #9156
Category grades
Schools grade is shown separately in the Schools card above.
Census & demographics
- City population
- 18,670
- Population (ZIP)
- 50
Population outlook (Harrison County) Hauer SSP2
- Today (2025)
- 68,691 people
- By 2030
- 69,317 · +0.9%
- By 2040
- 69,973 · +1.9%
- By 2050
- 70,090 · +2.0%
- By 2075
- 70,607 · +2.8%
- By 2100
- 67,546 · -1.7%
Race, ethnicity, and origin ACS 2023
- Neighborhood character
- Predominantly White (100%)
- Race & ethnicity
- White 100%
Political lean MEDSL · Harrison
- 2024 margin
- Solid R (+50.6) · D 24.4% · R 75.0%
- 2008→2024 swing
- -19.2pp toward R · 2008: -31.4pp · 2024: -50.6pp
- All cycles
- 2024: R+50.6 2020: R+45.6 2016: R+43.9 2012: R+34.6 2008: R+31.4
Not yet ingested
- Civics
- —
Market trends
- HPI YoY
- —
- Current HPI
- —
- Rent YoY
- —
- Metro
- —
- State GDP YoY
- ▲ 3.95%
- F500 in state
- 110
Industry mix (Fortune 500 HQ in TX)
| Industry | F500 HQs | Revenue |
|---|---|---|
| Energy | 16 | $1,198B |
|
||
| Technology | 5 | $198B |
|
||
| Engineering / Construction | 4 | $72B |
|
||
| Energy Services | 3 | $60B |
|
||
| Utilities | 3 | $41B |
|
||
| Healthcare | 2 | $330B |
|
||
Price history
-8.2% since first listed6 events — show timeline
- 2026-04-03 Relisted — LAAR
- 2026-04-03 Price Changed $55,000 LAAR
- 2025-09-10 Listed $62,500 LAAR
- 2025-04-09 Pending — LAAR
- 2025-01-24 Listed $59,900 LAAR
- 2024-06-06 Listed $59,900 LAAR
Cash-flow waterfall
monthlySold comps — $/sqft
last 12 mo · ≤1 miLoading sold comps…