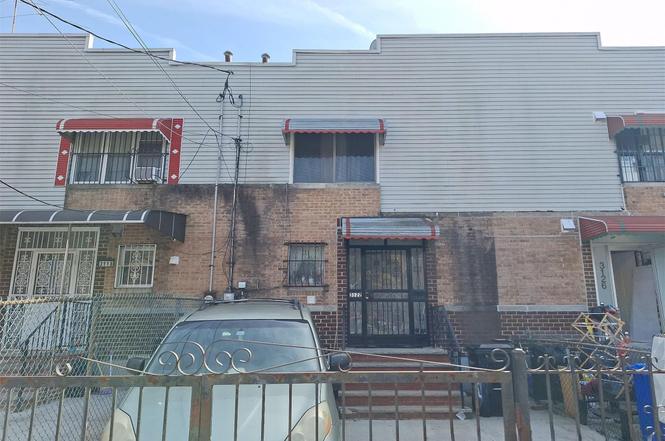
31-22 Neptune Ave · New York, NY
Flood risk 7/10 · Major
- FEMA flood zone
- AE
- Chance of flooding over 30 yrs
- 0.96%
- Est. flood insurance / yr
- $1,737 – $8,500
Fire risk 1/10 · Minimal
- Est. fire insurance / yr
- $691 – $1,283
Heat risk 7/10 · Major
- Hot days now (above 97°F)
- 7 days/yr
- Hot days in 30 yrs
- 15 days/yr
Wind risk 6/10 · Moderate
- Chance of severe wind over 30 yrs
- 69.0%
Air-quality risk 4/10 · Minor
- Unhealthy air days now
- 5 days/yr
- Unhealthy air days in 30 yrs
- 7 days/yr
Risk factors via First Street. Map © Google.
Why this score? — see what drove the D+ grade
The composite is a weighted blend of 9 inputs, each scored 0–100. Each bar is that input's sub-score; the figure is the points it added to the 100-point composite (weight × sub-score).
- ARV discount +11.8/15.0
- Cash flow +10.0/30.0
- Appreciation +7.5/10.0
- Schools +5.0/10.0
- Rent growth +4.3/5.0
- Livability +3.8/5.0
- DSCR +2.8/10.0
- Condition / age +2.5/5.0
- 1% rule +2.2/10.0
$670,000
🖨 Deal sheet (PDF) 📄 Offer letter ✓ Due diligence
Listing remarks MLS
Colonial Style Home. This Home Features 3 Bedrooms, 2 Full Baths, Formal Dining Room, & Eat In Kitchen. Centrally Located To All. Don't Miss This Opportunity!
Key facts
- 1,827 sq ft lot
- Built 1985
- Listed 249 days
Property features AI
Exterior
- Parking: Driveway; No carport
- Utilities: Sewer: Other; Utilities: See remarks
- Home design: Single family residence; Two-story
- Construction: Frame construction
- Exterior features: Frame construction; Not waterfront
Interior
- Kitchen: No appliances listed
- Bedrooms: Bedrooms located across two levels
- Bathrooms: Two full bathrooms
- Heating & cooling: Hot water heating; Natural gas heating; No cooling
- Interior features: First-floor full bathroom; Formal dining room; Two levels; Six total rooms; No basement; No attic
- Laundry & utility: No laundry appliances listed
Neighborhood map
What this means for you Summary
Snapshot
- This is a 3-bed/2.0-bath single-family listed at $670k.
Deal economics
- At list price, monthly cash flow is $-832 ($-10k/yr) — negative.
- To cash-flow at today's rent, offer at most $523k (21.9% below list).
- To meet the 1% rule (rent ≥ 1% of price), the offer needs to be $480k (28.4% below list).
- Recommended offer: $480k (28.4% below list) — sets the bar for 1% rule.
- Cap rate 5.6% vs local median 2.6% in New York — top-decile yield for the area; either an underpriced asset or a hidden risk that comps aren't pricing in. Stress-test before assuming the spread holds.
Location & tenants
- Location reads 75/100 on livability (#268 in NY, #4,188 nationally) — a middle-class / working-renter tenant base. Strengths: amenities A+, commute A+, health & safety A; Watch: crime F, cost of living F.
- Zoned schools: Ps 225 Eileen E Zaglin (The) (math 57% / reading 52%, grade C, #908 of 2,108 statewide, top 46%, 963 students, 84% FRL); Is 98 Bay Academy (math 96% / reading 96%, grade A+, #2 of 729 statewide, top 0%, 1,488 students, 63% FRL); Midwood High School (math 94% / reading 96%, grade A+, #83 of 1,100 statewide, top 8%, 4,062 students, 73% FRL).
- Market conditions: Rents rising fast (+7.0%/yr); 114 active listings in the ZIP; 5 comparable units currently listed for rent nearby; rentals at typical pace (median 21d on market — plan ~3-4 weeks tenant-placement turnaround); lower-income renter base — watch delinquency; 10,063 units permitted in Kings County in 2024 (9,789 in 5+ unit buildings).
- At $4,796/mo this rent would consume 132% of the median local household income ($44k/yr) (locally 4426% of renters already pay >50% of income on rent) — very limited rent-growth headroom before tenants either downsize or default.
Forward outlook
- In year one you build about $38k of equity ($5k loan paydown + $33k appreciation (5.0% local appreciation)).
- Kings County population projected at +13% by 2050 — modest demand growth; plan on rents tracking national, not racing it.
- By year 2, paydown + projected appreciation supports a ~$61k cash-out refi (75% LTV) — recoverable capital for the next deal without selling this one.
Negotiation context
- It's been on market 249 days — a 12% lower offer ($590k) is reasonable based on typical stale-listing flexibility.
- 2 sale attempts with the ask held roughly flat each time — persistent listings suggest the price (not the market) is what's stuck; bring a comps-based counter.
Risks & watch-outs
- Watch-outs: flood insurance adds $427/mo.
- Climate carrying-cost: in FEMA flood zone AE (mandatory federal flood insurance); major wind risk, 69% chance of damaging wind over 30y; extreme-heat days projected 7→15/yr by 2055 (HVAC capex compounding) — expect insurance premiums to compound above CPI over the hold.
Questions for the listing agent
- What do current leases actually rent for vs. the listed asking? Can we see a recent rent roll and the last 12 months of T-12 income?
- It's been on market 249 days. Have you received any prior offers? Is the seller open to a 28% concession, seller financing, or rate buy-down credit?
- What's the actual annual flood-insurance premium (NFIP or private), and is the property in a SFHA with mandatory coverage?
- Why hasn't it sold? Are there any deal-killer items the seller is aware of (foundation, flood, title, zoning, code violations)?
- Is there a deadline driving the sale (1031 exchange, divorce, estate, relocation)? That informs how much negotiation room exists.
- Schools are B-rated — typically a magnet for longer-tenancy family renters. What's the average tenant stay here, and is there a school-zone premium baked into asking?
- Crime grade is F in this area — have there been break-ins, vandalism, or insurance claims at this property in the last 3 years? What carrier currently insures it and at what premium?
- The area grade is low — what's the realistic commute time and amenity access for the typical tenant pool here? Any planned neighborhood developments (good or bad) we should know about?
- What's the average days-on-market for RENTAL listings here right now (not sales)? A rising rental-DOM trend means longer vacancies and softer asking-rent achievability than the comps imply.
- What's the recent tenant-quality profile in this submarket — average credit score on applications, eviction rate, late-payment / NSF rate, and stable-employment percentage? A property-management company in the area should have these aggregated.
- How much new for-sale + rental construction is in the pipeline within 1–3 miles? Heavy new supply typically softens prices + rents 12–24 months out; constrained supply supports both.
Investment metrics
- 1% rule
- 0.72% ✗
- Cap rate
- 5.57%
- Cash-on-cash
- -2.59%
- DSCR
- 0.88
- GRM
- 11.6
CMA / ARV
- ARV (on-the-fly)
- $740,240
- Comps found
- 12
Show comp detail 12 sales within ~0.75 mi
| Address | Dist | Beds/Ba | Sqft | Sold | Price | $/sf | Match |
|---|---|---|---|---|---|---|---|
| 3114 Neptune Ave | 0.01mi | 3/2.0 | 1,520 (0%) | 10mo | $585,000 | $385 | 92 |
| 2878 We 31 St | 0.13mi | 3/2.0 | 1,520 (0%) | 9mo | $670,000 | $441 | 86 |
| 2842 W 27th St | 0.24mi | 3/1.5 | 1,460 (-4%) | 1mo | $735,000 | $503 | 79 |
| 3215 Mermaid Ave | 0.14mi | 3/2.0 | 1,680 (+10%) | 7mo | $703,000 | $418 | 70 |
| 2858 W 35th St | 0.17mi | 3/2.0 | 1,445 (-5%) | 17mo | $703,000 | $487 | 70 |
| 2836 W 29th St | 0.13mi | 3/1.5 | 1,344 (-12%) | 3mo | $653,900 | $487 | 70 |
| 2813 W 30th St | 0.11mi | 3/1.5 | 1,344 (-12%) | 7mo | $665,000 | $495 | 68 |
| 3912 Lyme Ave | 0.53mi | 3/1.5 | 1,621 (+7%) | 1mo | $870,000 | $537 | 61 |
| 3226 Mermaid Ave | 0.17mi | 3/2.5 | 1,680 (+10%) | 16mo | $655,000 | $390 | 59 |
| 2885 W 23rd St | 0.46mi | 3/1.5 | 1,356 (-11%) | 0mo | $683,000 | $504 | 58 |
| 2868 W 25th St | 0.31mi | 3/1.5 | 1,344 (-12%) | 10mo | $658,000 | $490 | 56 |
| 4469 Surf Ave | 0.54mi | 3/1.5 | 1,360 (-10%) | 14mo | $500,000 | $368 | 44 |
Match score weights: distance 35% · size 25% · config 20% · recency 20%. Top-matched comps best support the ARV.
Projected returns pro-forma
4.98% appreciation · 7.03% rent growth · sell at horizon
- IRR
- 9.9%
- Equity multiple
- 1.65×
- Total profit
- $121,061
- Equity at exit
- $378,948
- IRR
- 12.8%
- Equity multiple
- 3.45×
- Total profit
- $459,045
- Equity at exit
- $653,407
Cash invested: $187,600 (down + closing). Projections, not guarantees.
Landlord ↔ Tenant lean methodology
- Overall (CITY)
- 0 Strongly Tenant-Friendly
- State New York
- 15 Strongly Tenant-Friendly · D+10
- County
- — inherits STATE
- City New York
- 0 Strongly Tenant-Friendly · D+34
ZIP-level market 11224
- Home prices YoY
- 1.0%
- Rents YoY
- 7.0%
- Active inventory
- 114
- Price-to-rent
- 11.6×
Monthly cashflow live
- Estimated rent
- $4,796 high interval (Pro) →
- Mortgage (P&I)
- −$3,514
- Tax from tax record
- −$401 /mo · $4,818/yr
- Insurance
- −$279
- Flood insurance flood zone
- −$427 /mo · $5,118/yr
- HOA
- −$0
- Vacancy / Maint / Mgmt
- −$1,007
- Net cashflow
- $-832
Break-even live
Sensitivity live
| Price | -10% $-453 | -5% $-642 | +0% $-832 | +5% $-1,021 | +10% $-1,211 |
|---|---|---|---|---|---|
| Rent | -10% $-1,211 | -5% $-1,021 | +0% $-832 | +5% $-642 | +10% $-453 |
| Rate | -1.0pp $-494 | -0.5pp $-661 | base $-832 | +0.5pp $-1,005 | +1.0pp $-1,182 |
UW: 25.0% down · 7.5% · 30yr · 1.5% tax · 5.0% vac · 8.0% maint · 8.0% mgmt
Financing live
Cash to close
- Down payment
- $167,500
- Closing costs
- $20,100
- Reserves months
- —
- Total cash needed
- —
Loan-product check · same deal, 3 products live
Conventional
25% down · 7.5% · 30yr
- Down + closing
- —
- Monthly P&I
- —
- Monthly cashflow
- —
- DSCR
- —
- Eligible?
- —
Personal DTI + credit; lowest rate.
DSCR
20% down · 8.5% · 30yr
- Down + closing
- —
- Monthly P&I
- —
- Monthly cashflow
- —
- DSCR
- —
- Eligible?
- —
No personal income docs; deal must DSCR.
Hard money
10% down · 12.0% · 12mo
- Down + closing
- —
- Monthly P&I
- —
- Monthly cashflow
- —
- DSCR
- —
- Eligible?
- —
Short-term bridge; refi at stabilization.
Rent comps 5 comps
| Address | Beds | Baths | Sqft | Rent | $/sqft | DOM | Units | Dist |
|---|---|---|---|---|---|---|---|---|
| 2971 Shell Rd Unit 602 Brooklyn, NY | 3.0 | 2.0 | 1301 | $5,299 | $4.07 | 26d | 1 | 1.20mi |
| 2957 Shell Rd Brooklyn, NY | 3.0 | 2.0 | 1292 | $5,550 | $4.30 | 26d | 1 | 1.20mi |
| 532 Neptune Ave Brooklyn, NY | 1.0–3.0 | 1.0–2.0 | 948 | $5,725 | $6.04 | 1d | 8 | 1.25mi |
| 187 Bay 31st St #1 Brooklyn, NY | 3.0 | 3.0 | 1800 | $5,200 | $2.89 | 21d | 1 | 1.42mi |
| 8642 26th Ave Unit 3 Brooklyn, NY | 3.0 | 1.0 | 1100 | $3,100 | $2.82 | 17d | 1 | 1.44mi |
Listing history 12 events
-
2026-06-21days on market $670,000 Active 249 DOM
-
2026-06-18days on market $670,000 Active 246 DOM
-
2026-06-17days on market $670,000 Active 245 DOM
-
2026-06-15days on market $670,000 Active 243 DOM
-
2026-06-13days on market $670,000 Active 241 DOM
-
2026-06-10days on market $670,000 Active 237 DOM
-
2026-06-08days on market $670,000 Active 236 DOM
-
2026-06-03days on market $670,000 Active 231 DOM
-
2026-06-01days on market $670,000 Active 229 DOM
-
2026-05-31days on market $670,000 Active 228 DOM
-
2025-10-15$670,000 Active
Show marketing remark (163 chars)
Colonial Style Home. This Home Features 3 Bedrooms, 2 Full Baths, Formal Dining Room, & Eat In Kitchen. Centrally Located To All. Don't Miss This Opportunity!
-
2025-10-15$670,000 Active 163-char remark
Show marketing remark (163 chars)
Colonial Style Home. This Home Features 3 Bedrooms, 2 Full Baths, Formal Dining Room, & Eat In Kitchen. Centrally Located To All. Don't Miss This Opportunity!
ⓘ Source: listings_history table (triggers on properties + properties_extension) + one-shot
backfill from property_details.listing_events for pre-trigger history.
Tax reassessment forecast NY · Partial reset (capped growth)
- Current annual tax
- $4,818 · $401/mo
- Projected year-2 tax
- $8,070 · $673/mo
- Expected delta
- +$3,253/yr (+$271/mo · 67.5%)
ⓘ Screening estimate from a state-policy table — verify with the county assessor before closing.
Climate risk First Street
- Flood 7/10 Severe FEMA zone AE · 96% chance over 30 yrs
- Wildfire 1/10 Low
- Heat 7/10 Severe 7 d/yr ≥97°F today · 15 d/yr by 30 yrs out
- Wind 6/10 Major 69% chance of damaging wind over 30 yrs
- Air quality 4/10 Moderate 5 unhealthy d/yr today · 7 by 30 yrs out
Nearby sold comps map
Loading sold comps map…
Walkable amenities ~0.75 mi
Loading nearby amenities…
Taxation est. · year 1
- Rental income
- $57,553
- − Mortgage interest
- −$37,530
- − Property taxes
- −$4,818
- − Insurance
- −$8,468
- − Repairs & maintenance
- −$4,604
- − Management
- −$4,604
- − Depreciation
- −$19,491
- Taxable loss
- −$21,962
- Est. tax savings @ 24.0%
- +$5,271
- After-tax cash flow
- $-4,710/yr
For passive investors: Depreciation is non-cash, so a rental often shows a tax loss while cash-flowing — sheltering income. Rental losses are passive: they offset passive income freely, and up to $25,000/yr can offset ordinary (W-2) income if you actively participate and your MAGI is under $100k (phasing out to $0 by $150k); unused losses carry forward. On sale, claimed depreciation is recaptured at up to 25%, and gains may owe capital-gains tax (a 1031 exchange can defer both). Figures are a year-1 estimate at your 24.0% rate — not tax advice; consult a CPA.
Schools (NCES district)
No district data.
Livability — New York
- Score
- 75/100
- State rank
- #268
- US rank
- #4188
Category grades
Schools grade is shown separately in the Schools card above.
Census & demographics
- Census place
- New York, NY
- County
- Kings County · 2,614,986 people
- City population
- 7,731,280
- Metro
- New York-Newark-Jersey City, NY-NJ-PA
- Population (ZIP)
- 50,822
- Household income
- $43,648
- Rent vs Own
- Severe rent burden
- 4426.0
Population outlook (Kings County) Hauer SSP2
- Today (2025)
- 2,847,441 people
- By 2030
- 2,937,006 · +3.1%
- By 2040
- 3,095,491 · +8.7%
- By 2050
- 3,228,968 · +13.4%
- By 2075
- 3,321,723 · +16.7%
- By 2100
- 3,111,387 · +9.3%
Race, ethnicity, and origin ACS 2023
- Neighborhood character
- Diverse neighborhood (Simpson 0.68)
- Race & ethnicity
- White 48% Black 22% Hispanic / Latino 19% Asian 8% Two or more races 7%
- Hispanic origin (detail)
- Mexican 5% Puerto Rican 8% Dominican 2%
- Common ancestry
- Scotch-Irish 10% Subsaharan African 7% Romanian 1%
- Foreign-born
- 48% · Canada, China
- Languages at home
- 42% English-only · Russian/Polish/Slavic 32% Spanish 11% Chinese 5%
Political lean MEDSL · Kings
- 2024 margin
- Solid D (+44.0) · D 72.0% · R 28.0%
- 2008→2024 swing
- -15.5pp toward R · 2008: 59.4pp · 2024: 44.0pp
- All cycles
- 2024: D+44.0 2020: D+54.8 2016: D+61.8 2012: D+63.9 2008: D+59.4
Not yet ingested
- Civics
- —
Market trends
- HPI YoY
- ▲ 4.98%
- Current HPI
- 505.1405
- Rent YoY
- ▲ 7.03%
- Metro
- New York-Newark-Jersey City, NY-NJ-PA
- State GDP YoY
- ▲ 2.60%
- F500 in state
- 92
Industry mix (Fortune 500 HQ in NY)
| Industry | F500 HQs | Revenue |
|---|---|---|
| Financial Services | 10 | $950B |
|
||
| Consumer Goods | 9 | $162B |
|
||
| Insurance | 4 | $225B |
|
||
| Telecommunications | 2 | $144B |
|
||
| Pharmaceuticals | 2 | $112B |
|
||
| Media / Entertainment | 2 | $69B |
|
||
Price history
+0.0% since first listed2 events — show timeline
- 2025-10-15 Listed $670,000 OneKey® MLS as Distributed by MLS Grid
- 2025-10-15 Listed $670,000 RLS at REBNY
Property tax history
+5.8%/yrLatest (2025): $4,818 · +3.4% YoY. Source: county tax records.
Cash-flow waterfall
monthlySold comps — $/sqft
last 12 mo · ≤1 miLoading sold comps…