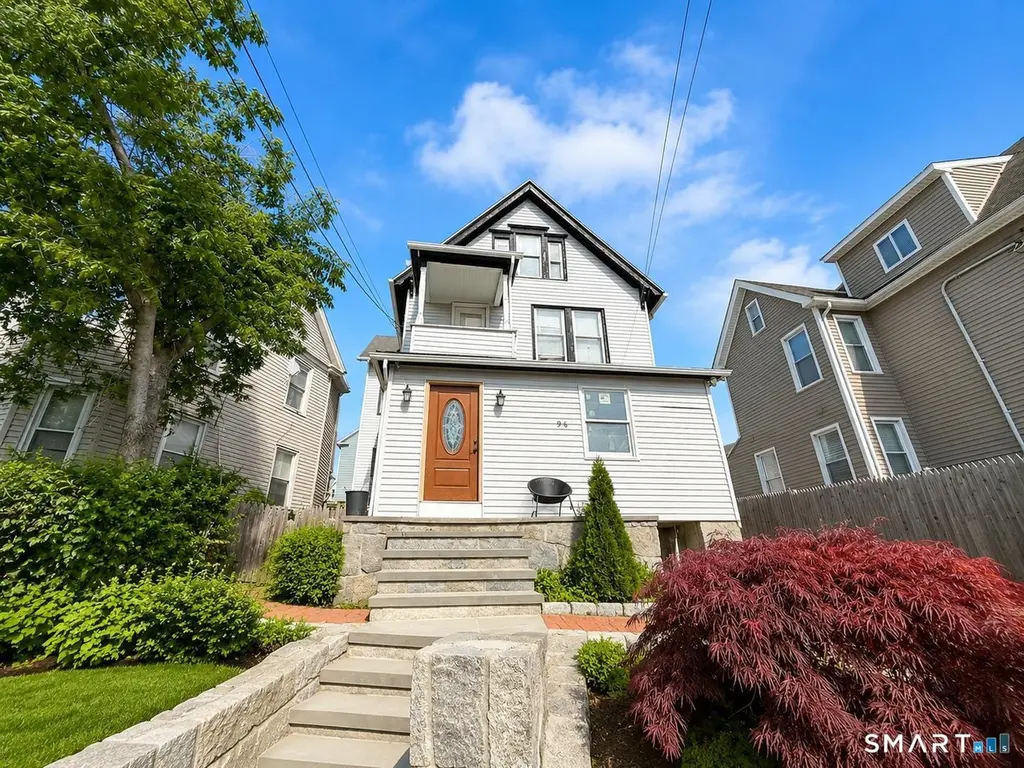
98 Huntington Rd · Bridgeport, CT
Flood risk 1/10 · Minimal
- FEMA flood zone
- X (unshaded)
- Chance of flooding over 30 yrs
- 0.0%
- Est. flood insurance / yr
- $473 – $860
Fire risk 1/10 · Minimal
- Est. fire insurance / yr
- $829 – $1,539
Heat risk 6/10 · Moderate
- Hot days now (above 97°F)
- 7 days/yr
- Hot days in 30 yrs
- 15 days/yr
Wind risk 6/10 · Moderate
- Chance of severe wind over 30 yrs
- 41.0%
Air-quality risk 4/10 · Minor
- Unhealthy air days now
- 5 days/yr
- Unhealthy air days in 30 yrs
- 7 days/yr
Risk factors via First Street. Map © Google.
Why this score? — see what drove the D grade
The composite is a weighted blend of 9 inputs, each scored 0–100. Each bar is that input's sub-score; the figure is the points it added to the 100-point composite (weight × sub-score).
- Appreciation +10.0/10.0
- Cash flow +9.8/30.0
- ARV discount +5.8/15.0
- Livability +4.0/5.0
- Rent growth +3.6/5.0
- DSCR +2.8/10.0
- Condition / age +2.5/5.0
- 1% rule +2.3/10.0
- Schools +1.2/10.0
$350,000
🖨 Deal sheet (PDF) 📄 Offer letter ✓ Due diligence
Listing remarks MLS
SINGLE FAMILY 3 BEDROOMS, 1 FULL BATHROOM, 1 FULL BASEMENT. PRICED TO SELL.
Key facts
- 3,049 sq ft lot
- Built 1907
- Listed 12 days
Property features AI
Exterior
- Utilities: Public water connected; Public sewer connected; 40-gallon hot water tank
- Home design: Single-family home
- Construction: Built with concrete construction; Stone foundation; Asphalt shingle roof
- Exterior features: Level lot; Vinyl siding
Interior
- Kitchen: Oven/Range; Refrigerator
- Bedrooms: 4 bedrooms
- Bathrooms: 1 full bathroom
- Heating & cooling: Hot water heating (natural gas); Window unit cooling
- Interior features: Full, unfinished basement; Total of 8 rooms
Neighborhood map
What this means for you Summary
Snapshot
- This is a 3-bed/2.0-bath single-family listed at $350k.
Deal economics
- At list price, monthly cash flow is $-221 ($-3k/yr) — negative.
- To cash-flow at today's rent, offer at most $311k (11.2% below list).
- To meet the 1% rule (rent ≥ 1% of price), the offer needs to be $256k (26.7% below list).
- Recommended offer: $256k (26.7% below list) — sets the bar for 1% rule.
Location & tenants
- Location reads 81/100 on livability (#15 in CT, #1,374 nationally) — a professional / high-income tenant draw. Strengths: amenities A+, commute A+, health & safety A+; Watch: crime C-, employment D+, schools D-.
- Bridgeport School District (urban): math 9% / reading 19% proficiency, ranked #151 of 153 in CT (top 99%) — low school quality limits family demand, transient renter base, plan for 1-2y turnover; 97% free/reduced lunch — lower-income household profile, screen leases tightly.
- Market conditions: Rents rising fast (+4.3%/yr); 32 active listings in the ZIP; 40 comparable units currently listed for rent nearby; rentals lingering (median 46d on market — plan ~5-8 weeks vacancy on turnover, expect pricing pressure); 55% of comp listings sitting > 30 days — soft ceiling on asking rent; 852 units permitted in Greater Bridgeport Planning Region in 2024 (698 in 5+ unit buildings).
- At $2,564/mo this rent would consume 67% of the median local household income ($46k/yr) (locally 910% of renters already pay >50% of income on rent) — very limited rent-growth headroom before tenants either downsize or default.
Forward outlook
- In year one you build about $37k of equity ($2k loan paydown + $35k appreciation (10.0% local appreciation)).
- By year 2, paydown + projected appreciation supports a ~$60k cash-out refi (75% LTV) — recoverable capital for the next deal without selling this one.
Negotiation context
- Only 12 days on market — expect competitive offers; lowballing is unlikely to land.
- 4 sale attempts since 23y ago with the ask held roughly flat each time — persistent listings suggest the price (not the market) is what's stuck; bring a comps-based counter.
- Current owner paid $38k; list at $350k implies a 821% gain — meaningful room to come down on a strong offer.
Risks & watch-outs
- Watch-outs: built in 1907 — expect roof / HVAC / electrical / plumbing capex.
- Climate carrying-cost: major wind risk, 41% chance of damaging wind over 30y; extreme-heat days projected 7→15/yr by 2055 (HVAC capex compounding) — expect insurance premiums to compound above CPI over the hold.
Questions for the listing agent
- What do current leases actually rent for vs. the listed asking? Can we see a recent rent roll and the last 12 months of T-12 income?
- Built in 1907 — when were the roof, HVAC, electrical panel, plumbing, and water heater last replaced?
- Is there a deadline driving the sale (1031 exchange, divorce, estate, relocation)? That informs how much negotiation room exists.
- Schools are D-rated, which usually means shorter tenancies and higher turnover. Who's the typical renter profile here, and what's been the actual vacancy rate?
- The area grade is low — what's the realistic commute time and amenity access for the typical tenant pool here? Any planned neighborhood developments (good or bad) we should know about?
- What's the average days-on-market for RENTAL listings here right now (not sales)? A rising rental-DOM trend means longer vacancies and softer asking-rent achievability than the comps imply.
- What's the recent tenant-quality profile in this submarket — average credit score on applications, eviction rate, late-payment / NSF rate, and stable-employment percentage? A property-management company in the area should have these aggregated.
- How much new for-sale + rental construction is in the pipeline within 1–3 miles? Heavy new supply typically softens prices + rents 12–24 months out; constrained supply supports both.
Investment metrics
- 1% rule
- 0.73% ✗
- Cap rate
- 5.53%
- Cash-on-cash
- -2.71%
- DSCR
- 0.88
- GRM
- 11.4
CMA / ARV
- ARV (on-the-fly)
- $337,310
- Comps found
- 12
Show comp detail 12 sales within ~0.75 mi
| Address | Dist | Beds/Ba | Sqft | Sold | Price | $/sf | Match |
|---|---|---|---|---|---|---|---|
| 604 William St | 0.19mi | 3/1.5 | 1,940 (+2%) | 6mo | $275,000 | $142 | 80 |
| 148 Orchard St | 0.41mi | 3/3.0 | 1,988 (+5%) | 4mo | $455,000 | $229 | 65 |
| 5 William Pl | 0.38mi | 3/1.5 | 1,771 (-6%) | 6mo | $300,000 | $169 | 65 |
| 107 Roosevelt St | 0.22mi | 3/1.5 | 1,807 (-5%) | 18mo | $285,000 | $158 | 65 |
| 308 Park St | 0.29mi | 4/2.0 (+1) | 1,834 (-3%) | 18mo | $355,000 | $194 | 61 |
| 644 Huntington Rd | 0.50mi | 3/1.5 | 1,789 (-6%) | 7mo | $440,000 | $246 | 59 |
| 230 Hickory St | 0.72mi | 3/1.5 | 1,819 (-4%) | 7mo | $463,795 | $255 | 52 |
| 76 Porter St | 0.62mi | 3/1.5 | 2,051 (+8%) | 5mo | $352,000 | $172 | 51 |
| 485 Noble Ave | 0.49mi | 4/2.0 (+1) | 1,673 (-12%) | 6mo | $230,000 | $137 | 48 |
| 65 Beach St | 0.62mi | 4/2.0 (+1) | 1,738 (-8%) | 10mo | $320,000 | $184 | 44 |
| 94 Asylum St | 0.51mi | 2/1.0 (-1) | 1,776 (-6%) | 16mo | $255,000 | $144 | 43 |
| 55 Rose St | 0.55mi | 2/1.0 (-1) | 2,052 (+8%) | 15mo | $365,000 | $178 | 39 |
Match score weights: distance 35% · size 25% · config 20% · recency 20%. Top-matched comps best support the ARV.
Projected returns pro-forma
10.0% appreciation · 4.35% rent growth · sell at horizon
- IRR
- 22.7%
- Equity multiple
- 2.84×
- Total profit
- $179,992
- Equity at exit
- $315,308
- IRR
- 20.6%
- Equity multiple
- 6.60×
- Total profit
- $548,561
- Equity at exit
- $679,973
Cash invested: $98,000 (down + closing). Projections, not guarantees.
Landlord ↔ Tenant lean methodology
- Overall (STATE)
- 27 Tenant-Leaning
- State Connecticut
- 27 Tenant-Leaning · D+7
- County
- — inherits STATE
- City
- — inherits STATE
ZIP-level market 06608
- Home prices YoY
- 3.6%
- Rents YoY
- 4.3%
- Active inventory
- 32
- Price-to-rent
- 11.4×
Monthly cashflow live
- Estimated rent
- $2,564 high interval (Pro) →
- Mortgage (P&I)
- −$1,835
- Tax from tax record
- −$266 /mo · $3,187/yr
- Insurance
- −$146
- HOA
- −$0
- Vacancy / Maint / Mgmt
- −$538
- Net cashflow
- $-221
Break-even live
Sensitivity live
| Price | -10% $-23 | -5% $-122 | +0% $-221 | +5% $-320 | +10% $-419 |
|---|---|---|---|---|---|
| Rent | -10% $-424 | -5% $-323 | +0% $-221 | +5% $-120 | +10% $-19 |
| Rate | -1.0pp $-45 | -0.5pp $-132 | base $-221 | +0.5pp $-312 | +1.0pp $-404 |
UW: 25.0% down · 7.5% · 30yr · 1.5% tax · 5.0% vac · 8.0% maint · 8.0% mgmt
Financing live
Cash to close
- Down payment
- $87,500
- Closing costs
- $10,500
- Reserves months
- —
- Total cash needed
- —
Loan-product check · same deal, 3 products live
Conventional
25% down · 7.5% · 30yr
- Down + closing
- —
- Monthly P&I
- —
- Monthly cashflow
- —
- DSCR
- —
- Eligible?
- —
Personal DTI + credit; lowest rate.
DSCR
20% down · 8.5% · 30yr
- Down + closing
- —
- Monthly P&I
- —
- Monthly cashflow
- —
- DSCR
- —
- Eligible?
- —
No personal income docs; deal must DSCR.
Hard money
10% down · 12.0% · 12mo
- Down + closing
- —
- Monthly P&I
- —
- Monthly cashflow
- —
- DSCR
- —
- Eligible?
- —
Short-term bridge; refi at stabilization.
Rent comps 40 comps
| Address | Beds | Baths | Sqft | Rent | $/sqft | DOM | Units | Dist |
|---|---|---|---|---|---|---|---|---|
| 690 William St Unit 2 Bridgeport, CT | 3.0 | 1.0 | 1746 | $2,200 | $1.26 | 25d | 1 | 0.10mi |
| 36-38 Pleasant St Unit 2 Bridgeport, CT | 4.0 | 1.0 | 2395 | $2,700 | $1.13 | 16d | 1 | 0.20mi |
| 149-151 Shelton St Unit 151 Bridgeport, CT | 2.0 | 1.0 | 2156 | $2,000 | $0.93 | 45d | 1 | 0.25mi |
| 52-54 Ives Ct Bridgeport, CT | 4.0 | 1.0 | 2092 | $2,750 | $1.31 | 45d | 1 | 0.28mi |
| 141 Hicks St Bridgeport, CT | 4.0 | 1.0 | 2311 | $2,400 | $1.04 | 25d | 1 | 0.32mi |
| 587 Brooks St Unit !st floor Bridgeport, CT | 3.0 | 2.0 | 1500 | $2,400 | $1.60 | 45d | 1 | 0.34mi |
| 672 Brooks St Bridgeport, CT | 4.0 | 1.0 | 1232 | $3,300 | $2.68 | 16d | 1 | 0.36mi |
| 227 Arctic St Bridgeport, CT | 2.0 | 1.5 | 2586 | $1,900 | $0.73 | 45d | 1 | 0.38mi |
| 281 Harriet St Unit 281 Bridgeport, CT | 4.0 | 2.5 | 2297 | $3,900 | $1.70 | 45d | 1 | 0.47mi |
| 279 Harriet St Bridgeport, CT | 3.0 | 1.5 | 1392 | $3,000 | $2.16 | 25d | 1 | 0.48mi |
| 1325 Pembroke St Unit 2nd Floor Bridgeport, CT | 3.0 | 1.0 | 1600 | $3,500 | $2.19 | 45d | 1 | 0.49mi |
| 95-97 Locust St Bridgeport, CT | 2.0 | 1.0 | 2048 | $1,800 | $0.88 | 45d | 1 | 0.50mi |
| 95 Parrott Ave Bridgeport, CT | 4.0 | 1.0 | 1782 | $3,450 | $1.94 | 25d | 1 | 0.53mi |
| 100 Horace St Bridgeport, CT | 2.0 | 1.5 | 2533 | $2,050 | $0.81 | 45d | 1 | 0.53mi |
| 695 Shelton St Unit 1st Floor Bridgeport, CT | 3.0 | 1.0 | 2387 | $2,200 | $0.92 | 45d | 1 | 0.57mi |
| 70 Hawthorne St Bridgeport, CT | 3.0 | 1.5 | 2376 | $3,500 | $1.47 | 45d | 1 | 0.62mi |
| 530 Jane St Unit 2B Bridgeport, CT | 3.0 | 2.0 | 2217 | $3,400 | $1.53 | 45d | 1 | 0.63mi |
| 2048 E Main St Bridgeport, CT | 4.0 | 2.0 | 2000 | $3,000 | $1.50 | 45d | 1 | 0.63mi |
| 982 Pembroke St Unit 2L Bridgeport, CT | 4.0 | 1.0 | 2043 | $2,475 | $1.21 | 5d | 1 | 0.67mi |
| 704 Maple St #704 Bridgeport, CT | 3.0 | 1.5 | 1948 | $2,700 | $1.39 | 25d | 1 | 0.71mi |
| 2395 Main St Unit First Floor Bridgeport, CT | 3.0 | 1.0 | 1262 | $2,300 | $1.82 | 13d | 1 | 0.72mi |
| 2395 Main St Unit Second Floor Bridgeport, CT | 3.0 | 1.0 | 1262 | $2,400 | $1.90 | 45d | 1 | 0.72mi |
| 51 Indian Ave Unit 1546115P Bridgeport, CT | 3.0 | 1.0 | 1388 | $3,871 | $2.79 | 13d | 1 | 0.76mi |
| 306 Madison Ave Bridgeport, CT | 3.0 | 1.0 | 1300 | $2,500 | $1.92 | 45d | 1 | 0.80mi |
| 130 Catherine St Unit 128 Bridgeport, CT | 3.0 | 2.0 | 1300 | $1,800 | $1.38 | 45d | 1 | 0.80mi |
| 93-95 Alpine St Bridgeport, CT | 2.0 | 1.0 | 1720 | $1,900 | $1.10 | 45d | 1 | 0.82mi |
| 588 E Main St Unit C Bridgeport, CT | 3.0 | 1.0 | 1400 | $2,475 | $1.77 | 16d | 1 | 0.89mi |
| 666 Capitol Ave Unit 2 Bridgeport, CT | 3.0 | 1.0 | 1247 | $2,400 | $1.92 | 45d | 1 | 0.89mi |
| 2744 Main St Bridgeport, CT | 2.0 | 1.0 | 1315 | $2,250 | $1.71 | 25d | 1 | 0.91mi |
| 143 Highland Ave Bridgeport, CT | 4.0 | 1.0 | 1362 | $2,500 | $1.84 | 25d | 1 | 0.99mi |
| 93 Sanford Ave Unit 2 Bridgeport, CT | 3.0 | 1.0 | 1230 | $2,600 | $2.11 | 25d | 1 | 1.02mi |
| 14 Infield St Bridgeport, CT | 3.0 | 2.5 | 1344 | $3,200 | $2.38 | 45d | 1 | 1.05mi |
| 136 Sherman St Unit 142 Bridgeport, CT | 4.0 | 1.5 | 2116 | $2,800 | $1.32 | 4d | 1 | 1.10mi |
| 125 Louisiana Ave #125 Bridgeport, CT | 2.0 | 1.0 | 1448 | $1,750 | $1.21 | 45d | 1 | 1.13mi |
| 457 Summit St Bridgeport, CT | 3.0 | 1.5 | 1511 | $4,000 | $2.65 | 45d | 1 | 1.14mi |
| 333 Ridgefield Ave Bridgeport, CT | 3.0 | 1.0 | 1400 | $2,250 | $1.61 | 5d | 1 | 1.16mi |
| 335 Ridgefield Ave Bridgeport, CT | 3.0 | 1.0 | 1400 | $2,250 | $1.61 | 5d | 1 | 1.16mi |
| 271 Vine St Unit 3 Bridgeport, CT | 3.0 | 1.0 | 1749 | $2,000 | $1.14 | 5d | 1 | 1.18mi |
| 292 Ridgefield Ave Unit 2 Bridgeport, CT | 4.0 | 1.0 | 1792 | $2,650 | $1.48 | 45d | 1 | 1.19mi |
| 292 Ridgefield Ave Unit 3 Bridgeport, CT | 3.0 | 1.0 | 1792 | $2,450 | $1.37 | 45d | 1 | 1.19mi |
Listing history 18 events
-
2026-06-10status $350,000 Under Contract 12 DOM
-
2026-06-09days on market $350,000 Active 12 DOM
-
2026-06-08days on market $350,000 Active 11 DOM
-
2026-06-07days on market $350,000 Active 10 DOM
-
2026-06-05days on market $350,000 Active 7 DOM
-
2026-06-03days on market $350,000 Active 6 DOM
-
2026-06-03days on market $350,000 Active 5 DOM
-
2026-06-01days on market $350,000 Active 4 DOM
-
2026-05-31days on market $350,000 Active 3 DOM
-
2026-05-28$350,000 Active
-
2016-02-12soldstatus $38,000 75-char remark
Show marketing remark (75 chars)
SINGLE FAMILY 3 BEDROOMS, 1 FULL BATHROOM, 1 FULL BASEMENT. PRICED TO SELL.
-
2016-01-25historical 75-char remark
Show marketing remark (75 chars)
SINGLE FAMILY 3 BEDROOMS, 1 FULL BATHROOM, 1 FULL BASEMENT. PRICED TO SELL.
-
2016-01-12$38,000 75-char remark
Show marketing remark (75 chars)
SINGLE FAMILY 3 BEDROOMS, 1 FULL BATHROOM, 1 FULL BASEMENT. PRICED TO SELL.
-
2014-06-17historical
-
2014-02-11$44,900
-
2004-02-02soldstatus $140,000
-
2003-03-27soldstatus $51,000
-
2003-02-03$44,900
ⓘ Source: listings_history table (triggers on properties + properties_extension) + one-shot
backfill from property_details.listing_events for pre-trigger history.
Tax reassessment forecast CT · Partial reset (capped growth)
- Current annual tax
- $3,187 · $266/mo
- Projected year-2 tax
- $5,338 · $445/mo
- Expected delta
- +$2,152/yr (+$179/mo · 67.5%)
ⓘ Screening estimate from a state-policy table — verify with the county assessor before closing.
Climate risk First Street
- Flood 1/10 Low FEMA zone X (unshaded) · 0% chance over 30 yrs
- Wildfire 1/10 Low
- Heat 6/10 Major 7 d/yr ≥97°F today · 15 d/yr by 30 yrs out
- Wind 6/10 Major 41% chance of damaging wind over 30 yrs
- Air quality 4/10 Moderate 5 unhealthy d/yr today · 7 by 30 yrs out
Nearby sold comps map
Loading sold comps map…
Walkable amenities ~0.75 mi
Loading nearby amenities…
Taxation est. · year 1
- Rental income
- $30,769
- − Mortgage interest
- −$19,605
- − Property taxes
- −$3,187
- − Insurance
- −$1,750
- − Repairs & maintenance
- −$2,462
- − Management
- −$2,462
- − Depreciation
- −$10,182
- Taxable loss
- −$8,878
- Est. tax savings @ 24.0%
- +$2,131
- After-tax cash flow
- $-524/yr
For passive investors: Depreciation is non-cash, so a rental often shows a tax loss while cash-flowing — sheltering income. Rental losses are passive: they offset passive income freely, and up to $25,000/yr can offset ordinary (W-2) income if you actively participate and your MAGI is under $100k (phasing out to $0 by $150k); unused losses carry forward. On sale, claimed depreciation is recaptured at up to 25%, and gains may owe capital-gains tax (a 1031 exchange can defer both). Figures are a year-1 estimate at your 24.0% rate — not tax advice; consult a CPA.
Schools (NCES district)
- District
- Bridgeport School District
- NCES district ID
- 0900450
- Math proficiency
- 9% ▼ -7.00%
- Reading proficiency
- 19% ▼ -10.00%
- Median HH income
- $41,507
- Composite
- 12.09/100
- National rank
- #9656
- State rank
- #151 of 153 in CT
Livability — Bridgeport
- Score
- 81/100
- State rank
- #15
- US rank
- #1374
Category grades
Schools grade is shown separately in the Schools card above.
Census & demographics
- Census place
- Bridgeport, CT
- County
- Fairfield County · 765,532 people
- City population
- 149,153
- Metro
- Bridgeport-Stamford-Norwalk, CT
- Population (ZIP)
- 12,146
- Household income
- $45,754
- Rent vs Own
- Severe rent burden
- 910.0
Population outlook (Greater Bridgeport County) Hauer SSP2
- By 2040
- 365,581
Race, ethnicity, and origin ACS 2023
- Neighborhood character
- Predominantly Hispanic (69%)
- Race & ethnicity
- Hispanic / Latino 69% Black 22% Two or more races 19% White 4% Asian 4%
- Hispanic origin (detail)
- Mexican 5% Puerto Rican 32% Cuban 1% Dominican 14%
- Common ancestry
- Hispanic 1% Russian 1% Estonian 0%
- Foreign-born
- 34% · Canada, Jamaica
- Languages at home
- 33% English-only · Spanish 56% French/Haitian/Cajun 4% Other Asian/Pacific 3%
Political lean MEDSL · Greater Bridgeport
- 2024 margin
- Strong D (+23.3) · D 60.9% · R 37.6% · Other 1.5%
- All cycles
- 2024: D+23.3
Not yet ingested
- Civics
- —
Market trends
- HPI YoY
- ▲ 18.29%
- Current HPI
- 530.5125
- Rent YoY
- ▲ 4.35%
- Metro
- Bridgeport-Stamford-Norwalk, CT
- State GDP YoY
- ▲ 1.06%
- F500 in state
- 38
Industry mix (Fortune 500 HQ in CT)
| Industry | F500 HQs | Revenue |
|---|---|---|
| Industrial Machinery | 4 | $38B |
|
||
| Insurance | 3 | $71B |
|
||
| Financial Services | 2 | $25B |
|
||
| Transportation / Logistics | 2 | $18B |
|
||
| Healthcare | 1 | $247B |
|
||
| Telecommunications | 1 | $55B |
|
||
Price history
+679.5% since first listed9 events — show timeline
- 2026-05-28 Listed $350,000 Smart MLS
- 2016-02-12 Sold (MLS) $38,000 Smart MLS
- 2016-01-25 Listing Removed — Smart MLS
- 2016-01-12 Listed $38,000 Smart MLS
- 2014-06-17 Listing Removed — Smart MLS
- 2014-02-11 Listed $44,900 Smart MLS
- 2004-02-02 Sold (Public Records) $140,000 Public Records
- 2003-03-27 Sold (MLS) $51,000 Smart MLS
- 2003-02-03 Listed $44,900 Smart MLS
Property tax history
-3.3%/yrLatest (2023): $3,187 · +0.0% YoY. Source: county tax records.
Cash-flow waterfall
monthlySold comps — $/sqft
last 12 mo · ≤1 miLoading sold comps…