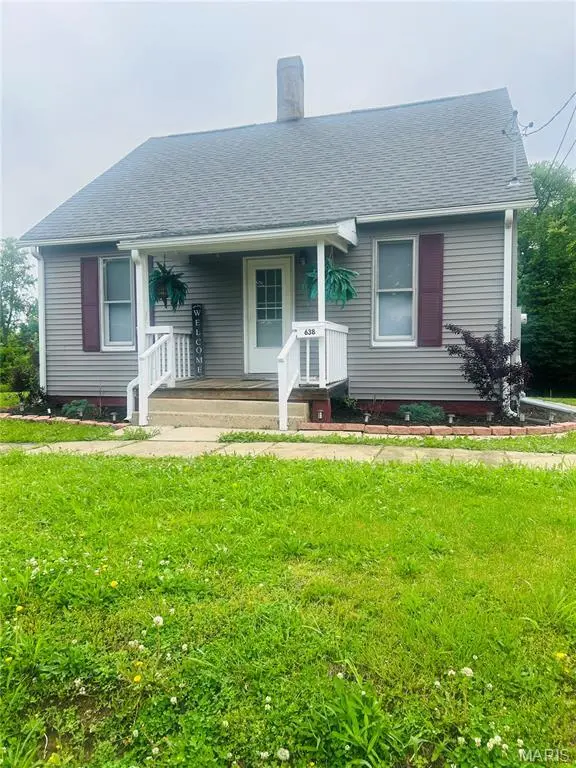
638 S 5th St · Vandalia, IL
Flood risk 1/10 · Minimal
- FEMA flood zone
- —
- Chance of flooding over 30 yrs
- 0.0%
- Est. flood insurance / yr
- —
Fire risk 1/10 · Minimal
- Est. fire insurance / yr
- $804 – $1,492
Heat risk 4/10 · Minor
- Hot days now (above 105°F)
- 7 days/yr
- Hot days in 30 yrs
- 18 days/yr
Wind risk 2/10 · Minimal
- Chance of severe wind over 30 yrs
- 2.0%
Air-quality risk 2/10 · Minimal
- Unhealthy air days now
- 1 days/yr
- Unhealthy air days in 30 yrs
- 2 days/yr
Risk factors via First Street. Map © Google.
Why this score? — see what drove the C grade
The composite is a weighted blend of 9 inputs, each scored 0–100. Each bar is that input's sub-score; the figure is the points it added to the 100-point composite (weight × sub-score).
- Cash flow +26.5/30.0
- DSCR +9.0/10.0
- ARV discount +7.5/15.0
- 1% rule +6.4/10.0
- Livability +3.6/5.0
- Rent growth +2.5/5.0
- Condition / age +2.5/5.0
- Schools +1.8/10.0
- Appreciation +0.0/10.0
$99,000
🖨 Deal sheet (PDF) 📄 Offer letter ✓ Due diligence
Listing remarks MLS
Large two bedroom home with additional lot next door. Total of approximately 0.43 acres and 1,792 sq ft of living area. Newer roof, vinyl siding, plus new furnace installed in 2021. Home has main floor laundry plus 1.5 baths on the main floor as well. All appliances included. Home is being sold as-is. Additional lot parcel # is 18-14-16-382-010.
Key facts
- 0.43 acre lot
- Built 1886
- Listed 33 days
Property features AI
Finance
- Other: Living area reported as 1,792 (public records); Lot approximately 0.43 acre (dimensions ~152' x 63' / 152' x 60'); Lot size source: public records
- Financial info: Lease not considered
Exterior
- Parking: Driveway; On-street parking
- Utilities: Public water; Public sewer; Electric service by Ameren; Electricity connected; Natural gas connected
- Home design: Single-family residence (attached property); One and one-half levels; Vinyl siding
- Construction: Architectural shingle roof; Block foundation; Vinyl siding construction
- Exterior features: Adjoins open ground
Interior
- Kitchen: Gas oven; Refrigerator
- Bedrooms: Three bedrooms total, two on the main level and one upper-level bedroom
- Flooring: Carpet; Laminate
- Bathrooms: One full bathroom and one half bathroom (main level)
- Heating & cooling: Forced air heating; Central air conditioning
- Interior features: Cellar, partial crawl space basement; Sliding and storm doors
- Laundry & utility: Washer and dryer on the main level
Neighborhood map
What this means for you Summary
Snapshot
- This is a 3-bed/1.0-bath other listed at $99k.
Deal economics
- At list price, monthly cash flow is $261 ($3k/yr) — positive.
- The deal already cash-flows at list — no discount required.
- Meets the 1% rule at list price ($1k rent vs $99k).
- Recommended offer: $96k (3.0% below list) — sets the bar for market timing.
- Cap rate 9.5% vs local median 4.9% in Vandalia — top-decile yield for the area; either an underpriced asset or a hidden risk that comps aren't pricing in. Stress-test before assuming the spread holds.
Location & tenants
- Location reads 71/100 on livability (#348 in IL) — a middle-class / working-renter tenant base. Strengths: crime A+, cost of living A+, housing A-; Watch: employment D, amenities F, commute F.
- Vandalia CUSD 203 (town): math 17% / reading 25% proficiency, ranked #414 of 620 in IL (top 67%) — low school quality limits family demand, transient renter base, plan for 1-2y turnover.
- Zoned schools: Vandalia Elementary School (math 37% / reading 22%, grade F, #658 of 2,056 statewide, top 35%, 542 students, 0% FRL); Vandalia Junior High School (math 12% / reading 26%, grade F, #436 of 665 statewide, top 66%, 511 students, 0% FRL); Vandalia Community High School (math 17% / reading 22%, grade F, #397 of 693 statewide, top 61%, 408 students, 0% FRL) — zoned schools average 0% FRL vs 51% district-wide (51 pts lower); this property's tenant base skews higher-income than the district average.
- Market conditions: 44 active listings in the ZIP.
Forward outlook
- Local home prices are declining (-3.0%/yr); year-one equity from $684 of loan paydown is wiped out by about $3k of value loss. Plan a longer hold.
- Fayette County population projected to shrink 9% by 2050 — rents likely to lag national; underwrite the cash flow, not the appreciation.
- At projected returns (-3.0% appreciation + 3.0% rent growth), your $28k cash investment doubles in ~10 years — after that, you're playing with house money.
Negotiation context
- It's been on market 33 days — a 3% lower offer ($96k) is reasonable based on typical stale-listing flexibility.
- 2 sale attempts since 3y ago; this cycle's ask has dropped $20k (17%) from the opening price — seller is motivated, your offer sets the floor, not the list.
- Current owner paid $50k; list at $99k implies a 98% gain — meaningful room to come down on a strong offer.
Risks & watch-outs
- Watch-outs: built in 1886 — expect roof / HVAC / electrical / plumbing capex.
Questions for the listing agent
- It's been on market 33 days. Have you received any prior offers? Is the seller open to a 3% concession, seller financing, or rate buy-down credit?
- Built in 1886 — when were the roof, HVAC, electrical panel, plumbing, and water heater last replaced?
- Is there a deadline driving the sale (1031 exchange, divorce, estate, relocation)? That informs how much negotiation room exists.
- Schools are D-rated, which usually means shorter tenancies and higher turnover. Who's the typical renter profile here, and what's been the actual vacancy rate?
- What's the average days-on-market for RENTAL listings here right now (not sales)? A rising rental-DOM trend means longer vacancies and softer asking-rent achievability than the comps imply.
- What's the recent tenant-quality profile in this submarket — average credit score on applications, eviction rate, late-payment / NSF rate, and stable-employment percentage? A property-management company in the area should have these aggregated.
- How much new for-sale + rental construction is in the pipeline within 1–3 miles? Heavy new supply typically softens prices + rents 12–24 months out; constrained supply supports both.
Investment metrics
- 1% rule
- 1.14% ✓
- Cap rate
- 9.46%
- Cash-on-cash
- 11.31%
- DSCR
- 1.50
- GRM
- 7.3
CMA / ARV
No comps found within radius.
Projected returns pro-forma
-3.0% appreciation · 3.0% rent growth · sell at horizon
- IRR
- 0.5%
- Equity multiple
- 1.02×
- Total profit
- $579
- Equity at exit
- $14,761
- IRR
- 10.2%
- Equity multiple
- 1.79×
- Total profit
- $21,860
- Equity at exit
- $8,560
Cash invested: $27,720 (down + closing). Projections, not guarantees.
Landlord ↔ Tenant lean methodology
- Overall (STATE)
- 43 Moderately Tenant-Leaning
- State Illinois
- 43 Moderately Tenant-Leaning · D+7
- County
- — inherits STATE
- City
- — inherits STATE
ZIP-level market 62471
- Active inventory
- 44
- Price-to-rent
- 7.3×
Monthly cashflow live
- Estimated rent
- $1,127 medium interval (Pro) →
- Mortgage (P&I)
- −$519
- Tax from tax record
- −$69 /mo · $824/yr
- Insurance
- −$41
- HOA
- −$0
- Vacancy / Maint / Mgmt
- −$237
- Net cashflow
- $261
Break-even live
Sensitivity live
| Price | -10% $317 | -5% $289 | +0% $261 | +5% $233 | +10% $205 |
|---|---|---|---|---|---|
| Rent | -10% $172 | -5% $217 | +0% $261 | +5% $306 | +10% $350 |
| Rate | -1.0pp $311 | -0.5pp $286 | base $261 | +0.5pp $236 | +1.0pp $209 |
UW: 25.0% down · 7.5% · 30yr · 1.5% tax · 5.0% vac · 8.0% maint · 8.0% mgmt
Financing live
Cash to close
- Down payment
- $24,750
- Closing costs
- $2,970
- Reserves months
- —
- Total cash needed
- —
Loan-product check · same deal, 3 products live
Conventional
25% down · 7.5% · 30yr
- Down + closing
- —
- Monthly P&I
- —
- Monthly cashflow
- —
- DSCR
- —
- Eligible?
- —
Personal DTI + credit; lowest rate.
DSCR
20% down · 8.5% · 30yr
- Down + closing
- —
- Monthly P&I
- —
- Monthly cashflow
- —
- DSCR
- —
- Eligible?
- —
No personal income docs; deal must DSCR.
Hard money
10% down · 12.0% · 12mo
- Down + closing
- —
- Monthly P&I
- —
- Monthly cashflow
- —
- DSCR
- —
- Eligible?
- —
Short-term bridge; refi at stabilization.
Listing history 24 events
-
2026-06-21days on market $99,000 Active 33 DOM
-
2026-06-21days on market $99,000 Active 32 DOM
-
2026-06-18days on market $99,000 Active 30 DOM
-
2026-06-17days on market $99,000 Active 29 DOM
-
2026-06-16days on market $99,000 Active 28 DOM
-
2026-06-15days on market $99,000 Active 27 DOM
-
2026-06-13days on market $99,000 Active 25 DOM
-
2026-06-12days on market $99,000 Active 24 DOM
-
2026-06-09days on market $99,000 Active 21 DOM
-
2026-06-08days on market $99,000 Active 20 DOM
-
2026-06-07days on market $99,000 Active 19 DOM
-
2026-06-07days on market $99,000 Active 18 DOM
-
2026-06-04pricedays on market $99,000 Active 15 DOM
-
2026-06-02days on market $119,000 Active 14 DOM
-
2026-06-01days on market $119,000 Active 13 DOM
-
2026-05-31days on market $119,000 Active 12 DOM
-
2026-05-31days on market $119,000 Active 11 DOM
-
2026-05-19$119,000 Active
-
2023-09-05soldstatus $50,000
-
2023-08-31status Pending 347-char remark
Show marketing remark (347 chars)
Large two bedroom home with additional lot next door. Total of approximately 0.43 acres and 1,792 sq ft of living area. Newer roof, vinyl siding, plus new furnace installed in 2021. Home has main floor laundry plus 1.5 baths on the main floor as well. All appliances included. Home is being sold as-is. Additional lot parcel # is 18-14-16-382-010.
-
2023-08-31soldstatus Closed 347-char remark
Show marketing remark (347 chars)
Large two bedroom home with additional lot next door. Total of approximately 0.43 acres and 1,792 sq ft of living area. Newer roof, vinyl siding, plus new furnace installed in 2021. Home has main floor laundry plus 1.5 baths on the main floor as well. All appliances included. Home is being sold as-is. Additional lot parcel # is 18-14-16-382-010.
-
2023-07-13historical Active Under Contract 347-char remark
Show marketing remark (347 chars)
Large two bedroom home with additional lot next door. Total of approximately 0.43 acres and 1,792 sq ft of living area. Newer roof, vinyl siding, plus new furnace installed in 2021. Home has main floor laundry plus 1.5 baths on the main floor as well. All appliances included. Home is being sold as-is. Additional lot parcel # is 18-14-16-382-010.
-
2023-06-29$55,000 Active 347-char remark
Show marketing remark (347 chars)
Large two bedroom home with additional lot next door. Total of approximately 0.43 acres and 1,792 sq ft of living area. Newer roof, vinyl siding, plus new furnace installed in 2021. Home has main floor laundry plus 1.5 baths on the main floor as well. All appliances included. Home is being sold as-is. Additional lot parcel # is 18-14-16-382-010.
-
2010-05-20soldstatus $29,000
ⓘ Source: listings_history table (triggers on properties + properties_extension) + one-shot
backfill from property_details.listing_events for pre-trigger history.
Tax reassessment forecast IL · Partial reset (capped growth)
- Current annual tax
- $824 · $69/mo
- Projected year-2 tax
- $1,536 · $128/mo
- Expected delta
- +$711/yr (+$59/mo · 86.3%)
ⓘ Screening estimate from a state-policy table — verify with the county assessor before closing.
Climate risk First Street
- Flood 1/10 Low 0% chance over 30 yrs
- Wildfire 1/10 Low
- Heat 4/10 Moderate 7 d/yr ≥105°F today · 18 d/yr by 30 yrs out
- Wind 2/10 Low 2% chance of damaging wind over 30 yrs
- Air quality 2/10 Low 1 unhealthy d/yr today · 2 by 30 yrs out
Nearby sold comps map
Loading sold comps map…
Walkable amenities ~0.75 mi
Loading nearby amenities…
Taxation est. · year 1
- Rental income
- $13,524
- − Mortgage interest
- −$5,546
- − Property taxes
- −$824
- − Insurance
- −$495
- − Repairs & maintenance
- −$1,082
- − Management
- −$1,082
- − Depreciation
- −$2,880
- Taxable income
- $1,615
- Est. tax owed @ 24.0%
- −$388
- After-tax cash flow
- $2,747/yr
For passive investors: Depreciation is non-cash, so a rental often shows a tax loss while cash-flowing — sheltering income. Rental losses are passive: they offset passive income freely, and up to $25,000/yr can offset ordinary (W-2) income if you actively participate and your MAGI is under $100k (phasing out to $0 by $150k); unused losses carry forward. On sale, claimed depreciation is recaptured at up to 25%, and gains may owe capital-gains tax (a 1031 exchange can defer both). Figures are a year-1 estimate at your 24.0% rate — not tax advice; consult a CPA.
Schools (NCES district)
- District
- Vandalia CUSD 203
- NCES district ID
- 1740140
- Math proficiency
- 17% ▼ -4.00%
- Reading proficiency
- 25% ▼ -7.00%
- Median HH income
- $45,995
- Composite
- 18.33/100
- National rank
- #8948
- State rank
- #414 of 620 in IL
Livability — Vandalia
- Score
- 71/100
- State rank
- #348
- US rank
- #7078
Category grades
Schools grade is shown separately in the Schools card above.
Census & demographics
- Census place
- Vandalia, IL
- City population
- 10,309
- Population (ZIP)
- 10,309
Population outlook (Fayette County) Hauer SSP2
- Today (2025)
- 21,667 people
- By 2030
- 21,362 · -1.4%
- By 2040
- 20,602 · -4.9%
- By 2050
- 19,669 · -9.2%
- By 2075
- 16,870 · -22.1%
- By 2100
- 12,861 · -40.6%
Race, ethnicity, and origin ACS 2023
- Neighborhood character
- Predominantly White (86%)
- Race & ethnicity
- White 86% Black 7% Two or more races 5% Hispanic / Latino 4%
- Common ancestry
- Lithuanian 2% Slovak 1% Romanian 1%
- Foreign-born
- 2% · Canada
- Languages at home
- 92% English-only · Spanish 4% German/W. Germanic 3%
Political lean MEDSL · Fayette
- 2024 margin
- Solid R (+64.7) · D 17.0% · R 81.7% · Other 1.3%
- 2008→2024 swing
- -48.9pp toward R · 2008: -15.8pp · 2024: -64.7pp
- All cycles
- 2024: R+64.7 2020: R+61.8 2016: R+58.3 2012: R+34.6 2008: R+15.8
Not yet ingested
- Civics
- —
Market trends
- HPI YoY
- ▼ -73.05%
- Current HPI
- 133.4945
- Rent YoY
- —
- Metro
- —
- State GDP YoY
- ▲ 1.59%
- F500 in state
- 60
Industry mix (Fortune 500 HQ in IL)
| Industry | F500 HQs | Revenue |
|---|---|---|
| Insurance | 4 | $201B |
|
||
| Consumer Goods | 4 | $87B |
|
||
| Industrial Machinery | 3 | $64B |
|
||
| Healthcare | 2 | $55B |
|
||
| Retail / Pharmacy | 1 | $148B |
|
||
| Agriculture / Food | 1 | $86B |
|
||
Price history
+241.4% since first listed8 events — show timeline
- 2026-06-03 Price Changed $99,000 MARIS as Distributed by MLS Grid
- 2026-05-19 Listed $119,000 MARIS as Distributed by MLS Grid
- 2023-09-05 Sold (Public Records) $50,000 Public Records
- 2023-08-31 Pending — MARIS as Distributed by MLS Grid
- 2023-08-31 Sold (MLS) — MARIS as Distributed by MLS Grid
- 2023-07-13 Contingent — MARIS as Distributed by MLS Grid
- 2023-06-29 Listed $55,000 MARIS as Distributed by MLS Grid
- 2010-05-20 Sold (Public Records) $29,000 Public Records
Property tax history
+7.1%/yrLatest (2024): $824 · +1.8% YoY. Source: county tax records.
Cash-flow waterfall
monthlySold comps — $/sqft
last 12 mo · ≤1 miLoading sold comps…