1600 Plan · Bellemont, AZ
Flood risk No data
- FEMA flood zone
- —
- Chance of flooding over 30 yrs
- —
- Est. flood insurance / yr
- —
Fire risk No data
- Est. fire insurance / yr
- —
Heat risk No data
- Hot days now (above threshold)
- —
- Hot days in 30 yrs
- —
Wind risk No data
- Chance of severe wind over 30 yrs
- —
Air-quality risk No data
- Unhealthy air days now
- —
- Unhealthy air days in 30 yrs
- —
Risk factors via First Street. Map © Google.
Why this score? — see what drove the C- grade
The composite is a weighted blend of 9 inputs, each scored 0–100. Each bar is that input's sub-score; the figure is the points it added to the 100-point composite (weight × sub-score).
- Cash flow +20.1/30.0
- ARV discount +8.0/15.0
- DSCR +6.4/10.0
- 1% rule +5.6/10.0
- Appreciation +3.5/10.0
- Rent growth +2.5/5.0
- Livability +2.5/5.0
- Schools +2.1/10.0
- Condition / age +1.0/5.0
$439,950
🖨 Deal sheet (PDF) 📄 Offer letter ✓ Due diligence
Listing remarks MLS
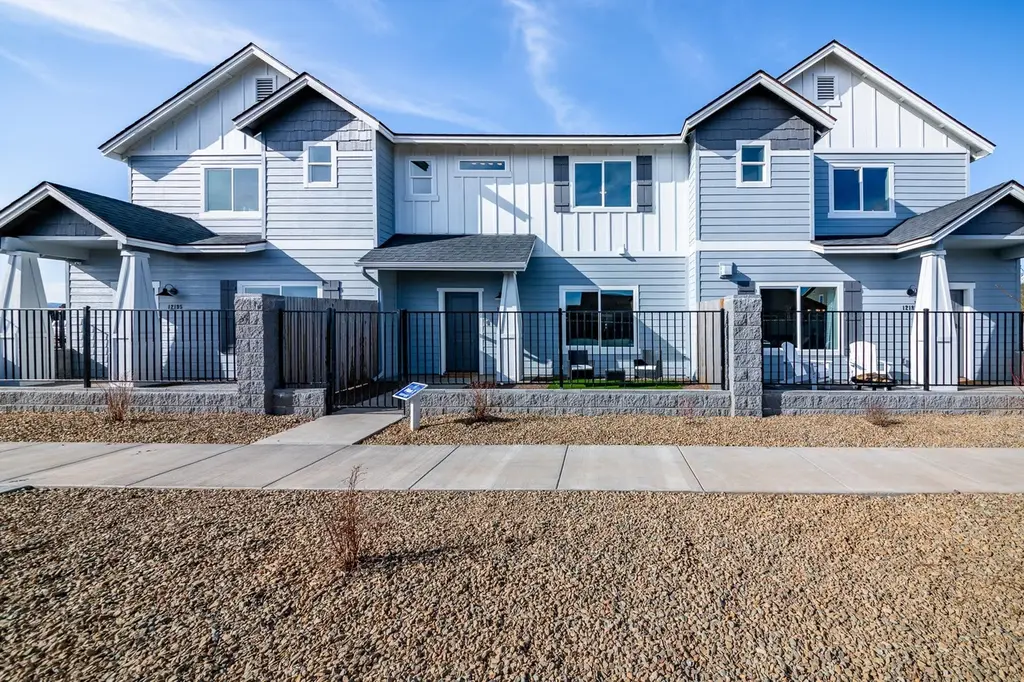
This home features an open concept 1st floor great room. All 3 bedrooms and a pocket loft are on the 2nd floor. In the front of the home there is a gated yard that leads to the front door with an oversize 2 car garage in the back of the home.
Key facts
- Oversize garage
- Open concept
- Gated yard
Tags
Neighborhood map
What this means for you Summary
Snapshot
- This is a 3-bed/2.5-bath townhouse listed at $440k. Condition is rated poor.
Deal economics
- At list price, monthly cash flow is $549 ($7k/yr) — positive.
- The deal already cash-flows at list — no discount required.
- Meets the 1% rule at list price ($5k rent vs $440k).
- Recommended offer: $387k (12.0% below list) — sets the bar for market timing.
Location & tenants
- Location reads: area grade C — affects rentability + tenant quality, not the cash-flow math above.
- Flagstaff Unified District (4192) (urban): math 18% / reading 29% proficiency, ranked #158 of 249 in AZ (top 64%) — low school quality limits family demand, transient renter base, plan for 1-2y turnover.
- Zoned schools: Manuel Demiguel Elementary School (math 39% / reading 55%, grade D-, #308 of 1,109 statewide, top 29%, 579 students, 19% FRL); Mount Elden Middle School (math 16% / reading 23%, grade F, #134 of 218 statewide, top 63%, 757 students, 51% FRL); Flagstaff High School (math 22% / reading 27%, grade F, #154 of 381 statewide, top 53%, 1,620 students, 25% FRL).
- Market conditions: 45 active listings in the ZIP; 698 units permitted in Coconino County in 2024 (354 in 5+ unit buildings).
Forward outlook
- Local home prices are declining (-2.9%/yr); year-one equity from $3k of loan paydown is wiped out by about $13k of value loss. Plan a longer hold.
- Coconino County population projected at +20% by 2050 — long-run rental-demand tailwind backs the buy-and-hold thesis.
Negotiation context
- It's been on market 380 days — a 12% lower offer ($387k) is reasonable based on typical stale-listing flexibility.
Questions for the listing agent
- It's been on market 380 days. Have you received any prior offers? Is the seller open to a 12% concession, seller financing, or rate buy-down credit?
- Have any recent inspections been done? Can we get a copy of the seller's disclosures and any deferred-maintenance estimates?
- What does the HOA fee cover, when was the last increase, and are there any pending special assessments or reserve-fund shortfalls?
- Why hasn't it sold? Are there any deal-killer items the seller is aware of (foundation, flood, title, zoning, code violations)?
- Is there a deadline driving the sale (1031 exchange, divorce, estate, relocation)? That informs how much negotiation room exists.
- What's the average days-on-market for RENTAL listings here right now (not sales)? A rising rental-DOM trend means longer vacancies and softer asking-rent achievability than the comps imply.
- What's the recent tenant-quality profile in this submarket — average credit score on applications, eviction rate, late-payment / NSF rate, and stable-employment percentage? A property-management company in the area should have these aggregated.
- How much new for-sale + rental construction is in the pipeline within 1–3 miles? Heavy new supply typically softens prices + rents 12–24 months out; constrained supply supports both.
Investment metrics
- 1% rule
- 1.06% ✓
- Cap rate
- 7.79%
- Cash-on-cash
- 5.35%
- DSCR
- 1.24
- GRM
- 7.8
CMA / ARV
- ARV (median comp)
- $444,722
- List price
- $439,950
- Delta
- -1.07%
- Verdict
- FAIR
- Comps
- 20 within 1.0 mi
Show comp detail 12 sales within ~0.75 mi
| Address | Dist | Beds/Ba | Sqft | Sold | Price | $/sf | Match |
|---|---|---|---|---|---|---|---|
| 12105 Bliss Ave | 0.02mi | 3/2.5 | 1,600 (0%) | 4mo | $449,950 | $281 | 96 |
| 12101 Bliss Ave | 0.01mi | 3/2.5 | 1,600 (0%) | 6mo | $445,000 | $278 | 94 |
| 12189 Bliss Ave | 0.03mi | 3/2.5 | 1,600 (0%) | 6mo | $450,000 | $281 | 94 |
| 12266 Curtis Ct | 0.14mi | 3/2.5 | 1,600 (0%) | 1mo | $463,000 | $289 | 93 |
| 12098 Bliss Ave | 0.01mi | 3/2.5 | 1,686 (+5%) | 1mo | $449,950 | $267 | 90 |
| 12207 Curtis Ct | 0.09mi | 3/2.5 | 1,600 (0%) | 10mo | $465,000 | $291 | 88 |
| 12296 Curtis Ct | 0.17mi | 3/2.5 | 1,600 (0%) | 9mo | $440,000 | $275 | 85 |
| 12103 Bliss Ave | 0.01mi | 3/2.5 | 1,686 (+5%) | 8mo | $445,370 | $264 | 83 |
| 12094 Bliss Ave | 0.00mi | 3/2.5 | 1,818 (+14%) | 1mo | $499,950 | $275 | 76 |
| 12107 Bliss Ave | 0.03mi | 3/2.5 | 1,818 (+14%) | 7mo | $505,000 | $278 | 70 |
| 12245 Solid Rock Dr | 0.09mi | 3/2.5 | 1,818 (+14%) | 6mo | $499,500 | $275 | 68 |
| 12262 Curtis Ct | 0.14mi | 3/2.5 | 1,818 (+14%) | 8mo | $510,000 | $281 | 64 |
Match score weights: distance 35% · size 25% · config 20% · recency 20%. Top-matched comps best support the ARV.
Projected returns pro-forma
-2.91% appreciation · 3.0% rent growth · sell at horizon
- IRR
- -7.5%
- Equity multiple
- 0.72×
- Total profit
- $-34,532
- Equity at exit
- $67,377
- IRR
- 1.9%
- Equity multiple
- 1.14×
- Total profit
- $16,908
- Equity at exit
- $41,102
Cash invested: $123,186 (down + closing). Projections, not guarantees.
Landlord ↔ Tenant lean methodology
- Overall (STATE)
- 87 Strongly Landlord-Friendly
- State Arizona
- 87 Strongly Landlord-Friendly · R+3
- County
- — inherits STATE
- City
- — inherits STATE
ZIP-level market 86015
- Home prices YoY
- -1.3%
- Active inventory
- 45
- Price-to-rent
- 7.8×
Monthly cashflow live
- Estimated rent
- $4,677 medium interval (Pro) →
- Mortgage (P&I)
- −$2,307
- Tax est. 1.5%
- −$550 /mo · $6,599/yr
- Insurance
- −$183
- HOA
- −$106
- Vacancy / Maint / Mgmt
- −$982
- Net cashflow
- $549
Break-even live
Sensitivity live
| Price | -10% $853 | -5% $701 | +0% $549 | +5% $397 | +10% $245 |
|---|---|---|---|---|---|
| Rent | -10% $179 | -5% $364 | +0% $549 | +5% $734 | +10% $918 |
| Rate | -1.0pp $770 | -0.5pp $661 | base $549 | +0.5pp $435 | +1.0pp $319 |
UW: 25.0% down · 7.5% · 30yr · 1.5% tax · 5.0% vac · 8.0% maint · 8.0% mgmt
Financing live
Cash to close
- Down payment
- $109,988
- Closing costs
- $13,198
- Reserves months
- —
- Total cash needed
- —
Loan-product check · same deal, 3 products live
Conventional
25% down · 7.5% · 30yr
- Down + closing
- —
- Monthly P&I
- —
- Monthly cashflow
- —
- DSCR
- —
- Eligible?
- —
Personal DTI + credit; lowest rate.
DSCR
20% down · 8.5% · 30yr
- Down + closing
- —
- Monthly P&I
- —
- Monthly cashflow
- —
- DSCR
- —
- Eligible?
- —
No personal income docs; deal must DSCR.
Hard money
10% down · 12.0% · 12mo
- Down + closing
- —
- Monthly P&I
- —
- Monthly cashflow
- —
- DSCR
- —
- Eligible?
- —
Short-term bridge; refi at stabilization.
HOA detail
- Monthly dues
- $106 · $1,272/yr
- Likely covers
- security
Listing history 23 events
-
2026-06-21days on market $439,950 Active 380 DOM
-
2026-06-19days on market $439,950 Active 378 DOM
-
2026-06-18days on market $439,950 Active 377 DOM
-
2026-06-17days on market $439,950 Active 376 DOM
-
2026-06-16days on market $439,950 Active 375 DOM
-
2026-06-15days on market $439,950 Active 374 DOM
-
2026-06-14days on market $439,950 Active 372 DOM
-
2026-06-13days on market $439,950 Active 371 DOM
-
2026-06-10days on market $439,950 Active 369 DOM
-
2026-06-09days on market $439,950 Active 368 DOM
-
2026-06-08days on market $439,950 Active 367 DOM
-
2026-06-07days on market $439,950 Active 366 DOM
-
2026-06-05days on market $439,950 Active 363 DOM
-
2026-06-03days on market $439,950 Active 362 DOM
-
2026-06-02days on market $439,950 Active 361 DOM
-
2026-06-01days on market $439,950 Active 360 DOM
-
2026-05-31days on market $439,950 Active 359 DOM
-
2026-05-30days on market $439,950 Active 358 DOM
-
2026-03-02price $439,950 242-char remark
Show marketing remark (242 chars)
This home features an open concept 1st floor great room. All 3 bedrooms and a pocket loft are on the 2nd floor. In the front of the home there is a gated yard that leads to the front door with an oversize 2 car garage in the back of the home.
-
2025-11-26price $449,950 242-char remark
Show marketing remark (242 chars)
This home features an open concept 1st floor great room. All 3 bedrooms and a pocket loft are on the 2nd floor. In the front of the home there is a gated yard that leads to the front door with an oversize 2 car garage in the back of the home.
-
2025-08-08price $459,950 242-char remark
Show marketing remark (242 chars)
This home features an open concept 1st floor great room. All 3 bedrooms and a pocket loft are on the 2nd floor. In the front of the home there is a gated yard that leads to the front door with an oversize 2 car garage in the back of the home.
-
2025-06-10price $474,950 242-char remark
Show marketing remark (242 chars)
This home features an open concept 1st floor great room. All 3 bedrooms and a pocket loft are on the 2nd floor. In the front of the home there is a gated yard that leads to the front door with an oversize 2 car garage in the back of the home.
-
2025-06-07$479,950 Active 242-char remark
Show marketing remark (242 chars)
This home features an open concept 1st floor great room. All 3 bedrooms and a pocket loft are on the 2nd floor. In the front of the home there is a gated yard that leads to the front door with an oversize 2 car garage in the back of the home.
ⓘ Source: listings_history table (triggers on properties + properties_extension) + one-shot
backfill from property_details.listing_events for pre-trigger history.
Nearby sold comps map
Loading sold comps map…
Walkable amenities ~0.75 mi
Loading nearby amenities…
Taxation est. · year 1
- Rental income
- $56,129
- − Mortgage interest
- −$24,644
- − Property taxes
- −$6,599
- − Insurance
- −$2,200
- − Repairs & maintenance
- −$4,490
- − Management
- −$4,490
- − HOA
- −$1,272
- − Depreciation
- −$12,799
- Taxable loss
- −$365
- Est. tax savings @ 24.0%
- +$88
- After-tax cash flow
- $6,673/yr
For passive investors: Depreciation is non-cash, so a rental often shows a tax loss while cash-flowing — sheltering income. Rental losses are passive: they offset passive income freely, and up to $25,000/yr can offset ordinary (W-2) income if you actively participate and your MAGI is under $100k (phasing out to $0 by $150k); unused losses carry forward. On sale, claimed depreciation is recaptured at up to 25%, and gains may owe capital-gains tax (a 1031 exchange can defer both). Figures are a year-1 estimate at your 24.0% rate — not tax advice; consult a CPA.
Condition & rehab AI · 1 photo
This townhouse requires extensive repairs and maintenance, including exterior painting, roof inspection, and flooring replacement, to improve its condition and resale value.
Repairs flagged
- Major siding — Significant wear and tear
- Major paint — Peeling and chipping
- Major roof — No visible damage, but not inspected
- Major flooring — No visible flooring, but not inspected
- Major interior walls — No visible interior, but not inspected
- Major systems — No visible systems, but not inspected
Value-add opportunities
- Resale exterior painting — Fresh paint can significantly improve curb appeal
- Resale roof inspection and repair — A new roof can add value and prevent future costly repairs
- Resale interior painting — Fresh paint inside can make the home more appealing
- Resale flooring replacement — New flooring can enhance the home's value
- Resale system upgrades — Upgrading systems can improve the home's functionality and value
Renovation cost estimate screening
| Repair item | Severity | Est. cost |
|---|---|---|
| siding · Significant wear and tear | Major | $15,000–50,000 |
| paint · Peeling and chipping | Major | $15,000–50,000 |
| roof · No visible damage, but not inspected | Major | $15,000–50,000 |
| flooring · No visible flooring, but not inspected | Major | $15,000–50,000 |
| interior walls · No visible interior, but not inspected | Major | $15,000–50,000 |
| systems · No visible systems, but not inspected | Major | $15,000–50,000 |
| Total estimated repair cost · 6 items | $90,000–300,000 |
Value-add ROI direction
- Resale exterior painting — Fresh paint can significantly improve curb appeal ↑
- Resale roof inspection and repair — A new roof can add value and prevent future costly repairs ↑
- Resale interior painting — Fresh paint inside can make the home more appealing ↑
- Resale flooring replacement — New flooring can enhance the home's value ↑
- Resale system upgrades — Upgrading systems can improve the home's functionality and value ↑
ⓘ Cost ranges are severity-bucket heuristics (US national rule-of-thumb). Get contractor quotes + a written scope before underwriting a rehab budget.
Schools (NCES district)
- District
- Flagstaff Unified District (4192)
- NCES district ID
- 0402860
- Math proficiency
- 18% ▼ -16.00%
- Reading proficiency
- 29% ▼ -10.00%
- Median HH income
- $53,510
- Composite
- 21.11/100
- National rank
- #8437
- State rank
- #158 of 249 in AZ
Livability — Bellemont
No livability data for this city. (Only ~50 U.S. cities are tracked.)
Census & demographics
- Census place
- Bellemont, AZ
- Population (ZIP)
- 1,447
Population outlook (Coconino County) Hauer SSP2
- Today (2025)
- 150,645 people
- By 2030
- 156,857 · +4.1%
- By 2040
- 168,714 · +12.0%
- By 2050
- 181,082 · +20.2%
- By 2075
- 218,399 · +45.0%
- By 2100
- 238,853 · +58.6%
Race, ethnicity, and origin ACS 2023
- Neighborhood character
- Highly diverse neighborhood (Simpson 0.77)
- Race & ethnicity
- White 44% Native American 23% Two or more races 22% Hispanic / Latino 17% Asian 4%
- Hispanic origin (detail)
- Mexican 15% Puerto Rican 1%
- Common ancestry
- Slovak 4% Iranian 2% Italian 2%
- Foreign-born
- 4%
- Languages at home
- 71% English-only · Other Asian/Pacific 3% Spanish 3% Tagalog/Filipino 1%
Political lean MEDSL · Coconino
- 2024 margin
- D (+19.9) · D 59.2% · R 39.4% · Other 1.4%
- 2008→2024 swing
- +2.9pp toward D · 2008: 17.0pp · 2024: 19.9pp
- All cycles
- 2024: D+19.9 2020: D+24.1 2016: D+19.4 2012: D+14.9 2008: D+17.0
Not yet ingested
- Civics
- —
Market trends
- HPI YoY
- ▼ -2.91%
- Current HPI
- 219.9374
- Rent YoY
- —
- Metro
- —
- State GDP YoY
- ▲ 4.54%
- F500 in state
- 20
Industry mix (Fortune 500 HQ in AZ)
| Industry | F500 HQs | Revenue |
|---|---|---|
| Technology | 2 | $13B |
|
||
| Mining / Metals | 1 | $23B |
|
||
| Environmental Services | 1 | $16B |
|
||
| Metals / Steel | 1 | $14B |
|
||
| Technology Distribution | 1 | $9B |
|
||
| Homebuilding | 1 | $8B |
|
||
Price history
-8.3% since first listed5 events — show timeline
- 2026-03-02 Price Changed $439,950 Zillow
- 2025-11-26 Price Changed $449,950 Zillow
- 2025-08-08 Price Changed $459,950 Zillow
- 2025-06-10 Price Changed $474,950 Zillow
- 2025-06-07 Listed $479,950 Zillow
Cash-flow waterfall
monthlySold comps — $/sqft
last 12 mo · ≤1 miLoading sold comps…