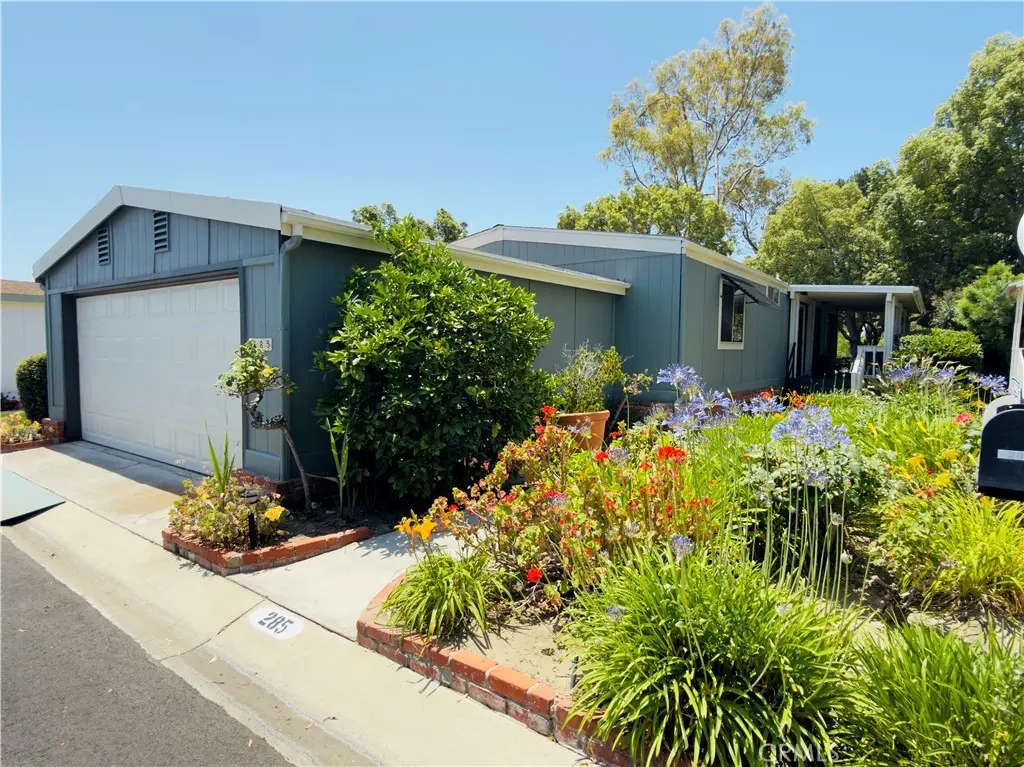
5200-5200 Irvine Blvd #285 · Irvine, CA
Flood risk No data
- FEMA flood zone
- —
- Chance of flooding over 30 yrs
- —
- Est. flood insurance / yr
- —
Fire risk No data
- Est. fire insurance / yr
- —
Heat risk No data
- Hot days now (above threshold)
- —
- Hot days in 30 yrs
- —
Wind risk No data
- Chance of severe wind over 30 yrs
- —
Air-quality risk No data
- Unhealthy air days now
- —
- Unhealthy air days in 30 yrs
- —
Risk factors via First Street. Map © Google.
Why this score? — see what drove the D+ grade
The composite is a weighted blend of 9 inputs, each scored 0–100. Each bar is that input's sub-score; the figure is the points it added to the 100-point composite (weight × sub-score).
- ARV discount +11.6/15.0
- Cash flow +8.5/30.0
- Schools +6.9/10.0
- Appreciation +6.2/10.0
- Livability +3.8/5.0
- Rent growth +2.5/5.0
- Condition / age +2.5/5.0
- DSCR +2.3/10.0
- 1% rule +2.0/10.0
$519,000
🖨 Deal sheet (PDF) 📄 Offer letter ✓ Due diligence
Listing remarks
Discover unparalleled comfort and convenience in this well-maintained home, ideally situated on one of The Groves' most desirable lots. Tucked away on a quiet corner with a serene park behind, yet offering access to nearby restaurants and supermarkets just steps away. This location truly offers the best of both worlds. Enjoy complete peace of mind with many recent capital improvements ensuring modern comfort and lasting value. The home was termite tented in 2021, upgraded with a new HVAC system and water heater in 2022, outfitted with a brand-new roof in 2023, and refreshed with new exterior paint and wood repair in 2024. Step inside to a thoughtfully designed interior. To your right, a we
Key facts
- 1,248 sq ft lot
- 2 garage spots
- Community pool
Property features AI
Finance
- Other: Community features include street lighting, park, and dog park
- HOA & community: Part of The Groves Homeowners, Inc association; Monthly association fee; Association fee collected monthly; Community amenities include clubhouse, pool, spa, gym/exercise room, tennis and pickleball, outdoor cooking and barbecue areas, picnic area, multipurpose/recreational room, meeting/banquet/card rooms, concierge, controlled access, guard, dog park, common RV parking, maintenance of grounds, and insurance; Senior community
Exterior
- Parking: Attached front-entry garage; 2 garage spaces (2 total parking spaces)
- Security: Controlled access; Guarded community
- Utilities: Public sewer; District/public water; Natural gas connected; Electricity connected; Sewer connected; Water connected
- Home design: Manufactured property; Single-story; No shared/common walls; Offers a view; Planned development community
- Construction: Year built reported by seller
- Exterior features: Manufactured house; Association-maintained in-ground heated pool and spa; Association pool; Sprinkler system; Landscaped yard with front yard and greenbelt; Close to clubhouse; Yard
Interior
- Kitchen: Breakfast counter/bar; Formal dining room
- Bedrooms: Primary bedroom on main floor; All bedrooms on main floor; Includes an office and a primary suite
- Flooring: Vinyl flooring; Carpet flooring
- Bathrooms: One full bathroom; One 3/4 bathroom; Two bathrooms on the main level
- Heating & cooling: Central cooling
- Interior features: One-level home with ground-level entry; Main floor entry; Main level bedrooms and bathrooms
- Laundry & utility: Dedicated laundry room; Washer hookup; Gas dryer hookup
Neighborhood map
What this means for you Summary
Snapshot
- This is a 2-bed/2.0-bath manufactured listed at $519k.
Deal economics
- At list price, monthly cash flow is $-457 ($-5k/yr) — negative.
- To cash-flow at today's rent, offer at most $438k (15.5% below list).
- To meet the 1% rule (rent ≥ 1% of price), the offer needs to be $365k (29.6% below list).
- Recommended offer: $365k (29.6% below list) — sets the bar for 1% rule.
- Cap rate 5.2% vs local median 1.2% in Irvine — top-decile yield for the area; either an underpriced asset or a hidden risk that comps aren't pricing in. Stress-test before assuming the spread holds.
Location & tenants
- Location reads 76/100 on livability (#100 in CA, #3,537 nationally) — a middle-class / working-renter tenant base. Strengths: crime A+, commute A+, employment A+; Watch: health & safety C-, cost of living F.
- Irvine Unified (urban): math 74% / reading 80% proficiency, ranked #31 of 517 in CA (top 6%) — strong family-tenant draw, lease renewals of 3-5y typical; only 10% free/reduced lunch — higher-income household profile.
- Zoned schools: Northwood Elementary (516 students, 31% FRL); Sierra Vista Middle (1,126 students, 17% FRL); Northwood High (math 75% / reading 83%, grade A-, #51 of 1,170 statewide, top 4%, 2,251 students, 19% FRL).
- Market conditions: Rents flat; 151 active listings in the ZIP; 40 comparable units currently listed for rent nearby; rentals at typical pace (median 21d on market — plan ~3-4 weeks tenant-placement turnaround); high-income renter base; 6,974 units permitted in Orange County in 2024 (3,839 in 5+ unit buildings).
Forward outlook
- In year one you build about $16k of equity ($4k loan paydown + $13k appreciation (2.5% local appreciation)).
- Orange County population projected at +14% by 2050 — modest demand growth; plan on rents tracking national, not racing it.
- By year 3, paydown + projected appreciation supports a ~$41k cash-out refi (75% LTV) — recoverable capital for the next deal without selling this one.
Negotiation context
- It's been on market 19 days — a 2% lower offer ($511k) is reasonable based on typical stale-listing flexibility.
Questions for the listing agent
- What do current leases actually rent for vs. the listed asking? Can we see a recent rent roll and the last 12 months of T-12 income?
- Built in 1978 — when were the roof, HVAC, electrical panel, plumbing, and water heater last replaced?
- What does the HOA fee cover, when was the last increase, and are there any pending special assessments or reserve-fund shortfalls?
- Is there a deadline driving the sale (1031 exchange, divorce, estate, relocation)? That informs how much negotiation room exists.
- Schools are A-rated — typically a magnet for longer-tenancy family renters. What's the average tenant stay here, and is there a school-zone premium baked into asking?
- The area grade is low — what's the realistic commute time and amenity access for the typical tenant pool here? Any planned neighborhood developments (good or bad) we should know about?
- What's the average days-on-market for RENTAL listings here right now (not sales)? A rising rental-DOM trend means longer vacancies and softer asking-rent achievability than the comps imply.
- What's the recent tenant-quality profile in this submarket — average credit score on applications, eviction rate, late-payment / NSF rate, and stable-employment percentage? A property-management company in the area should have these aggregated.
- How much new for-sale + rental construction is in the pipeline within 1–3 miles? Heavy new supply typically softens prices + rents 12–24 months out; constrained supply supports both.
Investment metrics
- 1% rule
- 0.70% ✗
- Cap rate
- 5.24%
- Cash-on-cash
- -3.77%
- DSCR
- 0.83
- GRM
- 11.8
CMA / ARV
- ARV (on-the-fly)
- $570,336
- Comps found
- 3
Show comp detail 3 sales within ~0.75 mi
| Address | Dist | Beds/Ba | Sqft | Sold | Price | $/sf | Match |
|---|---|---|---|---|---|---|---|
| 5200 Irvine Blvd #286 | 0.00mi | 2/2.0 | 1,248 (0%) | 1mo | $565,000 | $453 | 100 |
| 5200 Irvine Blvd #94 | 0.00mi | 2/2.0 | 1,248 (0%) | 16mo | $570,000 | $457 | 86 |
| 5200 Irvine Blvd #217 | 0.00mi | 2/2.0 | 1,248 (0%) | 20mo | $575,000 | $461 | 84 |
Match score weights: distance 35% · size 25% · config 20% · recency 20%. Top-matched comps best support the ARV.
Projected returns pro-forma
2.48% appreciation · 0.13% rent growth · sell at horizon
- IRR
- 1.1%
- Equity multiple
- 1.06×
- Total profit
- $8,990
- Equity at exit
- $218,370
- IRR
- 3.9%
- Equity multiple
- 1.54×
- Total profit
- $78,469
- Equity at exit
- $325,310
Cash invested: $145,320 (down + closing). Projections, not guarantees.
Landlord ↔ Tenant lean methodology
- Overall (STATE)
- 18 Strongly Tenant-Friendly
- State California
- 18 Strongly Tenant-Friendly · D+13
- County
- — inherits STATE
- City
- — inherits STATE
ZIP-level market 92620
- Home prices YoY
- 0.5%
- Rents YoY
- 0.1%
- Active inventory
- 151
- Price-to-rent
- 11.8×
Monthly cashflow live
- Estimated rent
- $3,653 high interval (Pro) →
- Mortgage (P&I)
- −$2,722
- Tax from tax record
- −$115 /mo · $1,384/yr
- Insurance
- −$216
- HOA
- −$289
- Vacancy / Maint / Mgmt
- −$767
- Net cashflow
- $-457
Break-even live
Sensitivity live
| Price | -10% $-163 | -5% $-310 | +0% $-457 | +5% $-604 | +10% $-750 |
|---|---|---|---|---|---|
| Rent | -10% $-745 | -5% $-601 | +0% $-457 | +5% $-312 | +10% $-168 |
| Rate | -1.0pp $-195 | -0.5pp $-325 | base $-457 | +0.5pp $-591 | +1.0pp $-728 |
UW: 25.0% down · 7.5% · 30yr · 1.5% tax · 5.0% vac · 8.0% maint · 8.0% mgmt
Financing live
Cash to close
- Down payment
- $129,750
- Closing costs
- $15,570
- Reserves months
- —
- Total cash needed
- —
Loan-product check · same deal, 3 products live
Conventional
25% down · 7.5% · 30yr
- Down + closing
- —
- Monthly P&I
- —
- Monthly cashflow
- —
- DSCR
- —
- Eligible?
- —
Personal DTI + credit; lowest rate.
DSCR
20% down · 8.5% · 30yr
- Down + closing
- —
- Monthly P&I
- —
- Monthly cashflow
- —
- DSCR
- —
- Eligible?
- —
No personal income docs; deal must DSCR.
Hard money
10% down · 12.0% · 12mo
- Down + closing
- —
- Monthly P&I
- —
- Monthly cashflow
- —
- DSCR
- —
- Eligible?
- —
Short-term bridge; refi at stabilization.
Rent comps 40 comps
| Address | Beds | Baths | Sqft | Rent | $/sqft | DOM | Units | Dist |
|---|---|---|---|---|---|---|---|---|
| 230 Springview Irvine, CA | 2.0 | 1.0 | 809 | $2,600 | $3.21 | 45d | 1 | 0.26mi |
| 247 Streamwood Irvine, CA | 2.0 | 1.0 | 887 | $3,250 | $3.66 | 19d | 1 | 0.33mi |
| 40 Lakepines Irvine, CA | 2.0 | 1.5 | 1204 | $3,300 | $2.74 | 20d | 1 | 0.35mi |
| 20 Lakepines Irvine, CA | 2.0 | 1.5 | 1204 | $3,300 | $2.74 | 19d | 1 | 0.36mi |
| 163 Pineview Irvine, CA | 1.0 | 1.0 | 934 | $3,200 | $3.43 | 12d | 1 | 0.39mi |
| 33 Richmond Irvine, CA | 3.0 | 2.0 | 1370 | $4,100 | $2.99 | 3d | 1 | 0.44mi |
| 2 Tonada Dr Irvine, CA | 3.0 | 2.0 | 1432 | $3,900 | $2.72 | 20d | 1 | 0.65mi |
| 49 Canal Irvine, CA | 2.0 | 2.5 | 1021 | $5,800 | $5.68 | 45d | 1 | 0.67mi |
| 19 Fulton Irvine, CA | 2.0 | 2.0 | 1475 | $4,300 | $2.92 | 0d | 1 | 0.68mi |
| 162 Overbrook Irvine, CA | 2.0 | 2.0 | 1129 | $4,200 | $3.72 | 45d | 1 | 0.75mi |
| 122 Overbrook Irvine, CA | 2.0 | 2.0 | 1129 | $3,600 | $3.19 | 45d | 1 | 0.76mi |
| 100 Simplicity Irvine, CA | 1.0–2.0 | 1.0–2.0 | 954 | $3,575 | $3.75 | 5d | 22 | 0.77mi |
| 261 Mayfair Irvine, CA | 3.0 | 2.0 | 1378 | $4,500 | $3.27 | 0d | 1 | 0.84mi |
| 70 Kempton Irvine, CA | 2.0 | 1.5 | 1129 | $3,600 | $3.19 | 45d | 1 | 0.87mi |
| 37 Spanish Lace Irvine, CA | 1.0 | 2.0 | 1100 | $3,000 | $2.73 | 45d | 1 | 0.91mi |
| 76 Great Lawn Irvine, CA | 2.0 | 2.5 | 1154 | $3,800 | $3.29 | 7d | 1 | 0.92mi |
| 8 Iceberg Rose Irvine, CA | 2.0 | 2.5 | 1170 | $4,050 | $3.46 | 45d | 1 | 0.94mi |
| 39 Costa Brava Irvine, CA | 2.0 | 2.5 | 1170 | $4,000 | $3.42 | 26d | 1 | 0.96mi |
| 100 Piedmont Irvine, CA | 1.0–2.0 | 1.0–2.0 | 769 | $3,200 | $4.16 | 0d | 1 | 0.98mi |
| 33 Iceberg Rose Irvine, CA | 2.0 | 2.0 | 1106 | $3,500 | $3.16 | 45d | 1 | 0.99mi |
| 8 New Hvn Irvine, CA | 3.0 | 3.0 | 1273 | $3,997 | $3.14 | 0d | 1 | 0.99mi |
| 4 New Hvn Unit 1 Irvine, CA | 3.0 | 2.5 | 1424 | $4,100 | $2.88 | 45d | 1 | 1.00mi |
| 100 Mirasol Irvine, CA | 1.0–2.0 | 1.0–2.0 | 987 | $3,710 | $3.76 | 0d | 1 | 1.04mi |
| 18 Filare Irvine, CA | 3.0 | 2.5 | 1385 | $4,300 | $3.10 | 4d | 1 | 1.04mi |
| 52 Bridgeport Irvine, CA | 2.0 | 2.0 | 948 | $3,600 | $3.80 | 4d | 1 | 1.08mi |
| 317 Huntington Irvine, CA | 2.0 | 2.0 | 1000 | $3,100 | $3.10 | 15d | 1 | 1.11mi |
| 42 Talisman Irvine, CA | 2.0 | 2.0 | 1165 | $3,700 | $3.18 | 4d | 1 | 1.12mi |
| 365 Huntington #189 Irvine, CA | 3.0 | 2.5 | 1224 | $3,750 | $3.06 | 45d | 1 | 1.13mi |
| 145 Huntington Irvine, CA | 3.0 | 2.5 | 1224 | $3,900 | $3.19 | 45d | 1 | 1.14mi |
| 4 Van Buren #313 Irvine, CA | 2.0 | 2.0 | 903 | $3,300 | $3.65 | 14d | 1 | 1.17mi |
| 441 Ridgeway Irvine, CA | 2.0 | 2.0 | 1291 | $3,700 | $2.87 | 45d | 1 | 1.24mi |
| 3 Salton Irvine, CA | 2.0 | 2.0 | 1462 | $3,700 | $2.53 | 22d | 1 | 1.24mi |
| 100 Virtuoso Irvine, CA | 1.0–2.0 | 1.0–2.0 | 926 | $3,795 | $4.10 | 0d | 1 | 1.24mi |
| 210 Timberwood Irvine, CA | 2.0 | 2.5 | 1224 | $3,650 | $2.98 | 45d | 1 | 1.25mi |
| 1300 Hayes St Irvine, CA | 1.0–2.0 | 1.0–2.0 | 882 | $3,015 | $3.42 | 0d | 1 | 1.25mi |
| 449 Ridgeway Irvine, CA | 3.0 | 3.0 | 1500 | $4,500 | $3.00 | 45d | 1 | 1.26mi |
| 100 Grand Canal Irvine, CA | 1.0–2.0 | 1.0–2.5 | 901 | $4,440 | $4.93 | 0d | 108 | 1.27mi |
| 74 Rosenblum Unit 108 Irvine, CA | 2.0 | 2.0 | 1462 | $3,800 | $2.60 | 24d | 1 | 1.27mi |
| 117 Islington Irvine, CA | 2.0 | 2.0 | 1291 | $3,650 | $2.83 | 45d | 1 | 1.29mi |
| 1412 Timberwood Irvine, CA | 2.0 | 2.5 | 1300 | $3,600 | $2.77 | 15d | 1 | 1.29mi |
HOA detail
- Monthly dues
- $289 · $3,468/yr
- Likely covers
- water
Listing history 14 events
-
2026-06-21days on market $519,000 Active 19 DOM
-
2026-06-18days on market $519,000 Active 16 DOM
-
2026-06-17days on market $519,000 Active 15 DOM
-
2026-06-16days on market $519,000 Active 14 DOM
-
2026-06-15days on market $519,000 Active 13 DOM
-
2026-06-13days on market $519,000 Active 11 DOM
-
2026-06-13days on market $519,000 Active 10 DOM
-
2026-06-09days on market $519,000 Active 7 DOM
-
2026-06-08days on market $519,000 Active 6 DOM
-
2026-06-07days on market $519,000 Active 5 DOM
-
2026-06-04days on market $519,000 Active 2 DOM
-
2026-06-02statusdays on market $519,000 Active 1 DOM
-
2026-06-01days on market $519,000 Coming Soon 4 DOM
-
2026-05-31days on market $519,000 Coming Soon 3 DOM
ⓘ Source: listings_history table (triggers on properties + properties_extension) + one-shot
backfill from property_details.listing_events for pre-trigger history.
Tax reassessment forecast CA · Resets to sale price
- Current annual tax
- $1,384 · $115/mo
- Projected year-2 tax
- $3,944 · $329/mo
- Expected delta
- +$2,560/yr (+$213/mo · 185.0%)
ⓘ Screening estimate from a state-policy table — verify with the county assessor before closing.
Nearby sold comps map
Loading sold comps map…
Walkable amenities ~0.75 mi
Loading nearby amenities…
Taxation est. · year 1
- Rental income
- $43,832
- − Mortgage interest
- −$29,072
- − Property taxes
- −$1,384
- − Insurance
- −$2,595
- − Repairs & maintenance
- −$3,507
- − Management
- −$3,507
- − HOA
- −$3,468
- − Depreciation
- −$15,098
- Taxable loss
- −$14,799
- Est. tax savings @ 24.0%
- +$3,552
- After-tax cash flow
- $-1,929/yr
For passive investors: Depreciation is non-cash, so a rental often shows a tax loss while cash-flowing — sheltering income. Rental losses are passive: they offset passive income freely, and up to $25,000/yr can offset ordinary (W-2) income if you actively participate and your MAGI is under $100k (phasing out to $0 by $150k); unused losses carry forward. On sale, claimed depreciation is recaptured at up to 25%, and gains may owe capital-gains tax (a 1031 exchange can defer both). Figures are a year-1 estimate at your 24.0% rate — not tax advice; consult a CPA.
Schools (NCES district)
- District
- Irvine Unified
- NCES district ID
- 0684500
- Math proficiency
- 74% ▲ 1.00%
- Reading proficiency
- 80% ▲ 3.00%
- Median HH income
- $92,078
- Composite
- 69.17/100
- National rank
- #319
- State rank
- #31 of 517 in CA
Livability — Irvine
- Score
- 76/100
- State rank
- #100
- US rank
- #3537
Category grades
Schools grade is shown separately in the Schools card above.
Census & demographics
- Census place
- Irvine, CA
- County
- Orange County · 3,096,323 people
- City population
- 287,839
- Metro
- Los Angeles-Long Beach-Anaheim, CA
- Population (ZIP)
- 61,631
- Household income
- $146,942
- Rent vs Own
- Severe rent burden
- 2240.0
Population outlook (Orange County) Hauer SSP2
- Today (2025)
- 3,477,456 people
- By 2030
- 3,613,117 · +3.9%
- By 2040
- 3,835,945 · +10.3%
- By 2050
- 3,968,736 · +14.1%
- By 2075
- 4,097,053 · +17.8%
- By 2100
- 3,903,633 · +12.3%
Race, ethnicity, and origin ACS 2023
- Neighborhood character
- Diverse neighborhood (Simpson 0.58)
- Race & ethnicity
- Asian 59% White 26% Two or more races 9% Hispanic / Latino 8% Black 1%
- Hispanic origin (detail)
- Mexican 6%
- Common ancestry
- Scotch-Irish 1% Italian 1% Romanian 1%
- Foreign-born
- 43% · China, South Korea, Vietnam
- Languages at home
- 45% English-only · Chinese 21% Other Indo-European 10% Korean 8%
Political lean MEDSL · Orange
- 2024 margin
- Toss-up / Even · D 49.7% · R 47.1% · Other 3.2%
- 2008→2024 swing
- +5.2pp toward D · 2008: -2.6pp · 2024: 2.6pp
- All cycles
- 2024: D+2.6 2020: D+9.0 2016: D+7.7 2012: R+8.3 2008: R+2.6
Not yet ingested
- Civics
- —
Market trends
- HPI YoY
- ▲ 2.48%
- Current HPI
- 499.7012
- Rent YoY
- ▲ 0.13%
- Metro
- Los Angeles-Long Beach-Anaheim, CA
- State GDP YoY
- ▲ 3.21%
- F500 in state
- 116
Industry mix (Fortune 500 HQ in CA)
| Industry | F500 HQs | Revenue |
|---|---|---|
| Technology | 27 | $1,492B |
|
||
| Financial Services | 3 | $174B |
|
||
| Retail | 3 | $44B |
|
||
| Insurance | 3 | $26B |
|
||
| Media / Entertainment | 2 | $115B |
|
||
| Pharmaceuticals / Biotech | 2 | $62B |
|
||
Price history
1 event — show timeline
- 2026-05-28 Coming Soon $519,000 CRMLS
Property tax history
+2.0%/yrLatest (2025): $1,384 · +2.7% YoY. Source: county tax records.
Cash-flow waterfall
monthlySold comps — $/sqft
last 12 mo · ≤1 miLoading sold comps…