132 Glenside St · Welaka, FL
Flood risk 1/10 · Minimal
- FEMA flood zone
- X (unshaded)
- Chance of flooding over 30 yrs
- 0.0%
- Est. flood insurance / yr
- $507 – $1,088
Fire risk 4/10 · Minor
- Est. fire insurance / yr
- $947 – $1,759
Heat risk 9/10 · Severe
- Hot days now (above 107°F)
- 7 days/yr
- Hot days in 30 yrs
- 21 days/yr
Wind risk 9/10 · Severe
- Chance of severe wind over 30 yrs
- 99.0%
Air-quality risk 3/10 · Minor
- Unhealthy air days now
- 3 days/yr
- Unhealthy air days in 30 yrs
- 3 days/yr
Risk factors via First Street. Map © Google.
Why this score? — see what drove the D grade
The composite is a weighted blend of 9 inputs, each scored 0–100. Each bar is that input's sub-score; the figure is the points it added to the 100-point composite (weight × sub-score).
- Cash flow +10.8/30.0
- Appreciation +7.6/10.0
- ARV discount +7.5/15.0
- 1% rule +3.3/10.0
- DSCR +3.1/10.0
- Schools +3.0/10.0
- Livability +2.8/5.0
- Rent growth +2.5/5.0
- Condition / age +2.5/5.0
$140,000
🖨 Deal sheet 📄 Offer letter ✓ Due diligence
Listing remarks
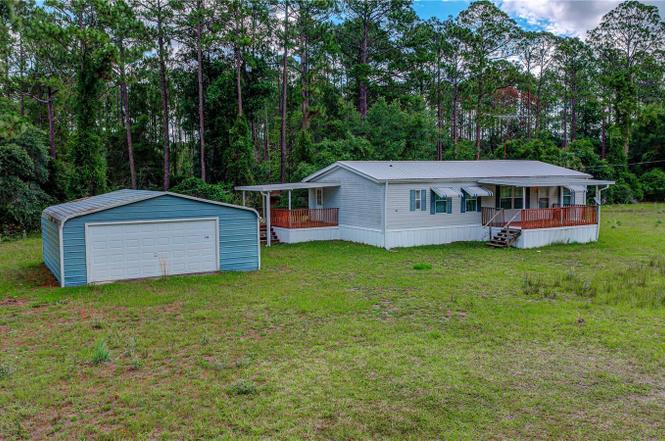
Fully Furnished Country Retreat on Nearly an Acre! Welcome to this well-maintained 3-bedroom, 2-bath doublewide with 3 car detached workshop, situated on three combined parcels totaling approximately 0.92 acres. Tucked away among mature trees and just a short distance from the water, this property offers the perfect blend of privacy, space, and peaceful Old Florida charm. Step inside to find a spacious and inviting floor plan featuring a large living area, generously sized bedrooms, and a bright kitchen with abundant cabinetry and counter space. Best of all, all furnishings are included, making this a truly move-in-ready opportunity—ideal as a primary residence, seasonal getaway, or i
Key facts
- Covered front porch
- Nearly an acre
- Room for boats
Tags
Property features AI
Finance
- Other: Property zoned R-2; Approximately 0.92 acre lot (about 300 x 135) with 3 lots; Road surface: dirt, limerock, other; Furnished; Has additional parcels
Exterior
- Parking: Carport with 2 spaces
- Utilities: Well water; Septic tank; Electricity connected
- Home design: Residential manufactured home; Double-wide; Single-story; Faces southwest; Model: Homes of Merit
- Construction: Metal siding; Metal roof; Slab and other foundation; Built as a manufactured home
- Exterior features: Covered patio/porch areas; Front porch; Side porch; Awnings; Exterior lighting; Rain gutters; Storage; Shed(s); Workshop; Cleared, oversized lot
Interior
- Kitchen: Dishwasher; Range; Microwave; Refrigerator
- Bedrooms: 3 bedrooms
- Flooring: Carpet; Linoleum
- Bathrooms: 2 full bathrooms
- Heating & cooling: Central heating; Central air conditioning
- Interior features: Cathedral ceilings; Ceiling fans; Eat-in kitchen; Open floorplan; Walk-in closets; Window treatments
- Laundry & utility: Washer; Dryer; Inside laundry in a laundry closet
Neighborhood map
What this means for you Summary
Snapshot
- This is a 3-bed/2.0-bath manufactured listed at $140k.
Deal economics
- At list price, monthly cash flow is $-65 ($-783/yr) — negative.
- To cash-flow at today's rent, offer at most $128k (8.2% below list).
- To meet the 1% rule (rent ≥ 1% of price), the offer needs to be $116k (17.1% below list).
- Recommended offer: $116k (17.1% below list) — sets the bar for 1% rule.
- Cap rate 5.7% vs local median 1.7% in Welaka — top-decile yield for the area; either an underpriced asset or a hidden risk that comps aren't pricing in. Stress-test before assuming the spread holds.
Location & tenants
- Location reads 55/100 on livability (#878 in FL) — a working-class tenant base; expect higher turnover. Strengths: cost of living A+; Watch: health & safety C-, schools F, amenities F.
- Putnam (town): math 34% / reading 39% proficiency, ranked #66 of 73 in FL (top 90%) — families likely to look elsewhere, expect single-tenant / working-renter base with shorter leases; 71% free/reduced lunch — lower-income household profile, screen leases tightly.
- Market conditions: 226 active listings in the ZIP; 113 units permitted in Putnam County in 2024 (0 in 5+ unit buildings).
Forward outlook
- In year one you build about $8k of equity ($968 loan paydown + $7k appreciation (5.1% local appreciation)).
- Putnam County population projected at -31% by 2050 — secular population decline; favor cash flow + early exit over multi-decade hold.
- At projected returns (5.1% appreciation + 3.0% rent growth), your $39k cash investment doubles in ~5 years — after that, you're playing with house money.
- By year 5, paydown + projected appreciation supports a ~$35k cash-out refi (75% LTV) — recoverable capital for the next deal without selling this one.
Negotiation context
- Only 2 days on market — expect competitive offers; lowballing is unlikely to land.
- Current owner paid $25k; list at $140k implies a 460% gain — meaningful room to come down on a strong offer.
Risks & watch-outs
- Climate carrying-cost: severe wind risk, 99% chance of damaging wind over 30y; extreme-heat days projected 7→21/yr by 2055 (HVAC capex compounding) — expect insurance premiums to compound above CPI over the hold.
Questions for the listing agent
- What do current leases actually rent for vs. the listed asking? Can we see a recent rent roll and the last 12 months of T-12 income?
- Is there a deadline driving the sale (1031 exchange, divorce, estate, relocation)? That informs how much negotiation room exists.
- Schools are F-rated, which usually means shorter tenancies and higher turnover. Who's the typical renter profile here, and what's been the actual vacancy rate?
- The area grade is low — what's the realistic commute time and amenity access for the typical tenant pool here? Any planned neighborhood developments (good or bad) we should know about?
- What's the average days-on-market for RENTAL listings here right now (not sales)? A rising rental-DOM trend means longer vacancies and softer asking-rent achievability than the comps imply.
- What's the recent tenant-quality profile in this submarket — average credit score on applications, eviction rate, late-payment / NSF rate, and stable-employment percentage? A property-management company in the area should have these aggregated.
- How much new for-sale + rental construction is in the pipeline within 1–3 miles? Heavy new supply typically softens prices + rents 12–24 months out; constrained supply supports both.
Investment metrics
- 1% rule
- 0.83% ✗
- Cap rate
- 5.73%
- Cash-on-cash
- -2.00%
- DSCR
- 0.91
- GRM
- 10.1
CMA / ARV
- ARV (on-the-fly)
- $342,144
- Comps found
- 2
Show comp detail 2 sales within ~0.75 mi
| Address | Dist | Beds/Ba | Sqft | Sold | Price | $/sf | Match |
|---|---|---|---|---|---|---|---|
| 104 Ferncreek Dr | 0.41mi | 3/2.0 | 1,134 (-12%) | 3mo | $299,900 | $264 | 58 |
| 132 Whispering Pines Rd | 0.57mi | 2/2.0 (-1) | 1,152 (-11%) | 14mo | $114,000 | $99 | 38 |
Match score weights: distance 35% · size 25% · config 20% · recency 20%. Top-matched comps best support the ARV.
Projected returns pro-forma
5.11% appreciation · 3.0% rent growth · sell at horizon
- IRR
- 11.5%
- Equity multiple
- 1.74×
- Total profit
- $29,008
- Equity at exit
- $80,260
- IRR
- 12.6%
- Equity multiple
- 3.32×
- Total profit
- $90,959
- Equity at exit
- $139,287
Cash invested: $39,200 (down + closing). Projections, not guarantees.
Landlord ↔ Tenant lean methodology
- Overall (STATE)
- 87 Strongly Landlord-Friendly
- State Florida
- 87 Strongly Landlord-Friendly · R+3
- County
- — inherits STATE
- City
- — inherits STATE
ZIP-level market 32139
- Home prices YoY
- 1.8%
- Active inventory
- 226
- Price-to-rent
- 10.1×
Monthly cashflow live
- Estimated rent
- $1,160 medium interval (Pro) →
- Mortgage (P&I)
- −$734
- Tax from tax record
- −$189 /mo · $2,272/yr
- Insurance
- −$58
- HOA
- −$0
- Vacancy / Maint / Mgmt
- −$244
- Net cashflow
- $-65
Break-even live
UW: 25.0% down · 7.5% · 30yr · 1.5% tax · 5.0% vac · 8.0% maint · 8.0% mgmt
Financing live
Cash to close
- Down payment
- $35,000
- Closing costs
- $4,200
- Reserves months
- —
- Total cash needed
- —
Loan-product check · same deal, 3 products live
Conventional
25% down · 7.5% · 30yr
- Down + closing
- —
- Monthly P&I
- —
- Monthly cashflow
- —
- DSCR
- —
- Eligible?
- —
Personal DTI + credit; lowest rate.
DSCR
20% down · 8.5% · 30yr
- Down + closing
- —
- Monthly P&I
- —
- Monthly cashflow
- —
- DSCR
- —
- Eligible?
- —
No personal income docs; deal must DSCR.
Hard money
10% down · 12.0% · 12mo
- Down + closing
- —
- Monthly P&I
- —
- Monthly cashflow
- —
- DSCR
- —
- Eligible?
- —
Short-term bridge; refi at stabilization.
Listing history 3 events
-
2026-06-18days on market $140,000 Active 2 DOM
-
2026-06-16remarks 693-char remark
-
2026-06-16$140,000 Active 1 DOM
ⓘ Source: listings_history table (triggers on properties + properties_extension) + one-shot
backfill from property_details.listing_events for pre-trigger history.
Tax reassessment forecast FL · Resets to sale price
- Current annual tax
- $2,272 · $189/mo
- Projected year-2 tax
- $2,272 · $189/mo
- Expected delta
- $0/yr ($0/mo · 0.0%)
ⓘ Screening estimate from a state-policy table — verify with the county assessor before closing.
Climate risk First Street
- Flood 1/10 Low FEMA zone X (unshaded) · 0% chance over 30 yrs
- Wildfire 4/10 Moderate
- Heat 9/10 Extreme 7 d/yr ≥107°F today · 21 d/yr by 30 yrs out
- Wind 9/10 Extreme 99% chance of damaging wind over 30 yrs
- Air quality 3/10 Moderate 3 unhealthy d/yr today · 3 by 30 yrs out
Nearby sold comps map
Loading sold comps map…
Walkable amenities ~0.75 mi
Loading nearby amenities…
Taxation est. · year 1
- Rental income
- $13,923
- − Mortgage interest
- −$7,842
- − Property taxes
- −$2,272
- − Insurance
- −$700
- − Repairs & maintenance
- −$1,114
- − Management
- −$1,114
- − Depreciation
- −$4,073
- Taxable loss
- −$3,191
- Est. tax savings @ 24.0%
- +$766
- After-tax cash flow
- $-17/yr
For passive investors: Depreciation is non-cash, so a rental often shows a tax loss while cash-flowing — sheltering income. Rental losses are passive: they offset passive income freely, and up to $25,000/yr can offset ordinary (W-2) income if you actively participate and your MAGI is under $100k (phasing out to $0 by $150k); unused losses carry forward. On sale, claimed depreciation is recaptured at up to 25%, and gains may owe capital-gains tax (a 1031 exchange can defer both). Figures are a year-1 estimate at your 24.0% rate — not tax advice; consult a CPA.
Schools (NCES district)
- District
- Putnam
- NCES district ID
- 1201620
- Math proficiency
- 34% ▼ -10.00%
- Reading proficiency
- 39% ▼ -4.00%
- Median HH income
- $33,350
- Composite
- 29.99/100
- National rank
- #6361
- State rank
- #66 of 73 in FL
Livability — Welaka
- Score
- 55/100
- State rank
- #878
- US rank
- #23339
Category grades
Schools grade is shown separately in the Schools card above.
Census & demographics
- City population
- 1,200
- Population (ZIP)
- 897
Population outlook (Putnam County) Hauer SSP2
- Today (2025)
- 65,299 people
- By 2030
- 61,255 · -6.2%
- By 2040
- 52,930 · -18.9%
- By 2050
- 45,051 · -31.0%
- By 2075
- 28,720 · -56.0%
- By 2100
- 15,852 · -75.7%
Race, ethnicity, and origin ACS 2023
- Neighborhood character
- Predominantly White (88%)
- Race & ethnicity
- White 88% Hispanic / Latino 7% Two or more races 6% Asian 1%
- Hispanic origin (detail)
- Mexican 7%
- Common ancestry
- Iranian 3% Serbian 1%
- Foreign-born
- 5% · Canada, South Korea
- Languages at home
- 94% English-only · Spanish 6%
Political lean MEDSL · Putnam
- 2024 margin
- Solid R (+47.8) · D 25.8% · R 73.6%
- 2008→2024 swing
- -28.5pp toward R · 2008: -19.3pp · 2024: -47.8pp
- All cycles
- 2024: R+47.8 2020: R+41.2 2016: R+36.6 2012: R+24.5 2008: R+19.3
Not yet ingested
- Civics
- —
Market trends
- HPI YoY
- ▲ 5.11%
- Current HPI
- 291.5006
- Rent YoY
- —
- Metro
- —
- State GDP YoY
- ▲ 3.28%
- F500 in state
- 36
Industry mix (Fortune 500 HQ in FL)
| Industry | F500 HQs | Revenue |
|---|---|---|
| Industrial Technology | 2 | $29B |
|
||
| Insurance | 2 | $17B |
|
||
| Retail | 1 | $60B |
|
||
| Technology Distribution | 1 | $58B |
|
||
| Homebuilding | 1 | $35B |
|
||
| Technology Manufacturing | 1 | $35B |
|
||
Price history
+460.0% since first listed2 events — show timeline
- 2026-06-16 Listed $140,000 Stellar MLS as Distributed by MLS Grid
- 2010-11-24 Sold (Public Records) $25,000 Public Records
Property tax history
+5.1%/yrLatest (2025): $2,272 · +5.9% YoY. Source: county tax records.
Cash-flow waterfall
monthlySold comps — $/sqft
last 12 mo · ≤1 miLoading sold comps…