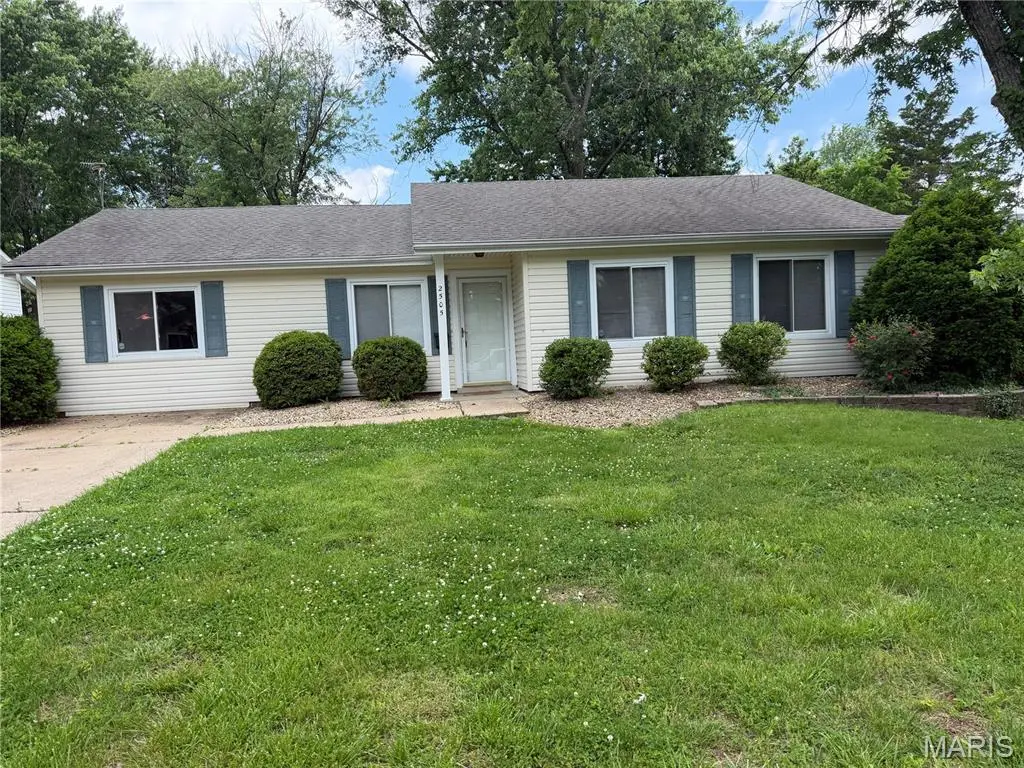
2505 Ambelwood Ln · O'Fallon, MO
Flood risk 1/10 · Minimal
- FEMA flood zone
- X (unshaded)
- Chance of flooding over 30 yrs
- 0.0%
- Est. flood insurance / yr
- $507 – $1,088
Fire risk 1/10 · Minimal
- Est. fire insurance / yr
- $1,054 – $1,958
Heat risk 5/10 · Moderate
- Hot days now (above 107°F)
- 7 days/yr
- Hot days in 30 yrs
- 20 days/yr
Wind risk 2/10 · Minimal
- Chance of severe wind over 30 yrs
- 1.0%
Air-quality risk 2/10 · Minimal
- Unhealthy air days now
- 1 days/yr
- Unhealthy air days in 30 yrs
- 1 days/yr
Risk factors via First Street. Map © Google.
Why this score? — see what drove the C+ grade
The composite is a weighted blend of 9 inputs, each scored 0–100. Each bar is that input's sub-score; the figure is the points it added to the 100-point composite (weight × sub-score).
- Cash flow +21.4/30.0
- ARV discount +14.5/15.0
- DSCR +6.8/10.0
- 1% rule +5.3/10.0
- Schools +5.1/10.0
- Rent growth +2.9/5.0
- Livability +2.5/5.0
- Condition / age +2.5/5.0
- Appreciation +0.0/10.0
$215,000
🖨 Deal sheet (PDF) 📄 Offer letter ✓ Due diligence
Listing remarks
This is a beautiful ranch Home single story with three bedrooms, one bath newly painted upgraded bathroom, new dishwasher, new flooring and all the bedrooms vinyl flooring throughout the house. It’s in the Woodcrest subdivision located in the middle of O’fallon shopping district. Make a great starter home.
Key facts
- Upgraded bathroom
- Ranch home
- Vinyl flooring
Tags
Property features AI
Finance
- Other: Property type: Residential single-family residence
- HOA & community: Woodcrest Homeowners Association; Annual HOA fee of $35; HOA amenities: Other
Exterior
- Utilities: Public water; Public sewer; Electric service (other); Cable available
- Home design: Single-family house; One story
- Construction: Frame construction with shingle siding; Asphalt shingle roof; Other foundation details
- Exterior features: Patio; Fenced yard; Other exterior features; Interior lot
Interior
- Kitchen: Dishwasher; Disposal; Gas range; Refrigerator
- Bedrooms: 3 bedrooms (all on the main level)
- Flooring: Vinyl flooring
- Bathrooms: 1 full bathroom (on the main level)
- Heating & cooling: Natural gas heat; Central air; Ceiling fan(s)
- Interior features: Pantry; Walk-in closet(s); Other interior features
- Laundry & utility: Washer hookup; Electric dryer hookup; Gas water heater
Neighborhood map
What this means for you Summary
Snapshot
- This is a 3-bed/1.0-bath single-family listed at $215k.
Deal economics
- At list price, monthly cash flow is $319 ($4k/yr) — positive.
- The deal already cash-flows at list — no discount required.
- Meets the 1% rule at list price ($2k rent vs $215k).
- Recommended offer: $212k (1.5% below list) — sets the bar for market timing.
- Cap rate 8.1% vs local median 3.2% in O'Fallon — top-decile yield for the area; either an underpriced asset or a hidden risk that comps aren't pricing in. Stress-test before assuming the spread holds.
Location & tenants
- Location reads: area grade C — affects rentability + tenant quality, not the cash-flow math above.
- Ft. Zumwalt R-II (suburban): math 54% / reading 60% proficiency, ranked #14 of 324 in MO (top 4%) — acceptable for families but not a draw, mixed tenant base, ~2y average lease; only 18% free/reduced lunch — higher-income household profile.
- Zoned schools: Dardenne Elem. (math 47% / reading 52%, grade D, #284 of 1,115 statewide, top 30%, 412 students, 42% FRL); Ft. Zumwalt West High (math 64% / reading 72%, grade B, #13 of 521 statewide, top 2%, 1,778 students, 17% FRL).
- Market conditions: Rents rising (+1.6%/yr); 374 active listings in the ZIP; 7 comparable units currently listed for rent nearby; rentals leasing fast (median 12d on market — plan ~1-2 weeks tenant-placement turnaround); high-income renter base; 2,021 units permitted in St. Charles County in 2024 (568 in 5+ unit buildings).
Forward outlook
- Local home prices are declining (-3.0%/yr); year-one equity from $1k of loan paydown is wiped out by about $6k of value loss. Plan a longer hold.
- St. Charles County population projected at +22% by 2050 — long-run rental-demand tailwind backs the buy-and-hold thesis.
Negotiation context
- It's been on market 22 days — a 2% lower offer ($212k) is reasonable based on typical stale-listing flexibility.
- 2 sale attempts since 12y ago; this cycle's ask has dropped $25k (10%) from the opening price — seller is motivated, your offer sets the floor, not the list.
- Current owner paid $112k; list at $215k implies a 92% gain — meaningful room to come down on a strong offer.
Risks & watch-outs
- Climate carrying-cost: extreme-heat days projected 7→20/yr by 2055 (HVAC capex compounding) — expect insurance premiums to compound above CPI over the hold.
Questions for the listing agent
- What does the HOA fee cover, when was the last increase, and are there any pending special assessments or reserve-fund shortfalls?
- Is there a deadline driving the sale (1031 exchange, divorce, estate, relocation)? That informs how much negotiation room exists.
- What's the average days-on-market for RENTAL listings here right now (not sales)? A rising rental-DOM trend means longer vacancies and softer asking-rent achievability than the comps imply.
- What's the recent tenant-quality profile in this submarket — average credit score on applications, eviction rate, late-payment / NSF rate, and stable-employment percentage? A property-management company in the area should have these aggregated.
- How much new for-sale + rental construction is in the pipeline within 1–3 miles? Heavy new supply typically softens prices + rents 12–24 months out; constrained supply supports both.
Investment metrics
- 1% rule
- 1.03% ✓
- Cap rate
- 8.07%
- Cash-on-cash
- 6.35%
- DSCR
- 1.28
- GRM
- 8.1
CMA / ARV
- ARV (on-the-fly)
- $254,475
- Comps found
- 12
Show comp detail 12 sales within ~0.75 mi
| Address | Dist | Beds/Ba | Sqft | Sold | Price | $/sf | Match |
|---|---|---|---|---|---|---|---|
| 2414 Breezy Point Ln | 0.06mi | 3/1.5 | 1,312 (+0%) | 10mo | $225,000 | $171 | 86 |
| 2424 Beaujolais Dr | 0.13mi | 3/1.5 | 1,440 (+10%) | 2mo | $275,000 | $191 | 73 |
| 2402 Brookfield Ln | 0.18mi | 3/2.0 | 1,400 (+7%) | 3mo | $250,000 | $179 | 73 |
| 2439 Beaujolais Dr | 0.12mi | 3/2.0 | 1,413 (+8%) | 11mo | $274,900 | $195 | 67 |
| 13 Merribrook Ct | 0.20mi | 3/2.0 | 1,451 (+11%) | 1mo | $314,500 | $217 | 67 |
| 633 Durango | 0.50mi | 3/2.0 | 1,346 (+3%) | 7mo | $297,500 | $221 | 62 |
| 2403 Brookfield Ln | 0.16mi | 3/2.5 | 1,462 (+12%) | 12mo | $235,000 | $161 | 57 |
| 10 Winter Hill Ct | 0.49mi | 3/2.5 | 1,400 (+7%) | 7mo | $265,000 | $189 | 53 |
| 2307 Longmont Dr | 0.41mi | 2/3.0 (-1) | 1,232 (-6%) | 12mo | $250,000 | $203 | 48 |
| 1814 Springhill Dr | 0.74mi | 3/1.0 | 1,188 (-9%) | 6mo | $278,000 | $234 | 46 |
| 108 Mill Pond Dr | 0.70mi | 3/1.0 | 1,188 (-9%) | 8mo | $249,999 | $210 | 45 |
| 12 Mallard Pointe Dr | 0.42mi | 2/2.5 (-1) | 1,476 (+13%) | 7mo | $255,000 | $173 | 42 |
Match score weights: distance 35% · size 25% · config 20% · recency 20%. Top-matched comps best support the ARV.
Projected returns pro-forma
-3.0% appreciation · 1.59% rent growth · sell at horizon
- IRR
- -8.1%
- Equity multiple
- 0.71×
- Total profit
- $-17,640
- Equity at exit
- $32,057
- IRR
- -0.4%
- Equity multiple
- 0.97×
- Total profit
- $-1,560
- Equity at exit
- $18,589
Cash invested: $60,200 (down + closing). Projections, not guarantees.
Landlord ↔ Tenant lean methodology
- Overall (STATE)
- 81 Strongly Landlord-Friendly
- State Missouri
- 81 Strongly Landlord-Friendly · R+10
- County
- — inherits STATE
- City
- — inherits STATE
ZIP-level market 63368
- Home prices YoY
- -20.7%
- Rents YoY
- 1.6%
- Active inventory
- 374
- Price-to-rent
- 8.1×
Monthly cashflow live
- Estimated rent
- $2,205 high interval (Pro) →
- Mortgage (P&I)
- −$1,127
- Tax from tax record
- −$203 /mo · $2,436/yr
- Insurance
- −$90
- HOA
- −$3
- Vacancy / Maint / Mgmt
- −$463
- Net cashflow
- $319
Break-even live
Sensitivity live
| Price | -10% $440 | -5% $379 | +0% $319 | +5% $258 | +10% $197 |
|---|---|---|---|---|---|
| Rent | -10% $144 | -5% $231 | +0% $319 | +5% $406 | +10% $493 |
| Rate | -1.0pp $427 | -0.5pp $373 | base $319 | +0.5pp $263 | +1.0pp $206 |
UW: 25.0% down · 7.5% · 30yr · 1.5% tax · 5.0% vac · 8.0% maint · 8.0% mgmt
Financing live
Cash to close
- Down payment
- $53,750
- Closing costs
- $6,450
- Reserves months
- —
- Total cash needed
- —
Loan-product check · same deal, 3 products live
Conventional
25% down · 7.5% · 30yr
- Down + closing
- —
- Monthly P&I
- —
- Monthly cashflow
- —
- DSCR
- —
- Eligible?
- —
Personal DTI + credit; lowest rate.
DSCR
20% down · 8.5% · 30yr
- Down + closing
- —
- Monthly P&I
- —
- Monthly cashflow
- —
- DSCR
- —
- Eligible?
- —
No personal income docs; deal must DSCR.
Hard money
10% down · 12.0% · 12mo
- Down + closing
- —
- Monthly P&I
- —
- Monthly cashflow
- —
- DSCR
- —
- Eligible?
- —
Short-term bridge; refi at stabilization.
Rent comps 7 comps
| Address | Beds | Baths | Sqft | Rent | $/sqft | DOM | Units | Dist |
|---|---|---|---|---|---|---|---|---|
| 209 Royallsprings Pkwy O Fallon, MO | 3.0 | 2.5 | 1512 | $2,491 | $1.65 | 8d | 1 | 0.63mi |
| 381 Erin Dr Saint Peters, MO | 3.0 | 2.5 | 1288 | $2,500 | $1.94 | 24d | 1 | 0.70mi |
| 256 Cherrywood Parc Dr O Fallon, MO | 3.0 | 2.5 | 1590 | $2,276 | $1.43 | 4d | 1 | 0.85mi |
| 172 Weatherby Landing Dr O Fallon, MO | 3.0 | 2.5 | 1748 | $2,300 | $1.32 | 24d | 1 | 0.95mi |
| 25 Joan Dr Saint Peters, MO | 2.0 | 1.0 | 950 | $1,700 | $1.79 | 24d | 1 | 0.96mi |
| 106 Laura Dr Saint Peters, MO | 2.0 | 1.0 | 1286 | $1,650 | $1.28 | 12d | 1 | 1.06mi |
| 1000 Bramblett Xing O'Fallon, MO | 1.0–2.0 | 1.0–2.0 | 997 | $1,945 | $1.95 | 4d | 15 | 1.48mi |
HOA detail
- Monthly dues
- $3 · $36/yr
Listing history 17 events
-
2026-06-18days on market $215,000 Active 22 DOM
-
2026-06-17pricedays on market $215,000 Active 21 DOM
-
2026-06-16days on market $229,900 Active 20 DOM
-
2026-06-15days on market $229,900 Active 19 DOM
-
2026-06-13pricedays on market $229,900 Active 17 DOM
-
2026-06-09days on market $240,000 Active 13 DOM
-
2026-06-08days on market $240,000 Active 12 DOM
-
2026-06-07days on market $240,000 Active 11 DOM
-
2026-06-03days on market $240,000 Active 7 DOM
-
2026-06-02days on market $240,000 Active 6 DOM
-
2026-06-01days on market $240,000 Active 5 DOM
-
2026-05-31days on market $240,000 Active 4 DOM
-
2026-05-27$240,000 Active
-
2014-08-21soldstatus
-
2014-06-18$115,900
-
2004-12-09soldstatus $112,000
-
1992-07-01soldstatus $51,900
ⓘ Source: listings_history table (triggers on properties + properties_extension) + one-shot
backfill from property_details.listing_events for pre-trigger history.
Tax reassessment forecast MO · Resets to sale price
- Current annual tax
- $2,436 · $203/mo
- Projected year-2 tax
- $2,436 · $203/mo
- Expected delta
- $0/yr ($0/mo · 0.0%)
ⓘ Screening estimate from a state-policy table — verify with the county assessor before closing.
Climate risk First Street
- Flood 1/10 Low FEMA zone X (unshaded) · 0% chance over 30 yrs
- Wildfire 1/10 Low
- Heat 5/10 Major 7 d/yr ≥107°F today · 20 d/yr by 30 yrs out
- Wind 2/10 Low 100% chance of damaging wind over 30 yrs
- Air quality 2/10 Low 1 unhealthy d/yr today · 1 by 30 yrs out
Nearby sold comps map
Loading sold comps map…
Walkable amenities ~0.75 mi
Loading nearby amenities…
Taxation est. · year 1
- Rental income
- $26,455
- − Mortgage interest
- −$12,043
- − Property taxes
- −$2,436
- − Insurance
- −$1,075
- − Repairs & maintenance
- −$2,116
- − Management
- −$2,116
- − HOA
- −$36
- − Depreciation
- −$6,255
- Taxable income
- $377
- Est. tax owed @ 24.0%
- −$91
- After-tax cash flow
- $3,732/yr
For passive investors: Depreciation is non-cash, so a rental often shows a tax loss while cash-flowing — sheltering income. Rental losses are passive: they offset passive income freely, and up to $25,000/yr can offset ordinary (W-2) income if you actively participate and your MAGI is under $100k (phasing out to $0 by $150k); unused losses carry forward. On sale, claimed depreciation is recaptured at up to 25%, and gains may owe capital-gains tax (a 1031 exchange can defer both). Figures are a year-1 estimate at your 24.0% rate — not tax advice; consult a CPA.
Schools (NCES district)
- District
- Ft. Zumwalt R-II
- NCES district ID
- 2908370
- Math proficiency
- 54% ▼ -7.00%
- Reading proficiency
- 60% ▼ -4.00%
- Median HH income
- $75,817
- Composite
- 51.04/100
- National rank
- #1772
- State rank
- #14 of 324 in MO
Livability — O'Fallon
No livability data for this city. (Only ~50 U.S. cities are tracked.)
Census & demographics
- County
- Saint Charles County · 399,703 people
- City population
- 45,862
- Metro
- St. Louis, MO-IL
- Population (ZIP)
- 46,966
- Household income
- $124,297
- Rent vs Own
- Severe rent burden
- 538.0
Population outlook (St. Charles County) Hauer SSP2
- Today (2025)
- 437,857 people
- By 2030
- 461,707 · +5.4%
- By 2040
- 503,222 · +14.9%
- By 2050
- 534,684 · +22.1%
- By 2075
- 597,047 · +36.4%
- By 2100
- 609,682 · +39.2%
Race, ethnicity, and origin ACS 2023
- Neighborhood character
- Predominantly White (84%)
- Race & ethnicity
- White 84% Asian 5% Two or more races 5% Black 4% Hispanic / Latino 3%
- Common ancestry
- Romanian 4% Lithuanian 3% Italian 2%
- Foreign-born
- 6% · Canada, China
- Languages at home
- 93% English-only · Other Asian/Pacific 2% Spanish 2% Other Indo-European 2%
Political lean MEDSL · St. Charles
- 2024 margin
- R (+17.0) · D 40.8% · R 57.8% · Other 1.4%
- 2008→2024 swing
- -7.2pp toward R · 2008: -9.7pp · 2024: -17.0pp
- All cycles
- 2024: R+17.0 2020: R+17.5 2016: R+26.4 2012: R+21.0 2008: R+9.7
Not yet ingested
- Civics
- —
Market trends
- HPI YoY
- ▼ -57.32%
- Current HPI
- 219.7731
- Rent YoY
- ▲ 1.59%
- Metro
- St. Louis, MO-IL
- State GDP YoY
- ▲ 1.84%
- F500 in state
- 20
Industry mix (Fortune 500 HQ in MO)
| Industry | F500 HQs | Revenue |
|---|---|---|
| Healthcare | 1 | $163B |
|
||
| Insurance | 1 | $21B |
|
||
| Industrial Technology | 1 | $17B |
|
||
| Retail | 1 | $16B |
|
||
| Industrial Distribution | 1 | $10B |
|
||
| Utilities | 1 | $9B |
|
||
Price history
+362.4% since first listed5 events — show timeline
- 2026-05-27 Listed $240,000 MARIS as Distributed by MLS Grid
- 2014-08-21 Sold (MLS) — MARIS as Distributed by MLS Grid
- 2014-06-18 Listed $115,900 MARIS as Distributed by MLS Grid
- 2004-12-09 Sold (Public Records) $112,000 Public Records
- 1992-07-01 Sold (Public Records) $51,900 Public Records
Property tax history
+4.7%/yrLatest (2025): $2,436 · +3.0% YoY. Source: county tax records.
Cash-flow waterfall
monthlySold comps — $/sqft
last 12 mo · ≤1 miLoading sold comps…