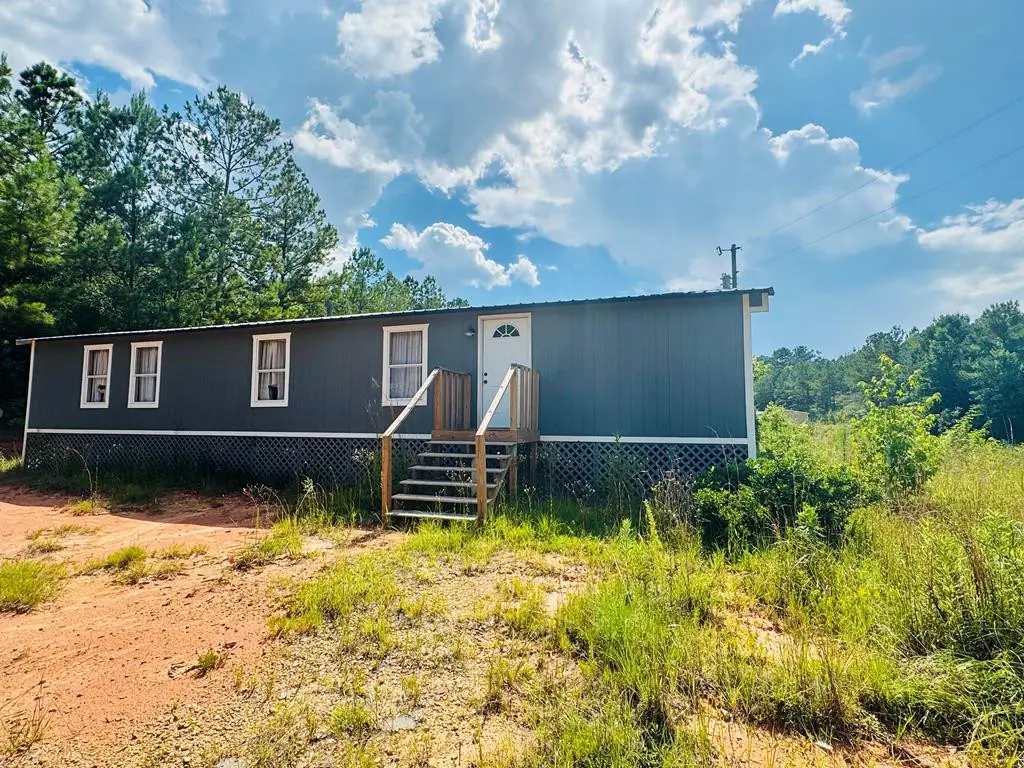
1031 Beck · Fernwood, MS
Flood risk 1/10 · Minimal
- FEMA flood zone
- X (unshaded)
- Chance of flooding over 30 yrs
- 0.0%
- Est. flood insurance / yr
- $507 – $1,088
Fire risk 8/10 · Major
- Est. fire insurance / yr
- $1,241 – $2,305
Heat risk 8/10 · Major
- Hot days now (above 108°F)
- 7 days/yr
- Hot days in 30 yrs
- 20 days/yr
Wind risk 8/10 · Major
- Chance of severe wind over 30 yrs
- 98.0%
Air-quality risk 1/10 · Minimal
- Unhealthy air days now
- 0 days/yr
- Unhealthy air days in 30 yrs
- 0 days/yr
Risk factors via First Street. Map © Google.
Why this score? — see what drove the C+ grade
The composite is a weighted blend of 9 inputs, each scored 0–100. Each bar is that input's sub-score; the figure is the points it added to the 100-point composite (weight × sub-score).
- Cash flow +30.0/30.0
- DSCR +10.0/10.0
- ARV discount +7.5/15.0
- 1% rule +7.4/10.0
- Rent growth +2.5/5.0
- Livability +2.5/5.0
- Condition / age +2.5/5.0
- Schools +1.3/10.0
- Appreciation +0.0/10.0
$72,000
🖨 Deal sheet 📄 Offer letter ✓ Due diligence
Listing remarks MLS
Discover this charmingly renovated bedroom 2 bath mobile home nestled on a spacious 1.33 acre lot. Built in 2005 and thoughtfully updated, this home offers the perfect blend of modern convenience and peaceful country living. This home features open floor plan with new flooring, fresh paint, new roofing and updated kitchen and baths. Great starter home or retirement cottage . Come settle in at this adorable home today as a place to call your own.
Key facts
- Open floor plan
- Fresh paint
- New flooring
Tags
Neighborhood map
What this means for you Summary
Snapshot
- This is a 2-bed/2.0-bath manufactured listed at $72k.
Deal economics
- At list price, monthly cash flow is $279 ($3k/yr) — positive.
- The deal already cash-flows at list — no discount required.
- Meets the 1% rule at list price ($894 rent vs $72k).
- Recommended offer: $63k (12.0% below list) — sets the bar for market timing.
Location & tenants
- Location reads: area grade C — affects rentability + tenant quality, not the cash-flow math above.
- South Pike School District (rural): math 12% / reading 21% proficiency, ranked #105 of 130 in MS (top 81%) — low school quality limits family demand, transient renter base, plan for 1-2y turnover; 92% free/reduced lunch — lower-income household profile, screen leases tightly.
- Market conditions: 190 active listings in the ZIP; 10 units permitted in Pike County in 2024 (0 in 5+ unit buildings).
Forward outlook
- Local home prices are declining (-3.0%/yr); year-one equity from $498 of loan paydown is wiped out by about $2k of value loss. Plan a longer hold.
- Pike County population projected at -14% by 2050 — secular population decline; favor cash flow + early exit over multi-decade hold.
- At projected returns (-3.0% appreciation + 3.0% rent growth), your $20k cash investment doubles in ~8 years — after that, you're playing with house money.
Negotiation context
- It's been on market 318 days — a 12% lower offer ($63k) is reasonable based on typical stale-listing flexibility.
- 2 sale attempts since 5y ago with the ask held roughly flat each time — persistent listings suggest the price (not the market) is what's stuck; bring a comps-based counter.
Risks & watch-outs
- Climate carrying-cost: severe wind risk, 98% chance of damaging wind over 30y; severe wildfire risk; extreme-heat days projected 7→20/yr by 2055 (HVAC capex compounding) — expect insurance premiums to compound above CPI over the hold.
Questions for the listing agent
- It's been on market 318 days. Have you received any prior offers? Is the seller open to a 12% concession, seller financing, or rate buy-down credit?
- Why hasn't it sold? Are there any deal-killer items the seller is aware of (foundation, flood, title, zoning, code violations)?
- Is there a deadline driving the sale (1031 exchange, divorce, estate, relocation)? That informs how much negotiation room exists.
- What's the average days-on-market for RENTAL listings here right now (not sales)? A rising rental-DOM trend means longer vacancies and softer asking-rent achievability than the comps imply.
- What's the recent tenant-quality profile in this submarket — average credit score on applications, eviction rate, late-payment / NSF rate, and stable-employment percentage? A property-management company in the area should have these aggregated.
- How much new for-sale + rental construction is in the pipeline within 1–3 miles? Heavy new supply typically softens prices + rents 12–24 months out; constrained supply supports both.
Investment metrics
- 1% rule
- 1.24% ✓
- Cap rate
- 10.94%
- Cash-on-cash
- 16.61%
- DSCR
- 1.74
- GRM
- 6.7
CMA / ARV
No comps found within radius.
Projected returns pro-forma
-3.0% appreciation · 3.0% rent growth · sell at horizon
- IRR
- 7.7%
- Equity multiple
- 1.30×
- Total profit
- $6,070
- Equity at exit
- $10,735
- IRR
- 16.9%
- Equity multiple
- 2.39×
- Total profit
- $28,043
- Equity at exit
- $6,225
Cash invested: $20,160 (down + closing). Projections, not guarantees.
Landlord ↔ Tenant lean methodology
- Overall (STATE)
- 90 Strongly Landlord-Friendly
- State Mississippi
- 90 Strongly Landlord-Friendly · R+11
- County
- — inherits STATE
- City
- — inherits STATE
ZIP-level market 39648
- Active inventory
- 190
- Price-to-rent
- 6.7×
Monthly cashflow live
- Estimated rent
- $894 medium interval (Pro) →
- Mortgage (P&I)
- −$378
- Tax from tax record
- −$20 /mo · $234/yr
- Insurance
- −$30
- HOA
- −$0
- Vacancy / Maint / Mgmt
- −$188
- Net cashflow
- $279
Break-even live
UW: 25.0% down · 7.5% · 30yr · 1.5% tax · 5.0% vac · 8.0% maint · 8.0% mgmt
Financing live
Cash to close
- Down payment
- $18,000
- Closing costs
- $2,160
- Reserves months
- —
- Total cash needed
- —
Loan-product check · same deal, 3 products live
Conventional
25% down · 7.5% · 30yr
- Down + closing
- —
- Monthly P&I
- —
- Monthly cashflow
- —
- DSCR
- —
- Eligible?
- —
Personal DTI + credit; lowest rate.
DSCR
20% down · 8.5% · 30yr
- Down + closing
- —
- Monthly P&I
- —
- Monthly cashflow
- —
- DSCR
- —
- Eligible?
- —
No personal income docs; deal must DSCR.
Hard money
10% down · 12.0% · 12mo
- Down + closing
- —
- Monthly P&I
- —
- Monthly cashflow
- —
- DSCR
- —
- Eligible?
- —
Short-term bridge; refi at stabilization.
Listing history 20 events
-
2026-06-18days on market $72,000 Active 318 DOM
-
2026-06-17days on market $72,000 Active 317 DOM
-
2026-06-16days on market $72,000 Active 316 DOM
-
2026-06-15days on market $72,000 Active 315 DOM
-
2026-06-13days on market $72,000 Active 313 DOM
-
2026-06-12days on market $72,000 Active 312 DOM
-
2026-06-09days on market $72,000 Active 309 DOM
-
2026-06-08days on market $72,000 Active 308 DOM
-
2026-06-07days on market $72,000 Active 307 DOM
-
2026-06-07days on market $72,000 Active 306 DOM
-
2026-06-04days on market $72,000 Active 303 DOM
-
2026-06-02days on market $72,000 Active 302 DOM
-
2026-06-01days on market $72,000 Active 301 DOM
-
2026-05-31days on market $72,000 Active 300 DOM
-
2025-07-08$72,000 Active 449-char remark
Show marketing remark (449 chars)
Discover this charmingly renovated bedroom 2 bath mobile home nestled on a spacious 1.33 acre lot. Built in 2005 and thoughtfully updated, this home offers the perfect blend of modern convenience and peaceful country living. This home features open floor plan with new flooring, fresh paint, new roofing and updated kitchen and baths. Great starter home or retirement cottage . Come settle in at this adorable home today as a place to call your own.
-
2021-11-09soldstatus 85-char remark
Show marketing remark (85 chars)
Fixer-upper mobile home situated on 1.3 acres in a country setting. Open floor plan.
-
2021-04-24$25,000 85-char remark
Show marketing remark (85 chars)
Fixer-upper mobile home situated on 1.3 acres in a country setting. Open floor plan.
-
2020-11-12soldstatus
-
2009-01-30soldstatus
-
2006-01-30soldstatus
ⓘ Source: listings_history table (triggers on properties + properties_extension) + one-shot
backfill from property_details.listing_events for pre-trigger history.
Tax reassessment forecast MS · Resets to sale price
- Current annual tax
- $234 · $20/mo
- Projected year-2 tax
- $569 · $47/mo
- Expected delta
- +$335/yr (+$28/mo · 142.8%)
ⓘ Screening estimate from a state-policy table — verify with the county assessor before closing.
Climate risk First Street
- Flood 1/10 Low FEMA zone X (unshaded) · 0% chance over 30 yrs
- Wildfire 8/10 Severe
- Heat 8/10 Severe 7 d/yr ≥108°F today · 20 d/yr by 30 yrs out
- Wind 8/10 Severe 98% chance of damaging wind over 30 yrs
- Air quality 1/10 Low 0 unhealthy d/yr today · 0 by 30 yrs out
Nearby sold comps map
Loading sold comps map…
Walkable amenities ~0.75 mi
Loading nearby amenities…
Taxation est. · year 1
- Rental income
- $10,725
- − Mortgage interest
- −$4,033
- − Property taxes
- −$234
- − Insurance
- −$360
- − Repairs & maintenance
- −$858
- − Management
- −$858
- − Depreciation
- −$2,095
- Taxable income
- $2,287
- Est. tax owed @ 24.0%
- −$549
- After-tax cash flow
- $2,799/yr
For passive investors: Depreciation is non-cash, so a rental often shows a tax loss while cash-flowing — sheltering income. Rental losses are passive: they offset passive income freely, and up to $25,000/yr can offset ordinary (W-2) income if you actively participate and your MAGI is under $100k (phasing out to $0 by $150k); unused losses carry forward. On sale, claimed depreciation is recaptured at up to 25%, and gains may owe capital-gains tax (a 1031 exchange can defer both). Figures are a year-1 estimate at your 24.0% rate — not tax advice; consult a CPA.
Schools (NCES district)
- District
- South Pike School District
- NCES district ID
- 2804080
- Math proficiency
- 12% ▼ -14.00%
- Reading proficiency
- 21% ▼ -3.00%
- Median HH income
- $29,674
- Composite
- 13.04/100
- National rank
- #9566
- State rank
- #105 of 130 in MS
Livability — Fernwood
No livability data for this city. (Only ~50 U.S. cities are tracked.)
Census & demographics
- Population (ZIP)
- 19,767
Population outlook (Pike County) Hauer SSP2
- Today (2025)
- 38,766 people
- By 2030
- 37,874 · -2.3%
- By 2040
- 35,743 · -7.8%
- By 2050
- 33,276 · -14.2%
- By 2075
- 26,799 · -30.9%
- By 2100
- 18,562 · -52.1%
Race, ethnicity, and origin ACS 2023
- Neighborhood character
- Majority Black (64%)
- Race & ethnicity
- Black 64% White 32% Two or more races 2% Hispanic / Latino 2%
- Common ancestry
- Slovak 2% Lithuanian 1% Italian 1%
- Foreign-born
- 1%
- Languages at home
- 98% English-only · Spanish 1%
Political lean MEDSL · Pike
- 2024 margin
- Toss-up / Even · D 47.8% · R 51.3%
- 2008→2024 swing
- -7.0pp toward R · 2008: 3.5pp · 2024: -3.5pp
- All cycles
- 2024: R+3.5 2020: D+1.0 2016: R+0.7 2012: D+7.6 2008: D+3.5
Not yet ingested
- Civics
- —
Market trends
- HPI YoY
- ▼ -88.61%
- Current HPI
- 92.2495
- Rent YoY
- —
- Metro
- —
- State GDP YoY
- —
- F500 in state
- 0
Price history
+188.0% since first listed6 events — show timeline
- 2025-07-08 Listed $72,000 MLSU
- 2021-11-09 Sold (MLS) — MLSU
- 2021-04-24 Listed $25,000 MLSU
- 2020-11-12 Sold (Public Records) — Public Records
- 2009-01-30 Sold (Public Records) — Public Records
- 2006-01-30 Sold (Public Records) — Public Records
Property tax history
+1.2%/yrLatest (2025): $234 · -8.0% YoY. Source: county tax records.
Cash-flow waterfall
monthlySold comps — $/sqft
last 12 mo · ≤1 miLoading sold comps…