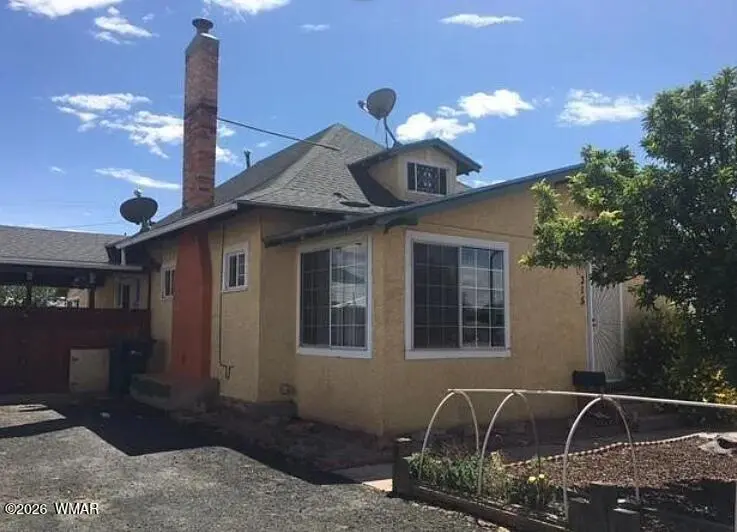
315 W Hopi Dr · Holbrook, AZ
Flood risk No data
- FEMA flood zone
- —
- Chance of flooding over 30 yrs
- —
- Est. flood insurance / yr
- —
Fire risk No data
- Est. fire insurance / yr
- —
Heat risk No data
- Hot days now (above threshold)
- —
- Hot days in 30 yrs
- —
Wind risk No data
- Chance of severe wind over 30 yrs
- —
Air-quality risk No data
- Unhealthy air days now
- —
- Unhealthy air days in 30 yrs
- —
Risk factors via First Street. Map © Google.
Why this score? — see what drove the D grade
The composite is a weighted blend of 9 inputs, each scored 0–100. Each bar is that input's sub-score; the figure is the points it added to the 100-point composite (weight × sub-score).
- Cash flow +10.1/30.0
- ARV discount +9.3/15.0
- Appreciation +9.0/10.0
- Livability +3.4/5.0
- DSCR +2.9/10.0
- Rent growth +2.5/5.0
- Condition / age +2.5/5.0
- 1% rule +2.1/10.0
- Schools +1.7/10.0
$164,900
🖨 Deal sheet (PDF) 📄 Offer letter ✓ Due diligence
Listing remarks MLS
Great investment property - 3 buildings. Home, Apartment and Barber/Beauty Shop with a fenced in yard. Downtown Holbrook
Key facts
- 7,405 sq ft lot
- Built 1915
- Listed 110 days
Neighborhood map
What this means for you Summary
Snapshot
- This is a 3-bed/1.0-bath single-family listed at $165k.
Deal economics
- At list price, monthly cash flow is $-95 ($-1k/yr) — negative.
- To cash-flow at today's rent, offer at most $148k (10.2% below list).
- To meet the 1% rule (rent ≥ 1% of price), the offer needs to be $118k (28.7% below list).
- Recommended offer: $118k (28.7% below list) — sets the bar for 1% rule.
Location & tenants
- Location reads 68/100 on livability (#57 in AZ) — a middle-class / working-renter tenant base. Strengths: cost of living A+, housing A+, health & safety A+; Watch: employment D+, crime D-, amenities F.
- Holbrook Unified District (4389) (town): math 16% / reading 25% proficiency, ranked #185 of 249 in AZ (top 74%) — low school quality limits family demand, transient renter base, plan for 1-2y turnover; 67% free/reduced lunch — lower-income household profile, screen leases tightly.
- Zoned schools: Hulet Elementary School (math 32% / reading 37%, grade F, #471 of 1,109 statewide, top 44%, 350 students, 65% FRL); Holbrook Junior High School (math 12% / reading 22%, grade F, #147 of 218 statewide, top 69%, 347 students, 83% FRL); Holbrook High School (math 17% / reading 22%, grade F, #232 of 381 statewide, top 63%, 660 students, 62% FRL) — zoned schools at 70% FRL track the district average.
- Market conditions: 46 active listings in the ZIP; 1 comparable units currently listed for rent nearby; 485 units permitted in Navajo County in 2024 (11 in 5+ unit buildings).
Forward outlook
- In year one you build about $14k of equity ($1k loan paydown + $13k appreciation (8.0% local appreciation)).
- Navajo County population projected at -16% by 2050 — secular population decline; favor cash flow + early exit over multi-decade hold.
- By year 3, paydown + projected appreciation supports a ~$36k cash-out refi (75% LTV) — recoverable capital for the next deal without selling this one.
Negotiation context
- It's been on market 111 days — a 9% lower offer ($150k) is reasonable based on typical stale-listing flexibility.
Risks & watch-outs
- Watch-outs: built in 1915 — expect roof / HVAC / electrical / plumbing capex.
Questions for the listing agent
- What do current leases actually rent for vs. the listed asking? Can we see a recent rent roll and the last 12 months of T-12 income?
- It's been on market 111 days. Have you received any prior offers? Is the seller open to a 29% concession, seller financing, or rate buy-down credit?
- Built in 1915 — when were the roof, HVAC, electrical panel, plumbing, and water heater last replaced?
- Why hasn't it sold? Are there any deal-killer items the seller is aware of (foundation, flood, title, zoning, code violations)?
- Is there a deadline driving the sale (1031 exchange, divorce, estate, relocation)? That informs how much negotiation room exists.
- Crime grade is D in this area — have there been break-ins, vandalism, or insurance claims at this property in the last 3 years? What carrier currently insures it and at what premium?
- The area grade is low — what's the realistic commute time and amenity access for the typical tenant pool here? Any planned neighborhood developments (good or bad) we should know about?
- What's the average days-on-market for RENTAL listings here right now (not sales)? A rising rental-DOM trend means longer vacancies and softer asking-rent achievability than the comps imply.
- What's the recent tenant-quality profile in this submarket — average credit score on applications, eviction rate, late-payment / NSF rate, and stable-employment percentage? A property-management company in the area should have these aggregated.
- How much new for-sale + rental construction is in the pipeline within 1–3 miles? Heavy new supply typically softens prices + rents 12–24 months out; constrained supply supports both.
Investment metrics
- 1% rule
- 0.71% ✗
- Cap rate
- 5.60%
- Cash-on-cash
- -2.47%
- DSCR
- 0.89
- GRM
- 11.7
CMA / ARV
- ARV (median comp)
- $171,896
- List price
- $164,900
- Delta
- -4.07%
- Verdict
- FAIR
- Comps
- 20 within 1.0 mi
Show comp detail 4 sales within ~0.75 mi
| Address | Dist | Beds/Ba | Sqft | Sold | Price | $/sf | Match |
|---|---|---|---|---|---|---|---|
| 318 W Buffalo St | 0.19mi | 2/1.0 (-1) | 978 (+5%) | 4mo | $170,000 | $174 | 74 |
| 192 N 7th St | 0.70mi | 2/1.0 (-1) | 911 (-2%) | 6mo | $165,000 | $181 | 54 |
| 207 W Hampshire St | 0.43mi | 2/1.0 (-1) | 874 (-6%) | 20mo | $170,000 | $195 | 49 |
| 153 N 2Nd St | 0.36mi | 2/1.0 (-1) | 1,059 (+14%) | 23mo | $139,000 | $131 | 36 |
Match score weights: distance 35% · size 25% · config 20% · recency 20%. Top-matched comps best support the ARV.
Projected returns pro-forma
8.03% appreciation · 3.0% rent growth · sell at horizon
- IRR
- 18.2%
- Equity multiple
- 2.35×
- Total profit
- $62,131
- Equity at exit
- $125,616
- IRR
- 17.2%
- Equity multiple
- 5.00×
- Total profit
- $184,670
- Equity at exit
- $249,670
Cash invested: $46,172 (down + closing). Projections, not guarantees.
Landlord ↔ Tenant lean methodology
- Overall (STATE)
- 87 Strongly Landlord-Friendly
- State Arizona
- 87 Strongly Landlord-Friendly · R+3
- County
- — inherits STATE
- City
- — inherits STATE
ZIP-level market 86025
- Home prices YoY
- 2.9%
- Active inventory
- 46
- Price-to-rent
- 11.7×
Monthly cashflow live
- Estimated rent
- $1,175 medium interval (Pro) →
- Mortgage (P&I)
- −$865
- Tax from tax record
- −$90 /mo · $1,080/yr
- Insurance
- −$69
- HOA
- −$0
- Vacancy / Maint / Mgmt
- −$247
- Net cashflow
- $-95
Break-even live
Sensitivity live
| Price | -10% $-2 | -5% $-49 | +0% $-95 | +5% $-142 | +10% $-189 |
|---|---|---|---|---|---|
| Rent | -10% $-188 | -5% $-142 | +0% $-95 | +5% $-49 | +10% $-2 |
| Rate | -1.0pp $-12 | -0.5pp $-53 | base $-95 | +0.5pp $-138 | +1.0pp $-181 |
UW: 25.0% down · 7.5% · 30yr · 1.5% tax · 5.0% vac · 8.0% maint · 8.0% mgmt
Financing live
Cash to close
- Down payment
- $41,225
- Closing costs
- $4,947
- Reserves months
- —
- Total cash needed
- —
Loan-product check · same deal, 3 products live
Conventional
25% down · 7.5% · 30yr
- Down + closing
- —
- Monthly P&I
- —
- Monthly cashflow
- —
- DSCR
- —
- Eligible?
- —
Personal DTI + credit; lowest rate.
DSCR
20% down · 8.5% · 30yr
- Down + closing
- —
- Monthly P&I
- —
- Monthly cashflow
- —
- DSCR
- —
- Eligible?
- —
No personal income docs; deal must DSCR.
Hard money
10% down · 12.0% · 12mo
- Down + closing
- —
- Monthly P&I
- —
- Monthly cashflow
- —
- DSCR
- —
- Eligible?
- —
Short-term bridge; refi at stabilization.
Rent comps 1 comps
| Address | Beds | Baths | Sqft | Rent | $/sqft | DOM | Units | Dist |
|---|---|---|---|---|---|---|---|---|
| 406 N 1st Ave Unit 406 Holbrook, AZ | 3.0 | 1.0 | 1106 | $1,175 | $1.06 | 15d | 1 | 0.38mi |
Listing history 20 events
-
2026-06-22days on market $164,900 Active 111 DOM
-
2026-06-21days on market $164,900 Active 110 DOM
-
2026-06-19days on market $164,900 Active 108 DOM
-
2026-06-18days on market $164,900 Active 107 DOM
-
2026-06-17days on market $164,900 Active 106 DOM
-
2026-06-16days on market $164,900 Active 105 DOM
-
2026-06-15days on market $164,900 Active 104 DOM
-
2026-06-14days on market $164,900 Active 102 DOM
-
2026-06-12days on market $164,900 Active 101 DOM
-
2026-06-09days on market $164,900 Active 98 DOM
-
2026-06-08days on market $164,900 Active 97 DOM
-
2026-06-07days on market $164,900 Active 96 DOM
-
2026-06-05days on market $164,900 Active 94 DOM
-
2026-06-04days on market $164,900 Active 92 DOM
-
2026-06-02days on market $164,900 Active 91 DOM
-
2026-06-01days on market $164,900 Active 90 DOM
-
2026-05-31days on market $164,900 Active 89 DOM
-
2026-05-31days on market $164,900 Active 88 DOM
-
2026-03-03$185,000 Active
-
2021-07-30soldstatus $260,000 120-char remark
Show marketing remark (120 chars)
Great investment property - 3 buildings. Home, Apartment and Barber/Beauty Shop with a fenced in yard. Downtown Holbrook
ⓘ Source: listings_history table (triggers on properties + properties_extension) + one-shot
backfill from property_details.listing_events for pre-trigger history.
Tax reassessment forecast AZ · Resets to sale price
- Current annual tax
- $1,080 · $90/mo
- Projected year-2 tax
- $1,088 · $91/mo
- Expected delta
- +$9/yr (+$1/mo · 0.8%)
ⓘ Screening estimate from a state-policy table — verify with the county assessor before closing.
Nearby sold comps map
Loading sold comps map…
Walkable amenities ~0.75 mi
Loading nearby amenities…
Taxation est. · year 1
- Rental income
- $14,100
- − Mortgage interest
- −$9,237
- − Property taxes
- −$1,080
- − Insurance
- −$824
- − Repairs & maintenance
- −$1,128
- − Management
- −$1,128
- − Depreciation
- −$4,797
- Taxable loss
- −$4,094
- Est. tax savings @ 24.0%
- +$983
- After-tax cash flow
- $-160/yr
For passive investors: Depreciation is non-cash, so a rental often shows a tax loss while cash-flowing — sheltering income. Rental losses are passive: they offset passive income freely, and up to $25,000/yr can offset ordinary (W-2) income if you actively participate and your MAGI is under $100k (phasing out to $0 by $150k); unused losses carry forward. On sale, claimed depreciation is recaptured at up to 25%, and gains may owe capital-gains tax (a 1031 exchange can defer both). Figures are a year-1 estimate at your 24.0% rate — not tax advice; consult a CPA.
Schools (NCES district)
- District
- Holbrook Unified District (4389)
- NCES district ID
- 0403820
- Math proficiency
- 16% ▼ -13.00%
- Reading proficiency
- 25% ▼ -10.00%
- Median HH income
- $34,437
- Composite
- 16.81/100
- National rank
- #9153
- State rank
- #185 of 249 in AZ
Livability — Holbrook
- Score
- 68/100
- State rank
- #57
- US rank
- #9938
Category grades
Schools grade is shown separately in the Schools card above.
Census & demographics
- Census place
- Holbrook, AZ
- Population (ZIP)
- 5,189
Population outlook (Navajo County) Hauer SSP2
- Today (2025)
- 105,760 people
- By 2030
- 103,301 · -2.3%
- By 2040
- 97,070 · -8.2%
- By 2050
- 88,850 · -16.0%
- By 2075
- 65,180 · -38.4%
- By 2100
- 37,281 · -64.7%
Race, ethnicity, and origin ACS 2023
- Neighborhood character
- Highly diverse neighborhood (Simpson 0.81)
- Race & ethnicity
- Native American 33% White 33% Hispanic / Latino 29% Two or more races 7% Black 4%
- Hispanic origin (detail)
- Mexican 20% Puerto Rican 3%
- Common ancestry
- Lithuanian 4% Serbian 3% Slovak 2%
- Foreign-born
- 2% · Canada
- Languages at home
- 73% English-only · Spanish 11% Chinese 1% German/W. Germanic 1%
Political lean MEDSL · Navajo
- 2024 margin
- R (+17.2) · D 40.9% · R 58.1%
- 2008→2024 swing
- -5.5pp toward R · 2008: -11.7pp · 2024: -17.2pp
- All cycles
- 2024: R+17.2 2020: R+8.2 2016: R+7.9 2012: R+8.4 2008: R+11.7
Not yet ingested
- Civics
- —
Market trends
- HPI YoY
- ▲ 8.03%
- Current HPI
- 281.0415
- Rent YoY
- —
- Metro
- —
- State GDP YoY
- ▲ 4.54%
- F500 in state
- 20
Industry mix (Fortune 500 HQ in AZ)
| Industry | F500 HQs | Revenue |
|---|---|---|
| Technology | 2 | $13B |
|
||
| Mining / Metals | 1 | $23B |
|
||
| Environmental Services | 1 | $16B |
|
||
| Metals / Steel | 1 | $14B |
|
||
| Technology Distribution | 1 | $9B |
|
||
| Homebuilding | 1 | $8B |
|
||
Price history
-28.8% since first listed2 events — show timeline
- 2026-03-03 Listed $185,000 WMMLS
- 2021-07-30 Sold (MLS) $260,000 WMMLS
Property tax history
+2.2%/yrLatest (2023): $1,080 · +2.2% YoY. Source: county tax records.
Cash-flow waterfall
monthlySold comps — $/sqft
last 12 mo · ≤1 miLoading sold comps…