 12-Plex
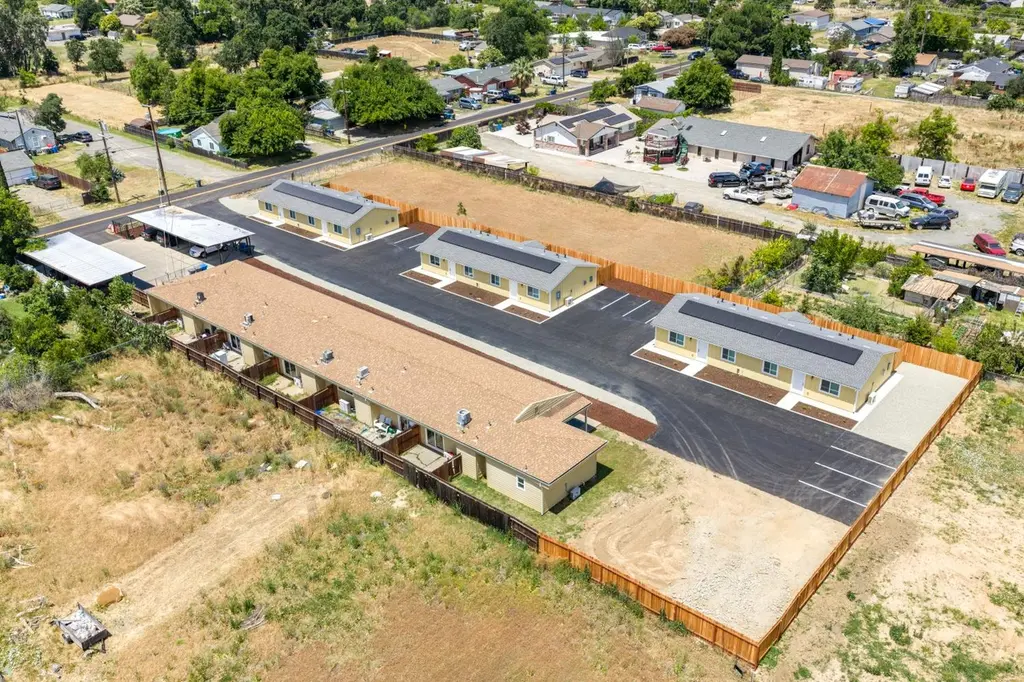
4693 Ardmore Ave · Olivehurst, CA
Flood risk 5/10 · Moderate
- FEMA flood zone
- X
- Chance of flooding over 30 yrs
- 0.24%
- Est. flood insurance / yr
- $507 – $1,088
Fire risk 7/10 · Major
- Est. fire insurance / yr
- $659 – $1,223
Heat risk 7/10 · Major
- Hot days now (above 104°F)
- 7 days/yr
- Hot days in 30 yrs
- 16 days/yr
Wind risk 1/10 · Minimal
- Chance of severe wind over 30 yrs
- —
Air-quality risk 10/10 · Severe
- Unhealthy air days now
- 27 days/yr
- Unhealthy air days in 30 yrs
- 31 days/yr
Risk factors via First Street. Map © Google.
Why this score? — see what drove the B- grade
The composite is a weighted blend of 9 inputs, each scored 0–100. Each bar is that input's sub-score; the figure is the points it added to the 100-point composite (weight × sub-score).
- Cash flow +30.0/30.0
- DSCR +10.0/10.0
- 1% rule +9.9/10.0
- ARV discount +7.5/15.0
- Condition / age +4.8/5.0
- Livability +2.9/5.0
- Rent growth +2.5/5.0
- Schools +1.8/10.0
- Appreciation +0.0/10.0
$2,050,000
🖨 Deal sheet 📄 Offer letter ✓ Due diligence
Multi-family units
County records classify this as Multi-Family (5+ Unit). Listing-text estimate: 12 units. confirmed
5+ unit building — per-unit beds/baths from public records are typically unavailable; the breakdown below (if shown) is an estimate from the listing text.
Listing remarks
Excellent investment opportunity in a quiet Olivehurst location. This 12-unit multifamily property consists of four separate buildings, including three newly constructed duplexes completed in 2026 and one 6-unit building that was fully renovated in 2019. The desirable unit mix includes eight 2-bed/1-bath units, two 1-bed/1-bath units, one 3-bed/2-bath unit, and one studio unit. The 6-unit building also features an on-site coin-operated laundry room, providing additional income potential and convenience for tenants. All units feature private fenced yards, providing added appeal for tenants. The property is well maintained with attractive landscaping and offers a strong combination of newer c
Key facts
- Quiet location
- Private fenced yards
- 0.92 acre lot
Tags
Property features AI
Finance
- HOA & community: No homeowners association
Exterior
- Parking: Covered parking with a total of 22 parking spaces, including 22 garage spaces
- Utilities: Internet available; Separate electric and gas meters; 220-volt electrical service; Public sewer; On-site water meter and water district service; Irrigation connected to public district
- Home design: Residential income property (apartments); Property configured as five-or-more units; Single-story building
- Construction: Apartment construction (details include energy-efficient construction elements)
- Exterior features: Shingle roof; Landscaped front yard
Interior
- Kitchen: Dishwasher, Microwave, Free standing electric range
- Bedrooms: Total of 12 residential units: mix includes multiple 1-, 2- and 3-bedroom units; Occupied units include two 1-bedroom units, eight 2-bedroom units, and one 3-bedroom unit
- Flooring: Laminate flooring
- Bathrooms: Varied by unit; examples include units with 1 full bath and one unit with 3 full and 2 partial baths
- Heating & cooling: Central heating and cooling; Ductless heating and cooling options
- Interior features: Dishwasher, Microwave, Free standing electric range; Energy-efficient appliances, insulation, construction, and cooling; Dual-pane full windows with screens; One-level layout (single story)
- Laundry & utility: Coin-operated laundry in each unit with washer/dryer hookups
Neighborhood map
What this means for you Summary
Snapshot
- This is a 12 × 21-bed/7.0-bath units multifamily listed at $2.05M. Condition is rated excellent.
Deal economics
- At list price, monthly cash flow is $10k ($119k/yr) — positive. Per door: $824/mo.
- The deal already cash-flows at list — no discount required.
- Meets the 1% rule at list price ($30k rent vs $2.05M).
- Cap rate 12.1% vs local median 3.8% in Olivehurst — top-decile yield for the area; either an underpriced asset or a hidden risk that comps aren't pricing in. Stress-test before assuming the spread holds.
Location & tenants
- Location reads 58/100 on livability (#679 in CA) — a working-class tenant base; expect higher turnover. Strengths: housing A+, commute A-; Watch: employment C-, schools F, crime F.
- Marysville Joint Unified (suburban): math 14% / reading 28% proficiency, ranked #455 of 517 in CA (top 88%) — low school quality limits family demand, transient renter base, plan for 1-2y turnover; 68% free/reduced lunch — lower-income household profile, screen leases tightly.
- Market conditions: 315 active listings in the ZIP; solid renter incomes; 750 units permitted in Yuba County in 2024 (41 in 5+ unit buildings).
- At $30,457/mo this rent would consume 408% of the median local household income ($90k/yr) (locally 461% of renters already pay >50% of income on rent) — very limited rent-growth headroom before tenants either downsize or default.
Forward outlook
- Local home prices are declining (-3.0%/yr); year-one equity from $14k of loan paydown is wiped out by about $62k of value loss. Plan a longer hold.
- Yuba County population projected to shrink 3% by 2050 — rents likely to lag national; underwrite the cash flow, not the appreciation.
- At projected returns (-3.0% appreciation + 3.0% rent growth), your $574k cash investment doubles in ~6 years — after that, you're playing with house money.
Negotiation context
- Only 5 days on market — expect competitive offers; lowballing is unlikely to land.
Risks & watch-outs
- Climate carrying-cost: moderate flood risk; major wildfire risk; extreme-heat days projected 7→16/yr by 2055 (HVAC capex compounding) — expect insurance premiums to compound above CPI over the hold.
Questions for the listing agent
- Can we see the unit-by-unit rent roll, current vacancy, and any below-market leases? What's the average tenancy length?
- What capital expenditures (roof, boiler, parking lot, exteriors) have been made in the last 5 years, and what's planned in the next 2?
- Is there a deadline driving the sale (1031 exchange, divorce, estate, relocation)? That informs how much negotiation room exists.
- Schools are F-rated, which usually means shorter tenancies and higher turnover. Who's the typical renter profile here, and what's been the actual vacancy rate?
- Crime grade is F in this area — have there been break-ins, vandalism, or insurance claims at this property in the last 3 years? What carrier currently insures it and at what premium?
- What's the average days-on-market for RENTAL listings here right now (not sales)? A rising rental-DOM trend means longer vacancies and softer asking-rent achievability than the comps imply.
- What's the recent tenant-quality profile in this submarket — average credit score on applications, eviction rate, late-payment / NSF rate, and stable-employment percentage? A property-management company in the area should have these aggregated.
- How much new apartment / multifamily construction is in the pipeline within 1–3 miles? Heavy new supply (>2% of stock underway) typically softens rents 12–24 months out; light construction supports rent growth.
Investment metrics
- 1% rule
- 1.49% ✓
- Cap rate
- 12.08%
- Cash-on-cash
- 20.68%
- DSCR
- 1.92
- GRM
- 5.6
CMA / ARV
No comps found within radius.
Projected returns pro-forma
-3.0% appreciation · 3.0% rent growth · sell at horizon
- IRR
- 13.0%
- Equity multiple
- 1.52×
- Total profit
- $298,422
- Equity at exit
- $305,662
- IRR
- 21.9%
- Equity multiple
- 2.87×
- Total profit
- $1,073,147
- Equity at exit
- $177,247
Cash invested: $574,000 (down + closing). Projections, not guarantees.
Landlord ↔ Tenant lean methodology
- Overall (STATE)
- 18 Strongly Tenant-Friendly
- State California
- 18 Strongly Tenant-Friendly · D+13
- County
- — inherits STATE
- City
- — inherits STATE
ZIP-level market 95961
- Home prices YoY
- -28.2%
- Active inventory
- 315
- Price-to-rent
- 67.3×
Monthly cashflow live
- Estimated rent
- $30,457 medium interval (Pro) →
- Mortgage (P&I)
- −$10,750
- Tax est. 1.5%
- −$2,562 /mo · $30,750/yr
- Insurance
- −$854
- HOA
- −$0
- Vacancy / Maint / Mgmt
- −$6,396
- Net cashflow
- $9,894
Break-even live
12-unit breakdown (identical units grouped — click to expand)
| Units | Beds | Baths | Est. rent |
|---|---|---|---|
| 12× units | 21 | 7 | $30,456 |
| #1 | 21 | 7 | $2,538 |
| #2 | 21 | 7 | $2,538 |
| #3 | 21 | 7 | $2,538 |
| #4 | 21 | 7 | $2,538 |
| #5 | 21 | 7 | $2,538 |
| #6 | 21 | 7 | $2,538 |
| #7 | 21 | 7 | $2,538 |
| #8 | 21 | 7 | $2,538 |
| #9 | 21 | 7 | $2,538 |
| #10 | 21 | 7 | $2,538 |
| #11 | 21 | 7 | $2,538 |
| #12 | 21 | 7 | $2,538 |
| Total (12 units) | $30,457 | ||
UW: 25.0% down · 7.5% · 30yr · 1.5% tax · 5.0% vac · 8.0% maint · 8.0% mgmt
Financing live
Cash to close
- Down payment
- $512,500
- Closing costs
- $61,500
- Reserves months
- —
- Total cash needed
- —
Loan-product check · same deal, 3 products live
Conventional
25% down · 7.5% · 30yr
- Down + closing
- —
- Monthly P&I
- —
- Monthly cashflow
- —
- DSCR
- —
- Eligible?
- —
Personal DTI + credit; lowest rate.
DSCR
20% down · 8.5% · 30yr
- Down + closing
- —
- Monthly P&I
- —
- Monthly cashflow
- —
- DSCR
- —
- Eligible?
- —
No personal income docs; deal must DSCR.
Hard money
10% down · 12.0% · 12mo
- Down + closing
- —
- Monthly P&I
- —
- Monthly cashflow
- —
- DSCR
- —
- Eligible?
- —
Short-term bridge; refi at stabilization.
Listing history 6 events
-
2026-06-13status $2,050,000 Pending 5 DOM
-
2026-06-10days on market $2,050,000 Active 5 DOM
-
2026-06-09days on market $2,050,000 Active 4 DOM
-
2026-06-08days on market $2,050,000 Active 3 DOM
-
2026-06-07remarks 699-char remark
-
2026-06-07$2,050,000 Active 2 DOM
ⓘ Source: listings_history table (triggers on properties + properties_extension) + one-shot
backfill from property_details.listing_events for pre-trigger history.
Climate risk First Street
- Flood 5/10 Major FEMA zone X · 24% chance over 30 yrs
- Wildfire 7/10 Severe
- Heat 7/10 Severe 7 d/yr ≥104°F today · 16 d/yr by 30 yrs out
- Wind 1/10 Low
- Air quality 10/10 Extreme 27 unhealthy d/yr today · 31 by 30 yrs out
Nearby sold comps map
Loading sold comps map…
Walkable amenities ~0.75 mi
Loading nearby amenities…
Taxation est. · year 1
- Rental income
- $365,484
- − Mortgage interest
- −$114,832
- − Property taxes
- −$30,750
- − Insurance
- −$10,250
- − Repairs & maintenance
- −$29,239
- − Management
- −$29,239
- − Depreciation
- −$59,636
- Taxable income
- $91,538
- Est. tax owed @ 24.0%
- −$21,969
- After-tax cash flow
- $96,758/yr
For passive investors: Depreciation is non-cash, so a rental often shows a tax loss while cash-flowing — sheltering income. Rental losses are passive: they offset passive income freely, and up to $25,000/yr can offset ordinary (W-2) income if you actively participate and your MAGI is under $100k (phasing out to $0 by $150k); unused losses carry forward. On sale, claimed depreciation is recaptured at up to 25%, and gains may owe capital-gains tax (a 1031 exchange can defer both). Figures are a year-1 estimate at your 24.0% rate — not tax advice; consult a CPA.
Condition & rehab AI · 7 photos
This 12-unit multifamily property is in excellent condition with no visible repairs needed. It offers a strong combination of newer construction and well-maintained units, making it an excellent investment opportunity.
Value-add opportunities
- Both Landscaping improvements — Enhanced landscaping can improve curb appeal and attract more tenants.
- Both Paint touch-ups — Fresh paint can make the property look more inviting and maintain its value.
- Both Window cleaning — Clean windows can make the property appear more attractive and maintain its value.
- Rental HVAC maintenance — A well-maintained HVAC system can attract more tenants and reduce maintenance costs.
- Rental Landscaping maintenance — Well-maintained landscaping can attract more tenants and maintain the property's value.
Renovation cost estimate screening
Value-add ROI direction
- Both Landscaping improvements — Enhanced landscaping can improve curb appeal and attract more tenants. ↑
- Both Paint touch-ups — Fresh paint can make the property look more inviting and maintain its value. ↑
- Both Window cleaning — Clean windows can make the property appear more attractive and maintain its value. ↑
- Rental HVAC maintenance — A well-maintained HVAC system can attract more tenants and reduce maintenance costs. ↑
- Rental Landscaping maintenance — Well-maintained landscaping can attract more tenants and maintain the property's value. ↑
ⓘ Cost ranges are severity-bucket heuristics (US national rule-of-thumb). Get contractor quotes + a written scope before underwriting a rehab budget.
Schools (NCES district)
- District
- Marysville Joint Unified
- NCES district ID
- 0624090
- Math proficiency
- 14% ▼ -13.00%
- Reading proficiency
- 28% ▼ -10.00%
- Median HH income
- $44,598
- Composite
- 18.18/100
- National rank
- #8961
- State rank
- #455 of 517 in CA
Livability — Olivehurst
- Score
- 58/100
- State rank
- #679
- US rank
- #20829
Category grades
Schools grade is shown separately in the Schools card above.
Census & demographics
- Census place
- Olivehurst, CA
- County
- Yuba County · 71,731 people
- City population
- 33,999
- Metro
- Yuba City, CA
- Population (ZIP)
- 33,999
- Household income
- $89,561
- Rent vs Own
- Severe rent burden
- 461.0
Population outlook (Yuba County) Hauer SSP2
- Today (2025)
- 75,432 people
- By 2030
- 75,358 · -0.1%
- By 2040
- 74,643 · -1.0%
- By 2050
- 72,937 · -3.3%
- By 2075
- 66,368 · -12.0%
- By 2100
- 54,524 · -27.7%
Race, ethnicity, and origin ACS 2023
- Neighborhood character
- Diverse neighborhood (Simpson 0.67)
- Race & ethnicity
- White 42% Hispanic / Latino 39% Two or more races 18% Asian 8% Black 4% Native American 1%
- Hispanic origin (detail)
- Mexican 32% Puerto Rican 2%
- Common ancestry
- Lithuanian 1% Slovak 1% Italian 1%
- Foreign-born
- 12% · Canada
- Languages at home
- 69% English-only · Spanish 23% Other Asian/Pacific 5% Russian/Polish/Slavic 1%
Political lean MEDSL · Yuba
- 2024 margin
- Strong R (+25.8) · D 35.7% · R 61.5% · Other 2.8%
- 2008→2024 swing
- -11.2pp toward R · 2008: -14.7pp · 2024: -25.8pp
- All cycles
- 2024: R+25.8 2020: R+21.6 2016: R+24.1 2012: R+19.5 2008: R+14.7
Not yet ingested
- Civics
- —
Market trends
- HPI YoY
- ▼ -87.37%
- Current HPI
- 222.3191
- Rent YoY
- —
- Metro
- Yuba City, CA
- State GDP YoY
- ▲ 3.21%
- F500 in state
- 116
Industry mix (Fortune 500 HQ in CA)
| Industry | F500 HQs | Revenue |
|---|---|---|
| Technology | 27 | $1,492B |
|
||
| Financial Services | 3 | $174B |
|
||
| Retail | 3 | $44B |
|
||
| Insurance | 3 | $26B |
|
||
| Media / Entertainment | 2 | $115B |
|
||
| Pharmaceuticals / Biotech | 2 | $62B |
|
||
Cash-flow waterfall
monthlySold comps — $/sqft
last 12 mo · ≤1 miLoading sold comps…