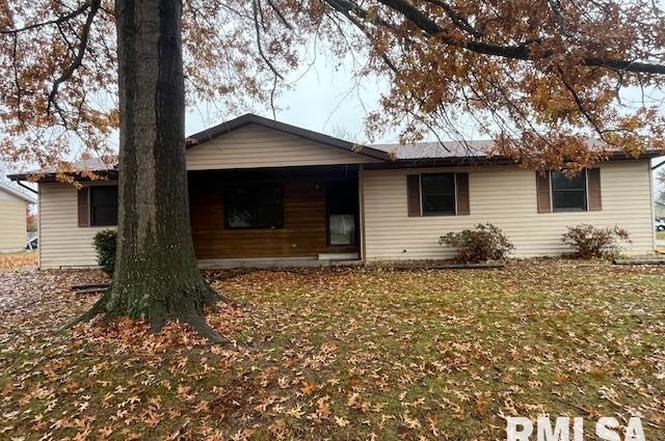
101 N Lawrence St · De Soto, IL
Flood risk 1/10 · Minimal
- FEMA flood zone
- X (unshaded)
- Chance of flooding over 30 yrs
- 0.0%
- Est. flood insurance / yr
- $507 – $1,088
Fire risk 3/10 · Minor
- Est. fire insurance / yr
- $804 – $1,492
Heat risk 5/10 · Moderate
- Hot days now (above 108°F)
- 7 days/yr
- Hot days in 30 yrs
- 21 days/yr
Wind risk 2/10 · Minimal
- Chance of severe wind over 30 yrs
- 3.0%
Air-quality risk 2/10 · Minimal
- Unhealthy air days now
- 0 days/yr
- Unhealthy air days in 30 yrs
- 1 days/yr
Risk factors via First Street. Map © Google.
Why this score? — see what drove the F grade
The composite is a weighted blend of 9 inputs, each scored 0–100. Each bar is that input's sub-score; the figure is the points it added to the 100-point composite (weight × sub-score).
- Cash flow +8.0/30.0
- ARV discount +7.5/15.0
- 1% rule +5.3/10.0
- Livability +3.6/5.0
- Rent growth +2.5/5.0
- Condition / age +2.5/5.0
- Schools +2.4/10.0
- DSCR +2.0/10.0
- Appreciation +0.0/10.0
$94,900
🖨 Deal sheet (PDF) 📄 Offer letter ✓ Due diligence
Listing remarks
4 bedroom, 2 bath home on a corner lot
Key facts
- 0.25 acre lot
- 2 parking spots
- Built 1992
Property features AI
Finance
- Other: Possession at closing; Earnest money is held
- Financial info: Homeowner tax exemption listed
Exterior
- Parking: No garage; other parking available
- Utilities: Public water; Public sewer; Electric service with circuit breakers
- Home design: Detached single-family home; One-story layout; Fee simple ownership
- Construction: Built 31–40 years ago; Vinyl siding with frame construction; Block foundation
- Exterior features: Corner lot
Interior
- Kitchen: Main-level kitchen (tile flooring)
- Bedrooms: 4 bedrooms, all on the main level; Master bedroom on the main level with en-suite bath
- Flooring: Tile flooring in kitchen, dining room and some bedrooms; Carpet in several bedrooms including master; Laminate flooring in living room
- Bathrooms: 2 full bathrooms
- Heating & cooling: Heat pump and electric heating; Central air conditioning
- Interior features: Separate dining room; Basement with egress window
- Laundry & utility: No specific laundry details provided
Neighborhood map
What this means for you Summary
Snapshot
- This is a 1-bed/2.0-bath single-family listed at $95k.
Deal economics
- At list price, monthly cash flow is $-98 ($-1k/yr) — negative.
- To cash-flow at today's rent, offer at most $80k (15.4% below list).
- Meets the 1% rule at list price ($979 rent vs $95k).
- Recommended offer: $80k (15.4% below list) — sets the bar for cash-flow.
Location & tenants
- Location reads 71/100 on livability (#344 in IL) — a middle-class / working-renter tenant base. Strengths: crime A+, cost of living A+, health & safety A+; Watch: amenities F, commute F, employment D-.
- Carbondale Chsd 165 (urban): math 26% / reading 35% proficiency, ranked #279 of 620 in IL (top 45%) — families likely to look elsewhere, expect single-tenant / working-renter base with shorter leases.
- Zoned schools: Desoto Elementary School (math 17% / reading 17%, grade F, #1,141 of 2,056 statewide, top 59%, 180 students, 0% FRL); Carbondale Comm H S (math 26% / reading 35%, grade F, #175 of 693 statewide, top 26%, 997 students, 0% FRL).
- Market conditions: 18 active listings in the ZIP; 5 units permitted in Jackson County in 2024 (0 in 5+ unit buildings).
Forward outlook
- Local home prices are declining (-3.0%/yr); year-one equity from $656 of loan paydown is wiped out by about $3k of value loss. Plan a longer hold.
Negotiation context
- It's been on market 160 days — a 12% lower offer ($84k) is reasonable based on typical stale-listing flexibility.
- 12 sale attempts since 24y ago; this cycle's ask has dropped $15k (14%) from the opening price — seller is motivated, your offer sets the floor, not the list.
Risks & watch-outs
- Watch-outs: property tax is 4.2% of price.
- Climate carrying-cost: extreme-heat days projected 7→21/yr by 2055 (HVAC capex compounding) — expect insurance premiums to compound above CPI over the hold.
Questions for the listing agent
- What do current leases actually rent for vs. the listed asking? Can we see a recent rent roll and the last 12 months of T-12 income?
- It's been on market 160 days. Have you received any prior offers? Is the seller open to a 15% concession, seller financing, or rate buy-down credit?
- Property tax is high relative to price — has the assessment been appealed recently, and will the sale trigger a re-assessment?
- Why hasn't it sold? Are there any deal-killer items the seller is aware of (foundation, flood, title, zoning, code violations)?
- Is there a deadline driving the sale (1031 exchange, divorce, estate, relocation)? That informs how much negotiation room exists.
- Schools are F-rated, which usually means shorter tenancies and higher turnover. Who's the typical renter profile here, and what's been the actual vacancy rate?
- The area grade is low — what's the realistic commute time and amenity access for the typical tenant pool here? Any planned neighborhood developments (good or bad) we should know about?
- What's the average days-on-market for RENTAL listings here right now (not sales)? A rising rental-DOM trend means longer vacancies and softer asking-rent achievability than the comps imply.
- What's the recent tenant-quality profile in this submarket — average credit score on applications, eviction rate, late-payment / NSF rate, and stable-employment percentage? A property-management company in the area should have these aggregated.
- How much new for-sale + rental construction is in the pipeline within 1–3 miles? Heavy new supply typically softens prices + rents 12–24 months out; constrained supply supports both.
Investment metrics
- 1% rule
- 1.03% ✓
- Cap rate
- 5.05%
- Cash-on-cash
- -4.44%
- DSCR
- 0.80
- GRM
- 8.1
CMA / ARV
No comps found within radius.
Projected returns pro-forma
-3.0% appreciation · 3.0% rent growth · sell at horizon
- IRR
- -23.6%
- Equity multiple
- 0.19×
- Total profit
- $-21,486
- Equity at exit
- $14,150
- IRR
- -17.9%
- Equity multiple
- 0.02×
- Total profit
- $-26,165
- Equity at exit
- $8,205
Cash invested: $26,572 (down + closing). Projections, not guarantees.
Landlord ↔ Tenant lean methodology
- Overall (STATE)
- 43 Moderately Tenant-Leaning
- State Illinois
- 43 Moderately Tenant-Leaning · D+7
- County
- — inherits STATE
- City
- — inherits STATE
ZIP-level market 62924
- Home prices YoY
- -18.9%
- Active inventory
- 18
- Price-to-rent
- 8.1×
Monthly cashflow live
- Estimated rent
- $979 medium interval (Pro) →
- Mortgage (P&I)
- −$498
- Tax from tax record
- −$334 /mo · $4,013/yr
- Insurance
- −$40
- HOA
- −$0
- Vacancy / Maint / Mgmt
- −$206
- Net cashflow
- $-98
Break-even live
Sensitivity live
| Price | -10% $-44 | -5% $-71 | +0% $-98 | +5% $-125 | +10% $-152 |
|---|---|---|---|---|---|
| Rent | -10% $-176 | -5% $-137 | +0% $-98 | +5% $-60 | +10% $-21 |
| Rate | -1.0pp $-50 | -0.5pp $-74 | base $-98 | +0.5pp $-123 | +1.0pp $-148 |
UW: 25.0% down · 7.5% · 30yr · 1.5% tax · 5.0% vac · 8.0% maint · 8.0% mgmt
Financing live
Cash to close
- Down payment
- $23,725
- Closing costs
- $2,847
- Reserves months
- —
- Total cash needed
- —
Loan-product check · same deal, 3 products live
Conventional
25% down · 7.5% · 30yr
- Down + closing
- —
- Monthly P&I
- —
- Monthly cashflow
- —
- DSCR
- —
- Eligible?
- —
Personal DTI + credit; lowest rate.
DSCR
20% down · 8.5% · 30yr
- Down + closing
- —
- Monthly P&I
- —
- Monthly cashflow
- —
- DSCR
- —
- Eligible?
- —
No personal income docs; deal must DSCR.
Hard money
10% down · 12.0% · 12mo
- Down + closing
- —
- Monthly P&I
- —
- Monthly cashflow
- —
- DSCR
- —
- Eligible?
- —
Short-term bridge; refi at stabilization.
Listing history 50 events
-
2026-06-19days on market $94,900 Active 160 DOM
-
2026-06-18days on market $94,900 Active 159 DOM
-
2026-06-17days on market $94,900 Active 158 DOM
-
2026-06-16days on market $94,900 Active 157 DOM
-
2026-06-15days on market $94,900 Active 156 DOM
-
2026-06-14days on market $94,900 Active 154 DOM
-
2026-06-13days on market $94,900 Active 153 DOM
-
2026-06-10days on market $94,900 Active 151 DOM
-
2026-06-09days on market $94,900 Active 150 DOM
-
2026-06-08days on market $94,900 Active 149 DOM
-
2026-06-07days on market $94,900 Active 148 DOM
-
2026-06-02days on market $94,900 Active 143 DOM
-
2026-06-01days on market $94,900 Active 142 DOM
-
2026-05-31days on market $94,900 Active 141 DOM
-
2026-05-30days on market $94,900 Active 140 DOM
-
2026-05-23historical
-
2026-05-23price
-
2026-05-13status Active
-
2026-05-12historical
-
2026-04-10price
-
2026-04-01price
-
2026-04-01status Active
-
2026-03-12status Pending
-
2026-01-27price
-
2026-01-07status Active
-
2026-01-06historical
-
2026-01-05historical
-
2025-12-30price
-
2025-11-10Active
-
2025-05-11historical
-
2025-05-10historical
-
2025-01-09price
-
2024-11-17Active
-
2021-11-08soldstatus $110,000
-
2021-11-08soldstatus $110,000
-
2021-11-08soldstatus $110,000
-
2021-09-16$109,900
-
2021-09-16$109,900
-
2012-12-20soldstatus $70,000
-
2012-12-20soldstatus $70,000
-
2012-12-20soldstatus $70,000
-
2012-04-20$79,900
-
2012-04-20$79,900
-
2006-05-26soldstatus $82,500
-
2006-05-25soldstatus $82,500
-
2006-03-16$87,900
-
2004-09-30soldstatus $70,000
-
2004-07-20$71,500
-
2002-11-18soldstatus $61,900
-
2002-09-04$61,900
ⓘ Source: listings_history table (triggers on properties + properties_extension) + one-shot
backfill from property_details.listing_events for pre-trigger history.
Tax reassessment forecast IL · Partial reset (capped growth)
- Current annual tax
- $4,013 · $334/mo
- Projected year-2 tax
- $4,013 · $334/mo
- Expected delta
- $0/yr ($0/mo · 0.0%)
ⓘ Screening estimate from a state-policy table — verify with the county assessor before closing.
Climate risk First Street
- Flood 1/10 Low FEMA zone X (unshaded) · 0% chance over 30 yrs
- Wildfire 3/10 Moderate
- Heat 5/10 Major 7 d/yr ≥108°F today · 21 d/yr by 30 yrs out
- Wind 2/10 Low 3% chance of damaging wind over 30 yrs
- Air quality 2/10 Low 0 unhealthy d/yr today · 1 by 30 yrs out
Nearby sold comps map
Loading sold comps map…
Walkable amenities ~0.75 mi
Loading nearby amenities…
Taxation est. · year 1
- Rental income
- $11,748
- − Mortgage interest
- −$5,316
- − Property taxes
- −$4,013
- − Insurance
- −$474
- − Repairs & maintenance
- −$940
- − Management
- −$940
- − Depreciation
- −$2,761
- Taxable loss
- −$2,696
- Est. tax savings @ 24.0%
- +$647
- After-tax cash flow
- $-532/yr
For passive investors: Depreciation is non-cash, so a rental often shows a tax loss while cash-flowing — sheltering income. Rental losses are passive: they offset passive income freely, and up to $25,000/yr can offset ordinary (W-2) income if you actively participate and your MAGI is under $100k (phasing out to $0 by $150k); unused losses carry forward. On sale, claimed depreciation is recaptured at up to 25%, and gains may owe capital-gains tax (a 1031 exchange can defer both). Figures are a year-1 estimate at your 24.0% rate — not tax advice; consult a CPA.
Schools (NCES district)
- District
- Carbondale Chsd 165
- NCES district ID
- 1708370
- Math proficiency
- 26% ▼ -10.00%
- Reading proficiency
- 35% ▼ -2.00%
- Median HH income
- $22,075
- Composite
- 23.92/100
- National rank
- #7787
- State rank
- #279 of 620 in IL
Livability — De Soto
- Score
- 71/100
- State rank
- #344
- US rank
- #6956
Category grades
Schools grade is shown separately in the Schools card above.
Census & demographics
- Census place
- De Soto, IL
- Population (ZIP)
- 3,064
Population outlook (Jackson County) Hauer SSP2
- Today (2025)
- 59,093 people
- By 2030
- 59,628 · +0.9%
- By 2040
- 59,495 · +0.7%
- By 2050
- 58,811 · -0.5%
- By 2075
- 57,683 · -2.4%
- By 2100
- 55,337 · -6.4%
Race, ethnicity, and origin ACS 2023
- Neighborhood character
- Predominantly White (93%)
- Race & ethnicity
- White 93% Two or more races 4% Black 2%
- Common ancestry
- Romanian 2% Slovak 2% Lithuanian 1%
- Foreign-born
- 1%
- Languages at home
- 99% English-only · Spanish 1%
Political lean MEDSL · Jackson
- 2024 margin
- Toss-up / Even · D 51.0% · R 47.5% · Other 1.4%
- 2008→2024 swing
- -18.3pp toward R · 2008: 21.8pp · 2024: 3.5pp
- All cycles
- 2024: D+3.5 2020: D+1.3 2016: D+3.0 2012: D+10.3 2008: D+21.8
Not yet ingested
- Civics
- —
Market trends
- HPI YoY
- ▼ -25.98%
- Current HPI
- 111.185
- Rent YoY
- —
- Metro
- —
- State GDP YoY
- ▲ 1.59%
- F500 in state
- 60
Industry mix (Fortune 500 HQ in IL)
| Industry | F500 HQs | Revenue |
|---|---|---|
| Insurance | 4 | $201B |
|
||
| Consumer Goods | 4 | $87B |
|
||
| Industrial Machinery | 3 | $64B |
|
||
| Healthcare | 2 | $55B |
|
||
| Retail / Pharmacy | 1 | $148B |
|
||
| Agriculture / Food | 1 | $86B |
|
||
Price history
+77.7% since first listed35 events — show timeline
- 2026-05-23 Listing Removed — MRED as Distributed by MLS Grid
- 2026-05-23 Price Changed — MRED as Distributed by MLS Grid
- 2026-05-13 Relisted — MRED as Distributed by MLS Grid
- 2026-05-12 Listing Removed — MRED as Distributed by MLS Grid
- 2026-04-10 Price Changed — MRED as Distributed by MLS Grid
- 2026-04-01 Price Changed — MRED as Distributed by MLS Grid
- 2026-04-01 Relisted — MRED as Distributed by MLS Grid
- 2026-03-12 Pending — MRED as Distributed by MLS Grid
- 2026-01-27 Price Changed — MRED as Distributed by MLS Grid
- 2026-01-07 Relisted — MRED as Distributed by MLS Grid
- 2026-01-06 Listing Removed — RMLSA as Distributed by MLS Grid
- 2026-01-05 Listing Removed — MRED as Distributed by MLS Grid
- 2025-12-30 Price Changed — MRED as Distributed by MLS Grid
- 2025-11-10 Listed — RMLSA as Distributed by MLS Grid
- 2025-05-11 Listing Removed — RMLSA as Distributed by MLS Grid
- 2025-05-10 Listing Removed — MRED as Distributed by MLS Grid
- 2025-01-09 Price Changed — RMLSA as Distributed by MLS Grid
- 2024-11-17 Listed — RMLSA as Distributed by MLS Grid
- 2021-11-08 Sold (Public Records) $110,000 Public Records
- 2021-11-08 Sold (MLS) $110,000 MRED as Distributed by MLS Grid
- 2021-11-08 Sold (MLS) $110,000 RMLSA as Distributed by MLS Grid
- 2021-09-16 Listed $109,900 MRED as Distributed by MLS Grid
- 2021-09-16 Listed $109,900 RMLSA as Distributed by MLS Grid
- 2012-12-20 Sold (Public Records) $70,000 Public Records
- 2012-12-20 Sold (MLS) $70,000 MRED as Distributed by MLS Grid
- 2012-12-20 Sold (MLS) $70,000 RMLSA as Distributed by MLS Grid
- 2012-04-20 Listed $79,900 MRED as Distributed by MLS Grid
- 2012-04-20 Listed $79,900 RMLSA as Distributed by MLS Grid
- 2006-05-26 Sold (Public Records) $82,500 Public Records
- 2006-05-25 Sold (MLS) $82,500 RMLSA as Distributed by MLS Grid
- 2006-03-16 Listed $87,900 RMLSA as Distributed by MLS Grid
- 2004-09-30 Sold (MLS) $70,000 RMLSA as Distributed by MLS Grid
- 2004-07-20 Listed $71,500 RMLSA as Distributed by MLS Grid
- 2002-11-18 Sold (MLS) $61,900 RMLSA as Distributed by MLS Grid
- 2002-09-04 Listed $61,900 RMLSA as Distributed by MLS Grid
Property tax history
+5.1%/yrLatest (2024): $4,013 · +5.7% YoY. Source: county tax records.
Cash-flow waterfall
monthlySold comps — $/sqft
last 12 mo · ≤1 miLoading sold comps…