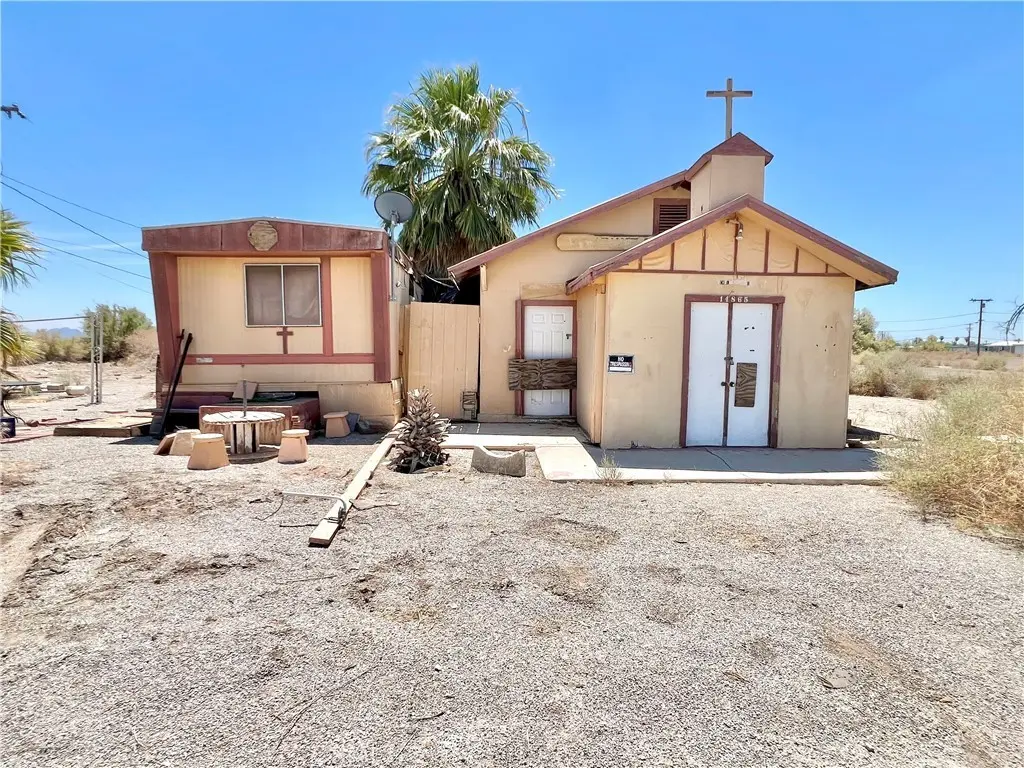
14865 Kirkwood St · Ripley, CA
Flood risk 1/10 · Minimal
- FEMA flood zone
- D
- Chance of flooding over 30 yrs
- 0.0%
- Est. flood insurance / yr
- $544 – $1,084
Fire risk 5/10 · Moderate
- Est. fire insurance / yr
- $659 – $1,223
Heat risk 10/10 · Severe
- Hot days now (above 115°F)
- 8 days/yr
- Hot days in 30 yrs
- 21 days/yr
Wind risk 1/10 · Minimal
- Chance of severe wind over 30 yrs
- —
Air-quality risk 2/10 · Minimal
- Unhealthy air days now
- 1 days/yr
- Unhealthy air days in 30 yrs
- 1 days/yr
Risk factors via First Street. Map © Google.
Why this score? — see what drove the B- grade
The composite is a weighted blend of 9 inputs, each scored 0–100. Each bar is that input's sub-score; the figure is the points it added to the 100-point composite (weight × sub-score).
- Cash flow +30.0/30.0
- 1% rule +10.0/10.0
- DSCR +10.0/10.0
- ARV discount +7.5/15.0
- Schools +2.6/10.0
- Rent growth +2.5/5.0
- Livability +2.2/5.0
- Condition / age +1.0/5.0
- Appreciation +0.0/10.0
$70,000
🖨 Deal sheet (PDF) 📄 Offer letter ✓ Due diligence
Listing remarks MLS
Investor Special – Priced for Quick Sale! Rare Opportunity on a 13,068 Sq Ft (0.30 acre) corner lot featuring a ±940 Sq Ft commercial building in need of full remodel and a ±500 Sq Ft 1 bed / 1 bath mobile home with upside potential. Ideal for investors, flippers, or owner-users looking to create a live/work space, rental income, or small business location. Strong value-add with flexible use potential, excellent visibility, and quick access to I-10. Utilities previously connected. Sold As-Is. Seller is highly motivated and open to offers—priced to sell immediately! Do Not Miss This Opportunity!
Key facts
- 0.3 acre lot
- Built 1946
- Listed 74 days
Neighborhood map
What this means for you Summary
Snapshot
- This is a 1-bed/1.0-bath single-family listed at $70k. Condition is rated poor.
Deal economics
- At list price, monthly cash flow is $614 ($7k/yr) — positive.
- The deal already cash-flows at list — no discount required.
- Meets the 1% rule at list price ($1k rent vs $70k).
- Recommended offer: $66k (6.0% below list) — sets the bar for market timing.
Location & tenants
- Location reads 44/100 on livability (#1,328 in CA) — a working-class tenant base; expect higher turnover. Strengths: commute A+, cost of living A-; Watch: crime F, amenities F, employment F.
- Palo Verde Unified (town): math 20% / reading 34% proficiency, ranked #1,133 of 1,400 in CA (top 81%) — low school quality limits family demand, transient renter base, plan for 1-2y turnover; 64% free/reduced lunch — lower-income household profile, screen leases tightly.
- Zoned schools: Ruth Brown Elementary (614 students, 88% FRL); Palo Verde High (820 students, 76% FRL) — zoned schools average 82% FRL vs 64% district-wide (18 pts higher); higher-poverty schools than district average — tighter screening recommended.
- Market conditions: 192 active listings in the ZIP; 9,195 units permitted in Riverside County in 2024 (1,512 in 5+ unit buildings).
Forward outlook
- Local home prices are declining (-3.0%/yr); year-one equity from $484 of loan paydown is wiped out by about $2k of value loss. Plan a longer hold.
- Riverside County population projected at +22% by 2050 — long-run rental-demand tailwind backs the buy-and-hold thesis.
- At projected returns (-3.0% appreciation + 3.0% rent growth), your $20k cash investment doubles in ~4 years — after that, you're playing with house money.
Negotiation context
- It's been on market 75 days — a 6% lower offer ($66k) is reasonable based on typical stale-listing flexibility.
- 2 sale attempts with the ask held roughly flat each time — persistent listings suggest the price (not the market) is what's stuck; bring a comps-based counter.
Risks & watch-outs
- Watch-outs: built in 1946 — expect roof / HVAC / electrical / plumbing capex.
- Climate carrying-cost: moderate wildfire risk; extreme-heat days projected 8→21/yr by 2055 (HVAC capex compounding) — expect insurance premiums to compound above CPI over the hold.
Questions for the listing agent
- It's been on market 75 days. Have you received any prior offers? Is the seller open to a 6% concession, seller financing, or rate buy-down credit?
- Have any recent inspections been done? Can we get a copy of the seller's disclosures and any deferred-maintenance estimates?
- Built in 1946 — when were the roof, HVAC, electrical panel, plumbing, and water heater last replaced?
- Why hasn't it sold? Are there any deal-killer items the seller is aware of (foundation, flood, title, zoning, code violations)?
- Is there a deadline driving the sale (1031 exchange, divorce, estate, relocation)? That informs how much negotiation room exists.
- Schools are F-rated, which usually means shorter tenancies and higher turnover. Who's the typical renter profile here, and what's been the actual vacancy rate?
- Crime grade is F in this area — have there been break-ins, vandalism, or insurance claims at this property in the last 3 years? What carrier currently insures it and at what premium?
- What's the average days-on-market for RENTAL listings here right now (not sales)? A rising rental-DOM trend means longer vacancies and softer asking-rent achievability than the comps imply.
- What's the recent tenant-quality profile in this submarket — average credit score on applications, eviction rate, late-payment / NSF rate, and stable-employment percentage? A property-management company in the area should have these aggregated.
- How much new for-sale + rental construction is in the pipeline within 1–3 miles? Heavy new supply typically softens prices + rents 12–24 months out; constrained supply supports both.
Investment metrics
- 1% rule
- 1.99% ✓
- Cap rate
- 16.82%
- Cash-on-cash
- 37.60%
- DSCR
- 2.67
- GRM
- 4.2
CMA / ARV
No comps found within radius.
Projected returns pro-forma
-3.0% appreciation · 3.0% rent growth · sell at horizon
- IRR
- 33.6%
- Equity multiple
- 2.42×
- Total profit
- $27,787
- Equity at exit
- $10,437
- IRR
- 40.5%
- Equity multiple
- 4.81×
- Total profit
- $74,642
- Equity at exit
- $6,052
Cash invested: $19,600 (down + closing). Projections, not guarantees.
Landlord ↔ Tenant lean methodology
- Overall (STATE)
- 18 Strongly Tenant-Friendly
- State California
- 18 Strongly Tenant-Friendly · D+13
- County
- — inherits STATE
- City
- — inherits STATE
ZIP-level market 92225
- Home prices YoY
- -15.8%
- Active inventory
- 192
- Price-to-rent
- 4.2×
Monthly cashflow live
- Estimated rent
- $1,390 medium interval (Pro) →
- Mortgage (P&I)
- −$367
- Tax est. 1.5%
- −$88 /mo · $1,050/yr
- Insurance
- −$29
- HOA
- −$0
- Vacancy / Maint / Mgmt
- −$292
- Net cashflow
- $614
Break-even live
Sensitivity live
| Price | -10% $662 | -5% $638 | +0% $614 | +5% $590 | +10% $566 |
|---|---|---|---|---|---|
| Rent | -10% $504 | -5% $559 | +0% $614 | +5% $669 | +10% $724 |
| Rate | -1.0pp $649 | -0.5pp $632 | base $614 | +0.5pp $596 | +1.0pp $577 |
UW: 25.0% down · 7.5% · 30yr · 1.5% tax · 5.0% vac · 8.0% maint · 8.0% mgmt
Financing live
Cash to close
- Down payment
- $17,500
- Closing costs
- $2,100
- Reserves months
- —
- Total cash needed
- —
Loan-product check · same deal, 3 products live
Conventional
25% down · 7.5% · 30yr
- Down + closing
- —
- Monthly P&I
- —
- Monthly cashflow
- —
- DSCR
- —
- Eligible?
- —
Personal DTI + credit; lowest rate.
DSCR
20% down · 8.5% · 30yr
- Down + closing
- —
- Monthly P&I
- —
- Monthly cashflow
- —
- DSCR
- —
- Eligible?
- —
No personal income docs; deal must DSCR.
Hard money
10% down · 12.0% · 12mo
- Down + closing
- —
- Monthly P&I
- —
- Monthly cashflow
- —
- DSCR
- —
- Eligible?
- —
Short-term bridge; refi at stabilization.
Listing history 21 events
-
2026-06-21days on market $70,000 Active 75 DOM
-
2026-06-19days on market $70,000 Active 73 DOM
-
2026-06-18days on market $70,000 Active 72 DOM
-
2026-06-17days on market $70,000 Active 71 DOM
-
2026-06-16days on market $70,000 Active 70 DOM
-
2026-06-15days on market $70,000 Active 69 DOM
-
2026-06-14days on market $70,000 Active 67 DOM
-
2026-06-12days on market $70,000 Active 66 DOM
-
2026-06-09days on market $70,000 Active 63 DOM
-
2026-06-08days on market $70,000 Active 62 DOM
-
2026-06-07days on market $70,000 Active 61 DOM
-
2026-06-07days on market $70,000 Active 60 DOM
-
2026-06-04days on market $70,000 Active 57 DOM
-
2026-06-02days on market $70,000 Active 56 DOM
-
2026-06-01days on market $70,000 Active 55 DOM
-
2026-05-31days on market $70,000 Active 54 DOM
-
2026-05-31days on market $70,000 Active 53 DOM
-
2026-04-07$70,000 Active 627-char remark
Show marketing remark (627 chars)
Investor Special – Priced for Quick Sale! Rare Opportunity on a 13,068 Sq Ft (0.30 acre) corner lot featuring a ±940 Sq Ft commercial building in need of full remodel and a ±500 Sq Ft 1 bed / 1 bath mobile home with upside potential. Ideal for investors, flippers, or owner-users looking to create a live/work space, rental income, or small business location. Strong value-add with flexible use potential, excellent visibility, and quick access to I-10. Utilities previously connected. Sold As-Is. Seller is highly motivated and open to offers—priced to sell immediately! Do Not Miss This Opportunity!
-
2026-03-31historical
-
2025-10-09price $105,000
-
2025-08-27$120,000 Active
ⓘ Source: listings_history table (triggers on properties + properties_extension) + one-shot
backfill from property_details.listing_events for pre-trigger history.
Climate risk First Street
- Flood 1/10 Low FEMA zone D · 0% chance over 30 yrs
- Wildfire 5/10 Major
- Heat 10/10 Extreme 8 d/yr ≥115°F today · 21 d/yr by 30 yrs out
- Wind 1/10 Low
- Air quality 2/10 Low 1 unhealthy d/yr today · 1 by 30 yrs out
Nearby sold comps map
Loading sold comps map…
Walkable amenities ~0.75 mi
Loading nearby amenities…
Taxation est. · year 1
- Rental income
- $16,676
- − Mortgage interest
- −$3,921
- − Property taxes
- −$1,050
- − Insurance
- −$350
- − Repairs & maintenance
- −$1,334
- − Management
- −$1,334
- − Depreciation
- −$2,036
- Taxable income
- $6,650
- Est. tax owed @ 24.0%
- −$1,596
- After-tax cash flow
- $5,773/yr
For passive investors: Depreciation is non-cash, so a rental often shows a tax loss while cash-flowing — sheltering income. Rental losses are passive: they offset passive income freely, and up to $25,000/yr can offset ordinary (W-2) income if you actively participate and your MAGI is under $100k (phasing out to $0 by $150k); unused losses carry forward. On sale, claimed depreciation is recaptured at up to 25%, and gains may owe capital-gains tax (a 1031 exchange can defer both). Figures are a year-1 estimate at your 24.0% rate — not tax advice; consult a CPA.
Condition & rehab AI · 12 photos
This property requires extensive renovation and repairs, including structural, interior, and HVAC work. Full renovation is recommended to create a livable space with improved aesthetics and functionality.
Repairs flagged
- Major ceiling — Exposed and damaged
- Major roof — Exposed and damaged
- Major flooring — Exposed and damaged
- Major interior walls — Exposed and damaged
- Major kitchen cabinets — Exposed and missing
- Major bathroom cabinets — Exposed and missing
- Major HVAC — Exposed and missing
Value-add opportunities
- Both full renovation — Creates a livable space with improved aesthetics and functionality
- Both landscaping — Enhances curb appeal and property value
- Both HVAC upgrade — Improves comfort and energy efficiency
- Both exterior siding repair — Restores structural integrity and enhances curb appeal
Renovation cost estimate screening
| Repair item | Severity | Est. cost |
|---|---|---|
| ceiling · Exposed and damaged | Major | $15,000–50,000 |
| roof · Exposed and damaged | Major | $15,000–50,000 |
| flooring · Exposed and damaged | Major | $15,000–50,000 |
| interior walls · Exposed and damaged | Major | $15,000–50,000 |
| kitchen cabinets · Exposed and missing | Major | $15,000–50,000 |
| bathroom cabinets · Exposed and missing | Major | $15,000–50,000 |
| HVAC · Exposed and missing | Major | $15,000–50,000 |
| Total estimated repair cost · 7 items | $105,000–350,000 |
Value-add ROI direction
- Both full renovation — Creates a livable space with improved aesthetics and functionality ↑
- Both landscaping — Enhances curb appeal and property value ↑
- Both HVAC upgrade — Improves comfort and energy efficiency ↑
- Both exterior siding repair — Restores structural integrity and enhances curb appeal ↑
ⓘ Cost ranges are severity-bucket heuristics (US national rule-of-thumb). Get contractor quotes + a written scope before underwriting a rehab budget.
Schools (NCES district)
- District
- Palo Verde Unified
- NCES district ID
- 0629640
- Math proficiency
- 20% ▲ 3.00%
- Reading proficiency
- 34% ▲ 5.00%
- Median HH income
- $40,808
- Composite
- 25.77/100
- National rank
- #12796
- State rank
- #1133 of 1400 in CA
Livability — Ripley
- Score
- 44/100
- State rank
- #1328
- US rank
- #26752
Category grades
Schools grade is shown separately in the Schools card above.
Census & demographics
- Census place
- Ripley, CA
- Population (ZIP)
- 21,101
Population outlook (Riverside County) Hauer SSP2
- Today (2025)
- 2,664,475 people
- By 2030
- 2,802,692 · +5.2%
- By 2040
- 3,050,904 · +14.5%
- By 2050
- 3,256,783 · +22.2%
- By 2075
- 3,655,058 · +37.2%
- By 2100
- 3,766,594 · +41.4%
Race, ethnicity, and origin ACS 2023
- Neighborhood character
- Diverse neighborhood (Simpson 0.58)
- Race & ethnicity
- Hispanic / Latino 59% White 26% Two or more races 13% Black 10% Asian 2% Native American 2%
- Hispanic origin (detail)
- Mexican 54%
- Common ancestry
- Lithuanian 1% Romanian 1% Iranian 1%
- Foreign-born
- 18% · Canada
- Languages at home
- 55% English-only · Spanish 42% Other Indo-European 1% Tagalog/Filipino 0%
Political lean MEDSL · Riverside
- 2024 margin
- Toss-up / Even · D 48.0% · R 49.3% · Other 2.6%
- 2008→2024 swing
- -3.6pp toward R · 2008: 2.3pp · 2024: -1.3pp
- All cycles
- 2024: R+1.3 2020: D+8.0 2016: D+4.3 2012: R+0.4 2008: D+2.3
Not yet ingested
- Civics
- —
Market trends
- HPI YoY
- ▼ -40.53%
- Current HPI
- 215.4794
- Rent YoY
- —
- Metro
- —
- State GDP YoY
- ▲ 3.21%
- F500 in state
- 116
Industry mix (Fortune 500 HQ in CA)
| Industry | F500 HQs | Revenue |
|---|---|---|
| Technology | 27 | $1,492B |
|
||
| Financial Services | 3 | $174B |
|
||
| Retail | 3 | $44B |
|
||
| Insurance | 3 | $26B |
|
||
| Media / Entertainment | 2 | $115B |
|
||
| Pharmaceuticals / Biotech | 2 | $62B |
|
||
Price history
-41.7% since first listed4 events — show timeline
- 2026-04-07 Listed $70,000 CRMLS
- 2026-03-31 Listing Removed — CRMLS
- 2025-10-09 Price Changed $105,000 CRMLS
- 2025-08-27 Listed $120,000 CRMLS
Cash-flow waterfall
monthlySold comps — $/sqft
last 12 mo · ≤1 miLoading sold comps…