None · Odessa, TX
Flood risk 5/10 · Moderate
- FEMA flood zone
- AE
- Chance of flooding over 30 yrs
- 0.24%
- Est. flood insurance / yr
- $1,737 – $8,500
Fire risk 4/10 · Minor
- Est. fire insurance / yr
- $1,222 – $2,270
Heat risk 6/10 · Moderate
- Hot days now (above 101°F)
- 7 days/yr
- Hot days in 30 yrs
- 22 days/yr
Wind risk 2/10 · Minimal
- Chance of severe wind over 30 yrs
- 2.0%
Air-quality risk 1/10 · Minimal
- Unhealthy air days now
- 0 days/yr
- Unhealthy air days in 30 yrs
- 0 days/yr
Risk factors via First Street. Map © Google.
Why this score? — see what drove the B grade
The composite is a weighted blend of 9 inputs, each scored 0–100. Each bar is that input's sub-score; the figure is the points it added to the 100-point composite (weight × sub-score).
- Cash flow +30.0/30.0
- ARV discount +15.0/15.0
- DSCR +10.0/10.0
- 1% rule +8.3/10.0
- Livability +3.8/5.0
- Rent growth +2.5/5.0
- Condition / age +2.5/5.0
- Schools +2.2/10.0
- Appreciation +0.0/10.0
$175,000
🖨 Deal sheet 📄 Offer letter ✓ Due diligence
Listing remarks
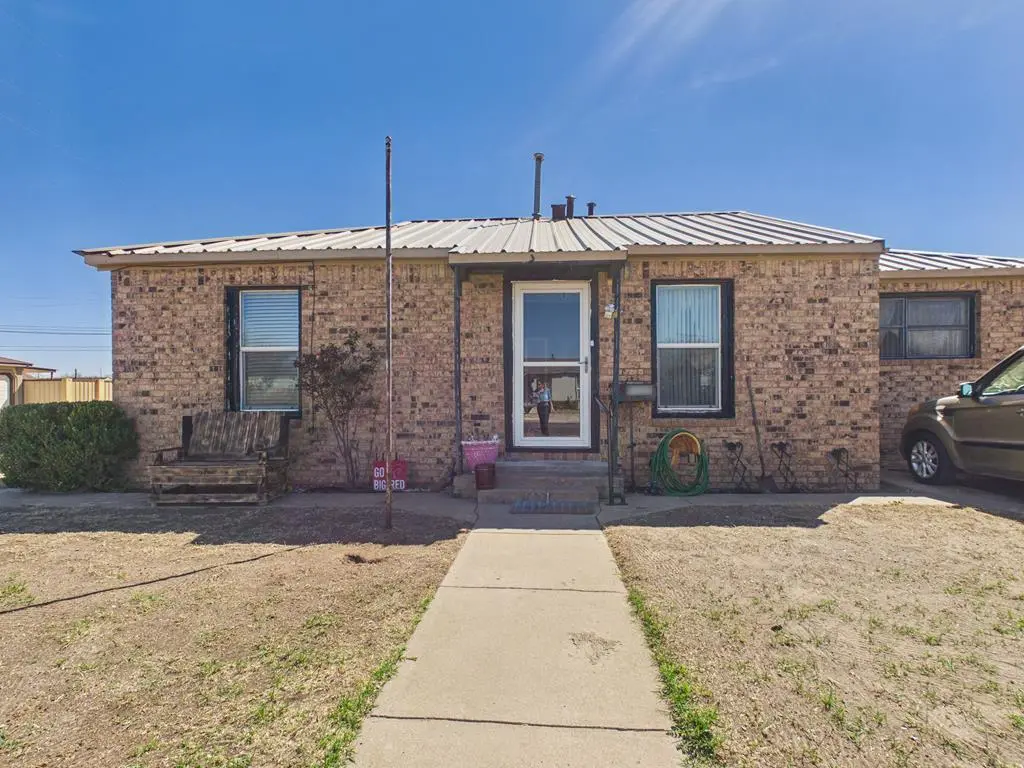
Don't miss this eye-catching corner lot with stylish curb appeal! This 3-bedroom, 2-bathroom home features a formal living room plus a spacious family room, giving you the perfect setup for entertaining or relaxing. Step outside to a huge backyard ready for BBQs, parties, and unforgettable gatherings. A fantastic starter home full of charm, space, and potential. Schedule your private showing today!
Key facts
- 8,929 sq ft lot
- Parking
- Built 1949
Property features AI
Exterior
- Parking: 1 parking space; 1 covered space; Carport; Parking pad
- Utilities: Public water; Public sewer; Propane available
- Home design: Single family residence; Residential property
- Construction: Brick veneer construction; Metal roof; Slab foundation; Built using solar energy generation
- Exterior features: Wood fencing; Landscaped yard; Paved road access; Solar panels
Interior
- Kitchen: Gas range; Self-cleaning oven
- Flooring: Carpet; Tile
- Bathrooms: 2 full bathrooms
- Heating & cooling: Electric heating; Electric cooling
- Interior features: Gas water heater; Self-cleaning oven; No fireplace
- Laundry & utility: Washer hookup; Dryer; Laundry closet; Laundry area in kitchen
Neighborhood map
What this means for you Summary
Snapshot
- This is a 3-bed/2.0-bath single-family listed at $175k.
Deal economics
- At list price, monthly cash flow is $326 ($4k/yr) — positive.
- The deal already cash-flows at list — no discount required.
- Meets the 1% rule at list price ($2k rent vs $175k).
- Recommended offer: $170k (3.0% below list) — sets the bar for market timing.
Location & tenants
- Location reads 75/100 on livability (#132 in TX, #3,928 nationally) — a middle-class / working-renter tenant base. Strengths: cost of living A+, housing A+, health & safety A+; Watch: commute D+, amenities D.
- Ector County ISD (urban): math 22% / reading 27% proficiency, ranked #707 of 826 in TX (top 86%) — low school quality limits family demand, transient renter base, plan for 1-2y turnover.
- Zoned schools: San Jacinto El (math 43% / reading 34%, grade F, #1,680 of 4,322 statewide, top 40%, 396 students, 83% FRL); Bonham Middle (math 9% / reading 16%, grade F, #1,616 of 1,662 statewide, top 97%, 867 students, 65% FRL); Odessa H S (math 18% / reading 22%, grade F, #1,397 of 1,632 statewide, top 87%, 3,874 students, 68% FRL) — zoned schools average 72% FRL vs 56% district-wide (16 pts higher); higher-poverty schools than district average — tighter screening recommended.
- Market conditions: 122 active listings in the ZIP; 6 comparable units currently listed for rent nearby; rentals at typical pace (median 21d on market — plan ~3-4 weeks tenant-placement turnaround); 1,004 units permitted in Ector County in 2024 (0 in 5+ unit buildings).
- At $2,331/mo this rent would consume 49% of the median local household income ($57k/yr) (locally 842% of renters already pay >50% of income on rent) — very limited rent-growth headroom before tenants either downsize or default.
Forward outlook
- Local home prices are declining (-3.0%/yr); year-one equity from $1k of loan paydown is wiped out by about $5k of value loss. Plan a longer hold.
- Ector County population projected at +78% by 2050 — long-run rental-demand tailwind backs the buy-and-hold thesis.
Negotiation context
- It's been on market 43 days — a 3% lower offer ($170k) is reasonable based on typical stale-listing flexibility.
Risks & watch-outs
- Watch-outs: flood insurance adds $427/mo; built in 1949 — expect roof / HVAC / electrical / plumbing capex.
- Climate carrying-cost: in FEMA flood zone AE (mandatory federal flood insurance); extreme-heat days projected 7→22/yr by 2055 (HVAC capex compounding) — expect insurance premiums to compound above CPI over the hold.
Questions for the listing agent
- It's been on market 43 days. Have you received any prior offers? Is the seller open to a 3% concession, seller financing, or rate buy-down credit?
- Built in 1949 — when were the roof, HVAC, electrical panel, plumbing, and water heater last replaced?
- What's the actual annual flood-insurance premium (NFIP or private), and is the property in a SFHA with mandatory coverage?
- Is there a deadline driving the sale (1031 exchange, divorce, estate, relocation)? That informs how much negotiation room exists.
- Schools are F-rated, which usually means shorter tenancies and higher turnover. Who's the typical renter profile here, and what's been the actual vacancy rate?
- What's the average days-on-market for RENTAL listings here right now (not sales)? A rising rental-DOM trend means longer vacancies and softer asking-rent achievability than the comps imply.
- What's the recent tenant-quality profile in this submarket — average credit score on applications, eviction rate, late-payment / NSF rate, and stable-employment percentage? A property-management company in the area should have these aggregated.
- How much new for-sale + rental construction is in the pipeline within 1–3 miles? Heavy new supply typically softens prices + rents 12–24 months out; constrained supply supports both.
Investment metrics
- 1% rule
- 1.33% ✓
- Cap rate
- 11.46%
- Cash-on-cash
- 18.44%
- DSCR
- 1.82
- GRM
- 6.3
CMA / ARV
- ARV (median comp)
- $248,907
- List price
- $175,000
- Delta
- -29.69%
- Verdict
- UNDERPRICED
- Comps
- 3 within 1.0 mi
Show comp detail 1 sale within ~0.75 mi
| Address | Dist | Beds/Ba | Sqft | Sold | Price | $/sf | Match |
|---|---|---|---|---|---|---|---|
| 709 W 20th St | 0.37mi | 3/2.0 | 2,084 (+6%) | 24mo | $44,900 | $22 | 53 |
Match score weights: distance 35% · size 25% · config 20% · recency 20%. Top-matched comps best support the ARV.
Projected returns pro-forma
-3.0% appreciation · 3.0% rent growth · sell at horizon
- IRR
- -4.0%
- Equity multiple
- 0.85×
- Total profit
- $-7,346
- Equity at exit
- $26,093
- IRR
- 5.8%
- Equity multiple
- 1.43×
- Total profit
- $21,278
- Equity at exit
- $15,131
Cash invested: $49,000 (down + closing). Projections, not guarantees.
Landlord ↔ Tenant lean methodology
- Overall (STATE)
- 87 Strongly Landlord-Friendly
- State Texas
- 87 Strongly Landlord-Friendly · R+5
- County
- — inherits STATE
- City
- — inherits STATE
ZIP-level market 79763
- Active inventory
- 122
- Price-to-rent
- 6.3×
Monthly cashflow live
- Estimated rent
- $2,331 high interval (Pro) →
- Mortgage (P&I)
- −$918
- Tax from tax record
- −$98 /mo · $1,179/yr
- Insurance
- −$73
- Flood insurance flood zone
- −$427 /mo · $5,118/yr
- HOA
- −$0
- Vacancy / Maint / Mgmt
- −$490
- Net cashflow
- $326
Break-even live
UW: 25.0% down · 7.5% · 30yr · 1.5% tax · 5.0% vac · 8.0% maint · 8.0% mgmt
Financing live
Cash to close
- Down payment
- $43,750
- Closing costs
- $5,250
- Reserves months
- —
- Total cash needed
- —
Loan-product check · same deal, 3 products live
Conventional
25% down · 7.5% · 30yr
- Down + closing
- —
- Monthly P&I
- —
- Monthly cashflow
- —
- DSCR
- —
- Eligible?
- —
Personal DTI + credit; lowest rate.
DSCR
20% down · 8.5% · 30yr
- Down + closing
- —
- Monthly P&I
- —
- Monthly cashflow
- —
- DSCR
- —
- Eligible?
- —
No personal income docs; deal must DSCR.
Hard money
10% down · 12.0% · 12mo
- Down + closing
- —
- Monthly P&I
- —
- Monthly cashflow
- —
- DSCR
- —
- Eligible?
- —
Short-term bridge; refi at stabilization.
Rent comps 6 comps
| Address | Beds | Baths | Sqft | Rent | $/sqft | DOM | Units | Dist |
|---|---|---|---|---|---|---|---|---|
| 200 Santa Rita Dr Odessa, TX | 3.0 | 2.0 | 1438 | $2,400 | $1.67 | 44d | 1 | 0.49mi |
| 314 Santa Rita Dr Odessa, TX | 3.0 | 2.0 | 2072 | $1,875 | $0.90 | 21d | 1 | 0.53mi |
| 1800 W 23rd St Odessa, TX | 3.0 | 2.5 | 1880 | $2,650 | $1.41 | 44d | 1 | 0.71mi |
| 1506 N Alleghaney Ave Odessa, TX | 4.0 | 2.0 | 2400 | $2,650 | $1.10 | 21d | 1 | 0.72mi |
| 2 Star Cir Odessa, TX | 3.0 | 2.0 | 1377 | $2,200 | $1.60 | 13d | 1 | 1.02mi |
| 237 Orchard Dr Odessa, TX | 4.0 | 2.0 | 1768 | $2,000 | $1.13 | 13d | 1 | 1.02mi |
Listing history 18 events
-
2026-06-19days on market $175,000 Active 43 DOM
-
2026-06-18days on market $175,000 Active 42 DOM
-
2026-06-17days on market $175,000 Active 41 DOM
-
2026-06-16days on market $175,000 Active 40 DOM
-
2026-06-15days on market $175,000 Active 39 DOM
-
2026-06-14days on market $175,000 Active 37 DOM
-
2026-06-13days on market $175,000 Active 36 DOM
-
2026-06-10days on market $175,000 Active 34 DOM
-
2026-06-09days on market $175,000 Active 33 DOM
-
2026-06-09price $175,000 Active 32 DOM
-
2026-06-08days on market $200,000 Active 32 DOM
-
2026-06-07days on market $200,000 Active 31 DOM
-
2026-06-03days on market $200,000 Active 26 DOM
-
2026-06-01days on market $200,000 Active 25 DOM
-
2026-05-31days on market $200,000 Active 24 DOM
-
2026-05-30days on market $200,000 Active 23 DOM
-
2026-03-02$200,000 Active 401-char remark
-
1998-12-02soldstatus
ⓘ Source: listings_history table (triggers on properties + properties_extension) + one-shot
backfill from property_details.listing_events for pre-trigger history.
Tax reassessment forecast TX · Resets to sale price
- Current annual tax
- $1,179 · $98/mo
- Projected year-2 tax
- $3,202 · $267/mo
- Expected delta
- +$2,023/yr (+$169/mo · 171.5%)
ⓘ Screening estimate from a state-policy table — verify with the county assessor before closing.
Climate risk First Street
- Flood 5/10 Major FEMA zone AE · 24% chance over 30 yrs
- Wildfire 4/10 Moderate
- Heat 6/10 Major 7 d/yr ≥101°F today · 22 d/yr by 30 yrs out
- Wind 2/10 Low 2% chance of damaging wind over 30 yrs
- Air quality 1/10 Low 0 unhealthy d/yr today · 0 by 30 yrs out
Nearby sold comps map
Loading sold comps map…
Walkable amenities ~0.75 mi
Loading nearby amenities…
Taxation est. · year 1
- Rental income
- $27,978
- − Mortgage interest
- −$9,803
- − Property taxes
- −$1,179
- − Insurance
- −$5,994
- − Repairs & maintenance
- −$2,238
- − Management
- −$2,238
- − Depreciation
- −$5,091
- Taxable income
- $1,435
- Est. tax owed @ 24.0%
- −$344
- After-tax cash flow
- $3,572/yr
For passive investors: Depreciation is non-cash, so a rental often shows a tax loss while cash-flowing — sheltering income. Rental losses are passive: they offset passive income freely, and up to $25,000/yr can offset ordinary (W-2) income if you actively participate and your MAGI is under $100k (phasing out to $0 by $150k); unused losses carry forward. On sale, claimed depreciation is recaptured at up to 25%, and gains may owe capital-gains tax (a 1031 exchange can defer both). Figures are a year-1 estimate at your 24.0% rate — not tax advice; consult a CPA.
Schools (NCES district)
- District
- Ector County ISD
- NCES district ID
- 4818000
- Math proficiency
- 22% ▼ -9.00%
- Reading proficiency
- 27% ▼ -4.00%
- Median HH income
- $52,740
- Composite
- 21.89/100
- National rank
- #8233
- State rank
- #707 of 826 in TX
Livability — Odessa
- Score
- 75/100
- State rank
- #132
- US rank
- #3928
Category grades
Schools grade is shown separately in the Schools card above.
Census & demographics
- Census place
- Odessa, TX
- County
- Ector County · 131,169 people
- City population
- 131,169
- Metro
- Odessa, TX
- Population (ZIP)
- 35,174
- Household income
- $56,877
- Rent vs Own
- Severe rent burden
- 842.0
Population outlook (Ector County) Hauer SSP2
- Today (2025)
- 212,765 people
- By 2030
- 241,962 · +13.7%
- By 2040
- 306,582 · +44.1%
- By 2050
- 379,755 · +78.5%
- By 2075
- 568,991 · +167.4%
- By 2100
- 709,829 · +233.6%
Race, ethnicity, and origin ACS 2023
- Neighborhood character
- Predominantly Hispanic (76%)
- Race & ethnicity
- Hispanic / Latino 76% Two or more races 24% White 19% Black 2%
- Hispanic origin (detail)
- Mexican 72%
- Common ancestry
- Lithuanian 1% Slovak 1%
- Foreign-born
- 22% · Canada
- Languages at home
- 39% English-only · Spanish 60%
Political lean MEDSL · Ector
- 2024 margin
- Solid R (+52.9) · D 23.2% · R 76.1%
- 2008→2024 swing
- -4.9pp toward R · 2008: -48.0pp · 2024: -52.9pp
- All cycles
- 2024: R+52.9 2020: R+47.8 2016: R+40.6 2012: R+48.9 2008: R+48.0
Not yet ingested
- Civics
- —
Market trends
- HPI YoY
- ▼ -213.81%
- Current HPI
- 254.9773
- Rent YoY
- —
- Metro
- Odessa, TX
- State GDP YoY
- ▲ 3.95%
- F500 in state
- 110
Industry mix (Fortune 500 HQ in TX)
| Industry | F500 HQs | Revenue |
|---|---|---|
| Energy | 16 | $1,198B |
|
||
| Technology | 5 | $198B |
|
||
| Engineering / Construction | 4 | $72B |
|
||
| Energy Services | 3 | $60B |
|
||
| Utilities | 3 | $41B |
|
||
| Healthcare | 2 | $330B |
|
||
Price history
-12.5% since first listed3 events — show timeline
- 2026-06-08 Price Changed $175,000 ODMLS
- 2026-03-02 Listed $200,000 ODMLS
- 1998-12-02 Sold (Public Records) — Public Records
Property tax history
-5.6%/yrLatest (2025): $1,179 · -38.7% YoY. Source: county tax records.
Cash-flow waterfall
monthlySold comps — $/sqft
last 12 mo · ≤1 miLoading sold comps…