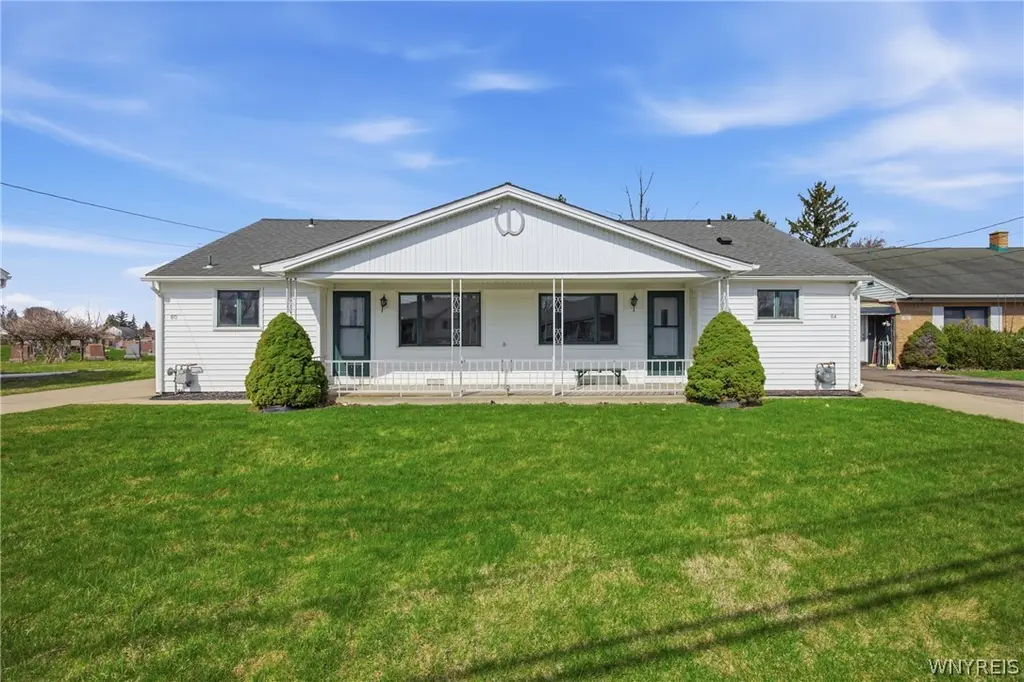
80 Ellwood Pl · Cheektowaga, NY
Flood risk 1/10 · Minimal
- FEMA flood zone
- X (unshaded)
- Chance of flooding over 30 yrs
- 0.0%
- Est. flood insurance / yr
- $473 – $860
Fire risk 1/10 · Minimal
- Est. fire insurance / yr
- $691 – $1,283
Heat risk 3/10 · Minor
- Hot days now (above 93°F)
- 7 days/yr
- Hot days in 30 yrs
- 15 days/yr
Wind risk 1/10 · Minimal
- Chance of severe wind over 30 yrs
- —
Air-quality risk 3/10 · Minor
- Unhealthy air days now
- 2 days/yr
- Unhealthy air days in 30 yrs
- 3 days/yr
Risk factors via First Street. Map © Google.
Why this score? — see what drove the C grade
The composite is a weighted blend of 9 inputs, each scored 0–100. Each bar is that input's sub-score; the figure is the points it added to the 100-point composite (weight × sub-score).
- Cash flow +20.2/30.0
- ARV discount +10.3/15.0
- 1% rule +6.6/10.0
- DSCR +6.4/10.0
- Livability +4.2/5.0
- Schools +3.8/10.0
- Rent growth +2.5/5.0
- Condition / age +2.5/5.0
- Appreciation +0.0/10.0
$189,000
🖨 Deal sheet (PDF) 📄 Offer letter ✓ Due diligence
Listing remarks
Such a delightful Duplex you will discover in this home! Owned and loved and cared for by the same family for years and now ready for a new owner and a new chapter to continue the story! Both units are a mirror image of each other. A wide front porch greets you and is a great place to sit and sip your coffee in the morning. There are two sizable bedrooms and one bath in each unit, roomy and sun filled throughout. Each unit has a basement that offers additional storage. Smartly refreshed throughout with paint and new carpet. Situated on a quiet tree lined street this would be an ideal property to live in one side and rent out the other! This home is so charming and not to be missed!
Key facts
- New carpet
- Tree lined street
- One bath
Tags
Neighborhood map
What this means for you Summary
Snapshot
- This is a 4-bed/2.0-bath townhouse listed at $189k.
Deal economics
- At list price, monthly cash flow is $238 ($3k/yr) — positive.
- The deal already cash-flows at list — no discount required.
- Meets the 1% rule at list price ($2k rent vs $189k).
- Recommended offer: $186k (1.5% below list) — sets the bar for market timing.
- Cap rate 7.8% vs local median 3.8% in Cheektowaga — top-decile yield for the area; either an underpriced asset or a hidden risk that comps aren't pricing in. Stress-test before assuming the spread holds.
Location & tenants
- Location reads 84/100 on livability (#54 in NY, #811 nationally) — a professional / high-income tenant draw. Strengths: commute A+, housing A+, health & safety A+; Watch: crime C-.
- Cleveland Hill Union Free School District (urban): math 42% / reading 46% proficiency, ranked #468 of 590 in NY (top 79%) — families likely to look elsewhere, expect single-tenant / working-renter base with shorter leases.
- Zoned schools: Cleveland Hill Elementary School (math 27% / reading 43%, grade F, #1,569 of 2,108 statewide, top 75%, 646 students, 63% FRL); Cleveland Hill Middle School (math 37% / reading 52%, grade D, #348 of 729 statewide, top 50%, 298 students, 64% FRL); Cleveland Hill High School (math 87% / reading 75%, grade A, #485 of 1,100 statewide, top 45%, 385 students, 56% FRL) — zoned schools average 61% FRL vs 43% district-wide (19 pts higher); higher-poverty schools than district average — tighter screening recommended.
- Market conditions: 209 active listings in the ZIP; 4 comparable units currently listed for rent nearby; rentals leasing fast (median 4d on market — plan ~1-2 weeks tenant-placement turnaround); 1,244 units permitted in Erie County in 2024 (563 in 5+ unit buildings).
- This rent runs 39% of the median local income ($67k/yr) — at the standard rent-burdened threshold; future hikes will face affordability resistance.
Forward outlook
- Local home prices are declining (-3.0%/yr); year-one equity from $1k of loan paydown is wiped out by about $6k of value loss. Plan a longer hold.
Negotiation context
- It's been on market 15 days — a 2% lower offer ($186k) is reasonable based on typical stale-listing flexibility.
- Current owner paid $56k; list at $189k implies a 238% gain — meaningful room to come down on a strong offer.
Risks & watch-outs
- Watch-outs: property tax is 2.7% of price; built in 1943 — expect roof / HVAC / electrical / plumbing capex.
Questions for the listing agent
- Built in 1943 — when were the roof, HVAC, electrical panel, plumbing, and water heater last replaced?
- Property tax is high relative to price — has the assessment been appealed recently, and will the sale trigger a re-assessment?
- Is there a deadline driving the sale (1031 exchange, divorce, estate, relocation)? That informs how much negotiation room exists.
- Schools are B-rated — typically a magnet for longer-tenancy family renters. What's the average tenant stay here, and is there a school-zone premium baked into asking?
- What's the average days-on-market for RENTAL listings here right now (not sales)? A rising rental-DOM trend means longer vacancies and softer asking-rent achievability than the comps imply.
- What's the recent tenant-quality profile in this submarket — average credit score on applications, eviction rate, late-payment / NSF rate, and stable-employment percentage? A property-management company in the area should have these aggregated.
- How much new for-sale + rental construction is in the pipeline within 1–3 miles? Heavy new supply typically softens prices + rents 12–24 months out; constrained supply supports both.
Investment metrics
- 1% rule
- 1.16% ✓
- Cap rate
- 7.80%
- Cash-on-cash
- 5.40%
- DSCR
- 1.24
- GRM
- 7.2
CMA / ARV
- ARV (on-the-fly)
- $201,348
- Comps found
- 1
Show comp detail 1 sale within ~0.75 mi
| Address | Dist | Beds/Ba | Sqft | Sold | Price | $/sf | Match |
|---|---|---|---|---|---|---|---|
| 56 Awood Pl | 0.25mi | 4/2.0 | 1,452 (+2%) | 21mo | $205,000 | $141 | 68 |
Match score weights: distance 35% · size 25% · config 20% · recency 20%. Top-matched comps best support the ARV.
Projected returns pro-forma
-3.0% appreciation · 3.0% rent growth · sell at horizon
- IRR
- -7.8%
- Equity multiple
- 0.71×
- Total profit
- $-15,321
- Equity at exit
- $28,181
- IRR
- 1.8%
- Equity multiple
- 1.13×
- Total profit
- $6,774
- Equity at exit
- $16,341
Cash invested: $52,920 (down + closing). Projections, not guarantees.
Landlord ↔ Tenant lean methodology
- Overall (STATE)
- 15 Strongly Tenant-Friendly
- State New York
- 15 Strongly Tenant-Friendly · D+10
- County
- — inherits STATE
- City
- — inherits STATE
ZIP-level market 14225
- Home prices YoY
- -27.3%
- Active inventory
- 209
- Price-to-rent
- 7.2×
Monthly cashflow live
- Estimated rent
- $2,189 medium interval (Pro) →
- Mortgage (P&I)
- −$991
- Tax from tax record
- −$421 /mo · $5,056/yr
- Insurance
- −$79
- HOA
- −$0
- Vacancy / Maint / Mgmt
- −$460
- Net cashflow
- $238
Break-even live
Sensitivity live
| Price | -10% $345 | -5% $291 | +0% $238 | +5% $185 | +10% $131 |
|---|---|---|---|---|---|
| Rent | -10% $65 | -5% $152 | +0% $238 | +5% $324 | +10% $411 |
| Rate | -1.0pp $333 | -0.5pp $286 | base $238 | +0.5pp $189 | +1.0pp $139 |
UW: 25.0% down · 7.5% · 30yr · 1.5% tax · 5.0% vac · 8.0% maint · 8.0% mgmt
Financing live
Cash to close
- Down payment
- $47,250
- Closing costs
- $5,670
- Reserves months
- —
- Total cash needed
- —
Loan-product check · same deal, 3 products live
Conventional
25% down · 7.5% · 30yr
- Down + closing
- —
- Monthly P&I
- —
- Monthly cashflow
- —
- DSCR
- —
- Eligible?
- —
Personal DTI + credit; lowest rate.
DSCR
20% down · 8.5% · 30yr
- Down + closing
- —
- Monthly P&I
- —
- Monthly cashflow
- —
- DSCR
- —
- Eligible?
- —
No personal income docs; deal must DSCR.
Hard money
10% down · 12.0% · 12mo
- Down + closing
- —
- Monthly P&I
- —
- Monthly cashflow
- —
- DSCR
- —
- Eligible?
- —
Short-term bridge; refi at stabilization.
Rent comps 4 comps
| Address | Beds | Baths | Sqft | Rent | $/sqft | DOM | Units | Dist |
|---|---|---|---|---|---|---|---|---|
| 47 Awood Pl Buffalo, NY | 3.0 | 1.0 | 1840 | $1,500 | $0.82 | 3d | 1 | 0.21mi |
| 419 Cherokee Dr Buffalo, NY | 3.0 | 1.0 | 880 | $1,800 | $2.05 | 3d | 1 | 0.72mi |
| 44 Aurora Dr Buffalo, NY | 3.0 | 1.0 | 1272 | $3,300 | $2.59 | 3d | 1 | 1.33mi |
| 143 Reo Ave Buffalo, NY | 3.0 | 2.0 | 1143 | $1,600 | $1.40 | 13d | 1 | 1.35mi |
Listing history 3 events
-
2026-04-25status Pending
-
2026-04-10$189,000 Active
-
2016-07-29soldstatus $56,000
ⓘ Source: listings_history table (triggers on properties + properties_extension) + one-shot
backfill from property_details.listing_events for pre-trigger history.
Tax reassessment forecast NY · Partial reset (capped growth)
- Current annual tax
- $5,056 · $421/mo
- Projected year-2 tax
- $5,056 · $421/mo
- Expected delta
- $0/yr ($0/mo · 0.0%)
ⓘ Screening estimate from a state-policy table — verify with the county assessor before closing.
Climate risk First Street
- Flood 1/10 Low FEMA zone X (unshaded) · 0% chance over 30 yrs
- Wildfire 1/10 Low
- Heat 3/10 Moderate 7 d/yr ≥93°F today · 15 d/yr by 30 yrs out
- Wind 1/10 Low
- Air quality 3/10 Moderate 2 unhealthy d/yr today · 3 by 30 yrs out
Nearby sold comps map
Loading sold comps map…
Walkable amenities ~0.75 mi
Loading nearby amenities…
Taxation est. · year 1
- Rental income
- $26,267
- − Mortgage interest
- −$10,587
- − Property taxes
- −$5,056
- − Insurance
- −$945
- − Repairs & maintenance
- −$2,101
- − Management
- −$2,101
- − Depreciation
- −$5,498
- Taxable loss
- −$22
- Est. tax savings @ 24.0%
- +$5
- After-tax cash flow
- $2,861/yr
For passive investors: Depreciation is non-cash, so a rental often shows a tax loss while cash-flowing — sheltering income. Rental losses are passive: they offset passive income freely, and up to $25,000/yr can offset ordinary (W-2) income if you actively participate and your MAGI is under $100k (phasing out to $0 by $150k); unused losses carry forward. On sale, claimed depreciation is recaptured at up to 25%, and gains may owe capital-gains tax (a 1031 exchange can defer both). Figures are a year-1 estimate at your 24.0% rate — not tax advice; consult a CPA.
Schools (NCES district)
- District
- Cleveland Hill Union Free School District
- NCES district ID
- 3607680
- Math proficiency
- 42% ▼ -15.00%
- Reading proficiency
- 46% ▼ -9.00%
- Median HH income
- $50,785
- Composite
- 37.87/100
- National rank
- #4323
- State rank
- #468 of 590 in NY
Livability — Cheektowaga
- Score
- 84/100
- State rank
- #54
- US rank
- #811
Category grades
Schools grade is shown separately in the Schools card above.
Census & demographics
- Census place
- Cheektowaga, NY
- County
- Erie County · 714,559 people
- City population
- 55,470
- Metro
- Buffalo-Cheektowaga, NY
- Population (ZIP)
- 33,620
- Household income
- $67,237
- Rent vs Own
- Severe rent burden
- 991.0
Population outlook (Erie County) Hauer SSP2
- Today (2025)
- 933,037 people
- By 2030
- 935,181 · +0.2%
- By 2040
- 928,531 · -0.5%
- By 2050
- 905,725 · -2.9%
- By 2075
- 834,037 · -10.6%
- By 2100
- 708,033 · -24.1%
Race, ethnicity, and origin ACS 2023
- Neighborhood character
- Predominantly White (74%)
- Race & ethnicity
- White 74% Black 13% Two or more races 7% Hispanic / Latino 4% Asian 3%
- Common ancestry
- Romanian 21% Lithuanian 3% Iranian 1%
- Foreign-born
- 6% · Canada, Vietnam
- Languages at home
- 92% English-only · Other Indo-European 2% Spanish 2% Arabic 1%
Political lean MEDSL · Erie
- 2024 margin
- Lean D (+9.7) · D 54.8% · R 45.2%
- 2008→2024 swing
- -7.9pp toward R · 2008: 17.5pp · 2024: 9.7pp
- All cycles
- 2024: D+9.7 2020: D+14.7 2016: D+4.8 2012: D+15.6 2008: D+17.5
Not yet ingested
- Civics
- —
Market trends
- HPI YoY
- ▼ -120.26%
- Current HPI
- 320.6248
- Rent YoY
- —
- Metro
- Buffalo-Cheektowaga, NY
- State GDP YoY
- ▲ 2.60%
- F500 in state
- 92
Industry mix (Fortune 500 HQ in NY)
| Industry | F500 HQs | Revenue |
|---|---|---|
| Financial Services | 10 | $950B |
|
||
| Consumer Goods | 9 | $162B |
|
||
| Insurance | 4 | $225B |
|
||
| Telecommunications | 2 | $144B |
|
||
| Pharmaceuticals | 2 | $112B |
|
||
| Media / Entertainment | 2 | $69B |
|
||
Price history
+237.5% since first listed3 events — show timeline
- 2026-04-25 Pending — WNYREIS
- 2026-04-10 Listed $189,000 WNYREIS
- 2016-07-29 Sold (Public Records) $56,000 Public Records
Property tax history
+10.4%/yrLatest (2025): $5,056 · +0.9% YoY. Source: county tax records.
Cash-flow waterfall
monthlySold comps — $/sqft
last 12 mo · ≤1 miLoading sold comps…