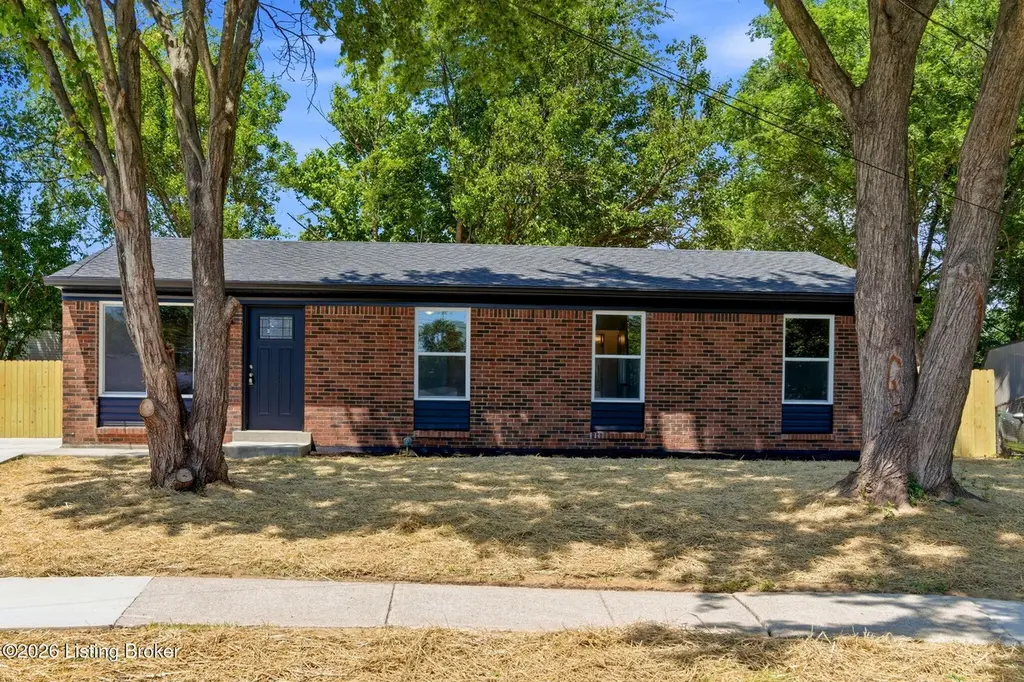
129 Steedland Ct · Hillview, KY
Flood risk 1/10 · Minimal
- FEMA flood zone
- X (unshaded)
- Chance of flooding over 30 yrs
- 0.0%
- Est. flood insurance / yr
- $473 – $860
Fire risk 2/10 · Minimal
- Est. fire insurance / yr
- $839 – $1,559
Heat risk 5/10 · Moderate
- Hot days now (above 104°F)
- 7 days/yr
- Hot days in 30 yrs
- 19 days/yr
Wind risk 2/10 · Minimal
- Chance of severe wind over 30 yrs
- 3.0%
Air-quality risk 3/10 · Minor
- Unhealthy air days now
- 2 days/yr
- Unhealthy air days in 30 yrs
- 5 days/yr
Risk factors via First Street. Map © Google.
Why this score? — see what drove the D- grade
The composite is a weighted blend of 9 inputs, each scored 0–100. Each bar is that input's sub-score; the figure is the points it added to the 100-point composite (weight × sub-score).
- Cash flow +15.3/30.0
- DSCR +4.7/10.0
- Rent growth +3.9/5.0
- Livability +3.3/5.0
- Schools +3.1/10.0
- 1% rule +3.0/10.0
- Condition / age +2.5/5.0
- ARV discount +1.5/15.0
- Appreciation +0.0/10.0
$249,333
🖨 Deal sheet (PDF) 📄 Offer letter ✓ Due diligence
Listing remarks MLS
Home being sold AS IS WHERE IS. 4 beds 2 full bath with 1,100 Sqft on the first floor. 1,100 sqft basement. Due to the condition of the home, lack of proper access and major safety and heath hazards, all buyers and agents will be required to sign a hold harmless before showing will be approved. If you would like to see the property or have questions about the condition prior to viewing, please contact listing agent.
Key facts
- Finished basement
- Privacy fence
- Granite countertops
Tags
Property features AI
Finance
- Other: Property listed as residential single-family residence
- HOA & community: No monthly maintenance or association fee; Located in the Maryville subdivision
Exterior
- Parking: Driveway parking
- Utilities: Electricity connected; Natural gas available; One HVAC unit for heating and one for cooling; Spray-in foam insulation
- Home design: Single-family ranch residence; One-story home; Open plan design
- Construction: Built in 1976; Shingle roof; Vinyl siding, aluminum siding, and wood frame construction; Poured concrete foundation
- Exterior features: Privacy wood fence enclosing the yard; Cleared lot; Located on a dead-end / cul-de-sac street; Sidewalks
Interior
- Kitchen: Kitchen on the first floor
- Bedrooms: 4 bedrooms, all on the first floor; Primary bedroom on the first floor
- Bathrooms: 2 full bathrooms, both on the first floor
- Heating & cooling: Forced air heating (natural gas); Central air conditioning
- Interior features: Finished basement; 8 total rooms; 8 closets; Living room on the first floor; Open plan interior
- Laundry & utility: No first-floor laundry
Neighborhood map
What this means for you Summary
Snapshot
- This is a 4-bed/2.0-bath single-family listed at $249k.
Deal economics
- At list price, monthly cash flow is $91 ($1k/yr) — positive.
- The deal already cash-flows at list — no discount required.
- To meet the 1% rule (rent ≥ 1% of price), the offer needs to be $199k (20.4% below list).
- Recommended offer: $199k (20.4% below list) — sets the bar for 1% rule.
- Cap rate 6.7% vs local median 3.8% in Hillview — top-decile yield for the area; either an underpriced asset or a hidden risk that comps aren't pricing in. Stress-test before assuming the spread holds.
Location & tenants
- Location reads 66/100 on livability (#235 in KY) — a middle-class / working-renter tenant base. Strengths: cost of living A+, housing A+, crime A-; Watch: amenities F, commute F, health & safety F.
- Bullitt County (suburban): math 29% / reading 41% proficiency, ranked #55 of 165 in KY (top 33%) — families likely to look elsewhere, expect single-tenant / working-renter base with shorter leases.
- Zoned schools: Maryville Elementary School (math 32% / reading 37%, grade F, #301 of 676 statewide, top 48%, 338 students, 70% FRL); Zoneton Middle School (math 18% / reading 35%, grade F, #175 of 217 statewide, top 81%, 354 students, 64% FRL); North Bullitt High School (math 30% / reading 28%, grade F, #150 of 254 statewide, top 59%, 1,148 students, 50% FRL) — zoned schools average 62% FRL vs 41% district-wide (21 pts higher); higher-poverty schools than district average — tighter screening recommended.
- Market conditions: Rents rising fast (+5.5%/yr); 244 active listings in the ZIP; 1 comparable units currently listed for rent nearby; solid renter incomes; 380 units permitted in Bullitt County in 2024 (8 in 5+ unit buildings).
Forward outlook
- Local home prices are declining (-3.0%/yr); year-one equity from $2k of loan paydown is wiped out by about $7k of value loss. Plan a longer hold.
- Bullitt County population projected at +22% by 2050 — long-run rental-demand tailwind backs the buy-and-hold thesis.
Negotiation context
- Only 12 days on market — expect competitive offers; lowballing is unlikely to land.
- 2 sale attempts; this cycle's ask has dropped $20k (7%) from the opening price — seller is motivated, your offer sets the floor, not the list.
- Current owner paid $77k; list at $249k implies a 223% gain — meaningful room to come down on a strong offer.
Risks & watch-outs
- Climate carrying-cost: extreme-heat days projected 7→19/yr by 2055 (HVAC capex compounding) — expect insurance premiums to compound above CPI over the hold.
Questions for the listing agent
- Built in 1976 — when were the roof, HVAC, electrical panel, plumbing, and water heater last replaced?
- Is there a deadline driving the sale (1031 exchange, divorce, estate, relocation)? That informs how much negotiation room exists.
- Schools are D-rated, which usually means shorter tenancies and higher turnover. Who's the typical renter profile here, and what's been the actual vacancy rate?
- The area grade is low — what's the realistic commute time and amenity access for the typical tenant pool here? Any planned neighborhood developments (good or bad) we should know about?
- What's the average days-on-market for RENTAL listings here right now (not sales)? A rising rental-DOM trend means longer vacancies and softer asking-rent achievability than the comps imply.
- What's the recent tenant-quality profile in this submarket — average credit score on applications, eviction rate, late-payment / NSF rate, and stable-employment percentage? A property-management company in the area should have these aggregated.
- How much new for-sale + rental construction is in the pipeline within 1–3 miles? Heavy new supply typically softens prices + rents 12–24 months out; constrained supply supports both.
Investment metrics
- 1% rule
- 0.80% ✗
- Cap rate
- 6.73%
- Cash-on-cash
- 1.57%
- DSCR
- 1.07
- GRM
- 10.5
CMA / ARV
- ARV (on-the-fly)
- $220,000
- Comps found
- 12
Show comp detail 12 sales within ~0.75 mi
| Address | Dist | Beds/Ba | Sqft | Sold | Price | $/sf | Match |
|---|---|---|---|---|---|---|---|
| 272 Sanna Dr | 0.14mi | 4/2.0 | 1,125 (+2%) | 4mo | $230,000 | $204 | 86 |
| 1004 Summitt Dr | 0.06mi | 3/1.0 (-1) | 1,125 (+2%) | 3mo | $170,000 | $151 | 82 |
| 12313 Kingsley Dr | 0.22mi | 3/2.0 (-1) | 1,078 (-2%) | 2mo | $244,900 | $227 | 79 |
| 1035 Summitt Dr | 0.10mi | 3/1.0 (-1) | 1,149 (+4%) | 3mo | $230,000 | $200 | 77 |
| 314 Summers Dr | 0.42mi | 4/1.0 | 1,075 (-2%) | 4mo | $136,000 | $127 | 70 |
| 244 Blossom Rd | 0.40mi | 3/1.0 (-1) | 1,125 (+2%) | 4mo | $241,000 | $214 | 65 |
| 149 N Circlecrest Dr | 0.60mi | 3/1.0 (-1) | 1,118 (+2%) | 2mo | $220,000 | $197 | 59 |
| 12437 Kingsley Dr | 0.49mi | 3/2.0 (-1) | 1,014 (-8%) | 1mo | $230,000 | $227 | 58 |
| 3311 Pioneer Trl | 0.52mi | 3/1.0 (-1) | 1,155 (+5%) | 6mo | $239,000 | $207 | 54 |
| 154 Greenbriar Ln | 0.61mi | 4/1.0 | 1,200 (+9%) | 5mo | $223,000 | $186 | 49 |
| 335 Dale Rd | 0.48mi | 3/1.0 (-1) | 980 (-11%) | 4mo | $184,000 | $188 | 47 |
| 262 Winston Ct | 0.46mi | 3/1.5 (-1) | 1,263 (+15%) | 1mo | $230,000 | $182 | 46 |
Match score weights: distance 35% · size 25% · config 20% · recency 20%. Top-matched comps best support the ARV.
Projected returns pro-forma
-3.0% appreciation · 5.46% rent growth · sell at horizon
- IRR
- -11.5%
- Equity multiple
- 0.57×
- Total profit
- $-29,677
- Equity at exit
- $37,176
- IRR
- 0.5%
- Equity multiple
- 1.04×
- Total profit
- $2,878
- Equity at exit
- $21,558
Cash invested: $69,813 (down + closing). Projections, not guarantees.
Landlord ↔ Tenant lean methodology
- Overall (STATE)
- 83 Strongly Landlord-Friendly
- State Kentucky
- 83 Strongly Landlord-Friendly · R+16
- County
- — inherits STATE
- City
- — inherits STATE
ZIP-level market 40229
- Rents YoY
- 5.5%
- Active inventory
- 244
- Price-to-rent
- 10.5×
Monthly cashflow live
- Estimated rent
- $1,985 medium interval (Pro) →
- Mortgage (P&I)
- −$1,308
- Tax from tax record
- −$66 /mo · $789/yr
- Insurance
- −$104
- HOA
- −$0
- Vacancy / Maint / Mgmt
- −$417
- Net cashflow
- $91
Break-even live
Sensitivity live
| Price | -10% $232 | -5% $162 | +0% $91 | +5% $21 | +10% $-50 |
|---|---|---|---|---|---|
| Rent | -10% $-66 | -5% $13 | +0% $91 | +5% $170 | +10% $248 |
| Rate | -1.0pp $217 | -0.5pp $155 | base $91 | +0.5pp $27 | +1.0pp $-39 |
UW: 25.0% down · 7.5% · 30yr · 1.5% tax · 5.0% vac · 8.0% maint · 8.0% mgmt
Financing live
Cash to close
- Down payment
- $62,333
- Closing costs
- $7,480
- Reserves months
- —
- Total cash needed
- —
Loan-product check · same deal, 3 products live
Conventional
25% down · 7.5% · 30yr
- Down + closing
- —
- Monthly P&I
- —
- Monthly cashflow
- —
- DSCR
- —
- Eligible?
- —
Personal DTI + credit; lowest rate.
DSCR
20% down · 8.5% · 30yr
- Down + closing
- —
- Monthly P&I
- —
- Monthly cashflow
- —
- DSCR
- —
- Eligible?
- —
No personal income docs; deal must DSCR.
Hard money
10% down · 12.0% · 12mo
- Down + closing
- —
- Monthly P&I
- —
- Monthly cashflow
- —
- DSCR
- —
- Eligible?
- —
Short-term bridge; refi at stabilization.
Rent comps 1 comps
| Address | Beds | Baths | Sqft | Rent | $/sqft | DOM | Units | Dist |
|---|---|---|---|---|---|---|---|---|
| 12426 Somerset Dr Louisville, KY | 3.0 | 2.0 | 1053 | $1,795 | $1.70 | 25d | 1 | 0.41mi |
Listing history 7 events
-
2026-05-17status Pending
-
2026-05-15price $249,333
-
2026-05-05$269,333 Active
-
2025-11-24soldstatus $77,250 Closed 419-char remark
Show marketing remark (419 chars)
Home being sold AS IS WHERE IS. 4 beds 2 full bath with 1,100 Sqft on the first floor. 1,100 sqft basement. Due to the condition of the home, lack of proper access and major safety and heath hazards, all buyers and agents will be required to sign a hold harmless before showing will be approved. If you would like to see the property or have questions about the condition prior to viewing, please contact listing agent.
-
2025-09-12status Pending 419-char remark
Show marketing remark (419 chars)
Home being sold AS IS WHERE IS. 4 beds 2 full bath with 1,100 Sqft on the first floor. 1,100 sqft basement. Due to the condition of the home, lack of proper access and major safety and heath hazards, all buyers and agents will be required to sign a hold harmless before showing will be approved. If you would like to see the property or have questions about the condition prior to viewing, please contact listing agent.
-
2025-09-05$80,000 Active 419-char remark
Show marketing remark (419 chars)
Home being sold AS IS WHERE IS. 4 beds 2 full bath with 1,100 Sqft on the first floor. 1,100 sqft basement. Due to the condition of the home, lack of proper access and major safety and heath hazards, all buyers and agents will be required to sign a hold harmless before showing will be approved. If you would like to see the property or have questions about the condition prior to viewing, please contact listing agent.
-
1973-12-01soldstatus $49,300
ⓘ Source: listings_history table (triggers on properties + properties_extension) + one-shot
backfill from property_details.listing_events for pre-trigger history.
Tax reassessment forecast KY · Resets to sale price
- Current annual tax
- $789 · $66/mo
- Projected year-2 tax
- $2,144 · $179/mo
- Expected delta
- +$1,355/yr (+$113/mo · 171.6%)
ⓘ Screening estimate from a state-policy table — verify with the county assessor before closing.
Climate risk First Street
- Flood 1/10 Low FEMA zone X (unshaded) · 0% chance over 30 yrs
- Wildfire 2/10 Low
- Heat 5/10 Major 7 d/yr ≥104°F today · 19 d/yr by 30 yrs out
- Wind 2/10 Low 3% chance of damaging wind over 30 yrs
- Air quality 3/10 Moderate 2 unhealthy d/yr today · 5 by 30 yrs out
Nearby sold comps map
Loading sold comps map…
Walkable amenities ~0.75 mi
Loading nearby amenities…
Taxation est. · year 1
- Rental income
- $23,825
- − Mortgage interest
- −$13,967
- − Property taxes
- −$789
- − Insurance
- −$1,247
- − Repairs & maintenance
- −$1,906
- − Management
- −$1,906
- − Depreciation
- −$7,253
- Taxable loss
- −$3,243
- Est. tax savings @ 24.0%
- +$778
- After-tax cash flow
- $1,873/yr
For passive investors: Depreciation is non-cash, so a rental often shows a tax loss while cash-flowing — sheltering income. Rental losses are passive: they offset passive income freely, and up to $25,000/yr can offset ordinary (W-2) income if you actively participate and your MAGI is under $100k (phasing out to $0 by $150k); unused losses carry forward. On sale, claimed depreciation is recaptured at up to 25%, and gains may owe capital-gains tax (a 1031 exchange can defer both). Figures are a year-1 estimate at your 24.0% rate — not tax advice; consult a CPA.
Schools (NCES district)
- District
- Bullitt County
- NCES district ID
- 2100750
- Math proficiency
- 29% ▼ -15.00%
- Reading proficiency
- 41% ▼ -14.00%
- Median HH income
- $55,009
- Composite
- 30.78/100
- National rank
- #6151
- State rank
- #55 of 165 in KY
Livability — Hillview
- Score
- 66/100
- State rank
- #235
- US rank
- #11507
Category grades
Schools grade is shown separately in the Schools card above.
Census & demographics
- Census place
- Hillview, KY
- County
- Jefferson County · 790,184 people
- Metro
- Louisville/Jefferson County, KY-IN
- Population (ZIP)
- 41,299
- Household income
- $79,936
- Rent vs Own
- Severe rent burden
- 628.0
Population outlook (Bullitt County) Hauer SSP2
- Today (2025)
- 89,555 people
- By 2030
- 94,389 · +5.4%
- By 2040
- 102,759 · +14.7%
- By 2050
- 108,955 · +21.7%
- By 2075
- 121,898 · +36.1%
- By 2100
- 126,383 · +41.1%
Race, ethnicity, and origin ACS 2023
- Neighborhood character
- Predominantly White (71%)
- Race & ethnicity
- White 71% Black 12% Hispanic / Latino 12% Two or more races 9% Asian 1%
- Hispanic origin (detail)
- Mexican 3% Cuban 6%
- Common ancestry
- Lithuanian 2% Slovak 2% Italian 1%
- Foreign-born
- 9% · Canada
- Languages at home
- 87% English-only · Spanish 10% Other Indo-European 1%
Political lean MEDSL · Bullitt
- 2024 margin
- Solid R (+51.0) · D 23.8% · R 74.8% · Other 1.4%
- 2008→2024 swing
- -18.7pp toward R · 2008: -32.3pp · 2024: -51.0pp
- All cycles
- 2024: R+51.0 2020: R+48.0 2016: R+49.8 2012: R+35.7 2008: R+32.3
Not yet ingested
- Civics
- —
Market trends
- HPI YoY
- ▼ -148.38%
- Current HPI
- 244.2747
- Rent YoY
- ▲ 5.46%
- Metro
- Louisville/Jefferson County, KY-IN
- State GDP YoY
- ▲ 1.81%
- F500 in state
- 4
Industry mix (Fortune 500 HQ in KY)
| Industry | F500 HQs | Revenue |
|---|---|---|
| Healthcare | 1 | $118B |
|
||
| Food / Beverage | 1 | $7B |
|
||
Price history
+405.7% since first listed7 events — show timeline
- 2026-05-17 Pending — Metro Search MLS
- 2026-05-15 Price Changed $249,333 Metro Search MLS
- 2026-05-05 Listed $269,333 Metro Search MLS
- 2025-11-24 Sold (MLS) $77,250 Metro Search MLS
- 2025-09-12 Pending — Metro Search MLS
- 2025-09-05 Listed $80,000 Metro Search MLS
- 1973-12-01 Sold (Public Records) $49,300 Public Records
Property tax history
-2.6%/yrLatest (2025): $789 · -5.4% YoY. Source: county tax records.
Cash-flow waterfall
monthlySold comps — $/sqft
last 12 mo · ≤1 miLoading sold comps…