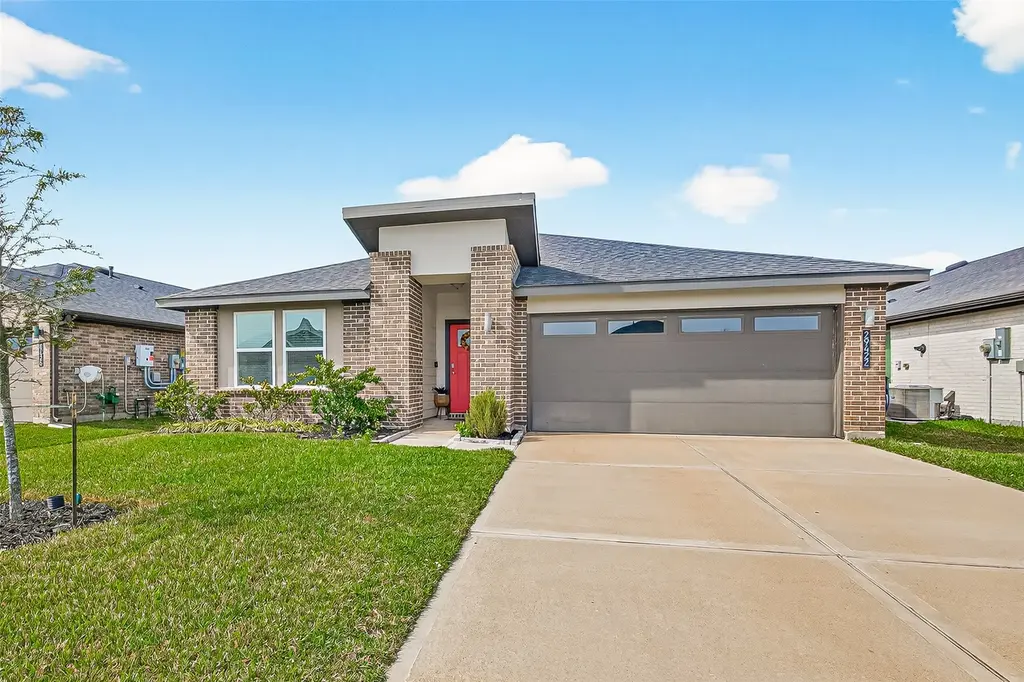
29422 Paytons Park Ct · Fulshear, TX
Flood risk 3/10 · Minor
- FEMA flood zone
- X (unshaded)
- Chance of flooding over 30 yrs
- 0.2%
- Est. flood insurance / yr
- $507 – $1,088
Fire risk 4/10 · Minor
- Est. fire insurance / yr
- $1,222 – $2,270
Heat risk 9/10 · Severe
- Hot days now (above 110°F)
- 7 days/yr
- Hot days in 30 yrs
- 22 days/yr
Wind risk 9/10 · Severe
- Chance of severe wind over 30 yrs
- 99.0%
Air-quality risk 2/10 · Minimal
- Unhealthy air days now
- 1 days/yr
- Unhealthy air days in 30 yrs
- 1 days/yr
Risk factors via First Street. Map © Google.
Why this score? — see what drove the D- grade
The composite is a weighted blend of 9 inputs, each scored 0–100. Each bar is that input's sub-score; the figure is the points it added to the 100-point composite (weight × sub-score).
- ARV discount +13.2/15.0
- Cash flow +6.8/30.0
- Schools +4.6/10.0
- Condition / age +4.0/5.0
- 1% rule +3.7/10.0
- Livability +3.5/5.0
- Rent growth +1.6/5.0
- DSCR +1.0/10.0
- Appreciation +0.0/10.0
$299,990
🖨 Deal sheet 📄 Offer letter ✓ Due diligence
Listing remarks MLS
One-story home featuring 4 bedrooms, 2 baths, and 2 car garage. The entry opens to the guest bedrooms, bath with linen closet. Center kitchen includes breakfast bar with beautiful counter tops and stainless steel appliances. Open concept floorplan boasts large combined family room and dining area. The primary suite features a sloped ceiling and attractive primary bath with dual vanities, water closet and walk-in closet. Covered patio, ready for the week-end BBQ's! Tank-less water heater! Express Homes makes it too easy to find your perfect home! Tamarron offers everything you are looking for in a family friendly community- resort pool, splash-pad, fitness center, lakes & walking trails all included and ready for you!Call today to schedule an appointment!
Key facts
- Combined family room
- Covered patio
- Guest bedrooms
Tags
Neighborhood map
What this means for you Summary
Snapshot
- This is a 3-bed/2.0-bath single-family listed at $300k. Condition is rated good.
Deal economics
- At list price, monthly cash flow is $-466 ($-6k/yr) — negative.
- To cash-flow at today's rent, offer at most $218k (27.4% below list).
- To meet the 1% rule (rent ≥ 1% of price), the offer needs to be $262k (12.5% below list).
- Recommended offer: $218k (27.4% below list) — sets the bar for cash-flow.
- Cap rate 4.4% vs local median 3.2% in Fulshear — top-decile yield for the area; either an underpriced asset or a hidden risk that comps aren't pricing in. Stress-test before assuming the spread holds.
Location & tenants
- Location reads 69/100 on livability (#430 in TX) — a middle-class / working-renter tenant base. Strengths: schools A+, crime A+, employment A+; Watch: amenities F, commute F, cost of living F.
- Lamar CISD (suburban): math 50% / reading 53% proficiency, ranked #116 of 826 in TX (top 14%) — acceptable for families but not a draw, mixed tenant base, ~2y average lease.
- Market conditions: Rents falling (-3.5%/yr); 1015 active listings in the ZIP; 12 comparable units currently listed for rent nearby; rentals leasing fast (median 5d on market — plan ~1-2 weeks tenant-placement turnaround); high-income renter base; 12,093 units permitted in Fort Bend County in 2024 (815 in 5+ unit buildings).
Forward outlook
- Local home prices are declining (-3.0%/yr); year-one equity from $2k of loan paydown is wiped out by about $9k of value loss. Plan a longer hold.
- Fort Bend County population projected at +75% by 2050 — long-run rental-demand tailwind backs the buy-and-hold thesis.
Negotiation context
- It's been on market 93 days — a 9% lower offer ($273k) is reasonable based on typical stale-listing flexibility.
Risks & watch-outs
- Watch-outs: property tax is 2.9% of price.
- Climate carrying-cost: severe wind risk, 99% chance of damaging wind over 30y; extreme-heat days projected 7→22/yr by 2055 (HVAC capex compounding) — expect insurance premiums to compound above CPI over the hold.
Questions for the listing agent
- What do current leases actually rent for vs. the listed asking? Can we see a recent rent roll and the last 12 months of T-12 income?
- It's been on market 93 days. Have you received any prior offers? Is the seller open to a 27% concession, seller financing, or rate buy-down credit?
- Property tax is high relative to price — has the assessment been appealed recently, and will the sale trigger a re-assessment?
- What does the HOA fee cover, when was the last increase, and are there any pending special assessments or reserve-fund shortfalls?
- Why hasn't it sold? Are there any deal-killer items the seller is aware of (foundation, flood, title, zoning, code violations)?
- Is there a deadline driving the sale (1031 exchange, divorce, estate, relocation)? That informs how much negotiation room exists.
- Schools are A-rated — typically a magnet for longer-tenancy family renters. What's the average tenant stay here, and is there a school-zone premium baked into asking?
- The area grade is low — what's the realistic commute time and amenity access for the typical tenant pool here? Any planned neighborhood developments (good or bad) we should know about?
- What's the average days-on-market for RENTAL listings here right now (not sales)? A rising rental-DOM trend means longer vacancies and softer asking-rent achievability than the comps imply.
- What's the recent tenant-quality profile in this submarket — average credit score on applications, eviction rate, late-payment / NSF rate, and stable-employment percentage? A property-management company in the area should have these aggregated.
- How much new for-sale + rental construction is in the pipeline within 1–3 miles? Heavy new supply typically softens prices + rents 12–24 months out; constrained supply supports both.
Investment metrics
- 1% rule
- 0.87% ✗
- Cap rate
- 4.43%
- Cash-on-cash
- -6.66%
- DSCR
- 0.70
- GRM
- 9.5
CMA / ARV
- ARV (median comp)
- $343,405
- List price
- $299,990
- Delta
- -12.64%
- Verdict
- UNDERPRICED
- Comps
- 20 within 1.0 mi
Show comp detail 12 sales within ~0.75 mi
| Address | Dist | Beds/Ba | Sqft | Sold | Price | $/sf | Match |
|---|---|---|---|---|---|---|---|
| 3722 Daintree Park Ct | 0.32mi | 3/2.0 | 1,844 (-2%) | 1mo | $325,000 | $176 | 82 |
| 3814 Lila Lake Ln | 0.17mi | 4/2.0 (+1) | 1,824 (-3%) | 2mo | $300,000 | $164 | 81 |
| 3626 Colorado Bend Dr | 0.40mi | 3/2.0 | 2,057 (+10%) | 2mo | $365,000 | $177 | 63 |
| 3215 Zephyr Park Ln | 0.63mi | 3/2.0 | 1,685 (-10%) | 1mo | $280,000 | $166 | 53 |
| 3703 Turnpike Dr | 0.73mi | 4/2.0 (+1) | 1,778 (-5%) | 2mo | $314,990 | $177 | 51 |
| 3622 Turnpike Dr | 0.75mi | 4/2.0 (+1) | 1,778 (-5%) | 1mo | $304,990 | $172 | 50 |
| 3606 Turnpike Dr | 0.75mi | 4/2.0 (+1) | 1,778 (-5%) | 3mo | $314,990 | $177 | 49 |
| 3731 Turnpike Dr | 0.73mi | 4/2.0 (+1) | 1,717 (-8%) | 1mo | $299,990 | $175 | 46 |
| 3523 Turnpike Dr | 0.73mi | 4/2.0 (+1) | 1,717 (-8%) | 2mo | $309,990 | $181 | 45 |
| 3610 Turnpike Dr | 0.75mi | 4/2.0 (+1) | 1,717 (-8%) | 2mo | $306,990 | $179 | 44 |
| 3710 Turnpike Dr | 0.75mi | 4/2.0 (+1) | 1,717 (-8%) | 3mo | $304,990 | $178 | 44 |
| 3614 Turnpike Dr | 0.75mi | 4/2.5 (+1) | 2,042 (+9%) | 2mo | $322,990 | $158 | 42 |
Match score weights: distance 35% · size 25% · config 20% · recency 20%. Top-matched comps best support the ARV.
Projected returns pro-forma
-3.0% appreciation · 0.0% rent growth · sell at horizon
- IRR
- -32.0%
- Equity multiple
- -0.02×
- Total profit
- $-85,647
- Equity at exit
- $44,729
- IRR
- -65.5%
- Equity multiple
- -0.68×
- Total profit
- $-141,183
- Equity at exit
- $25,938
Cash invested: $83,997 (down + closing). Projections, not guarantees.
Landlord ↔ Tenant lean methodology
- Overall (STATE)
- 87 Strongly Landlord-Friendly
- State Texas
- 87 Strongly Landlord-Friendly · R+5
- County
- — inherits STATE
- City
- — inherits STATE
ZIP-level market 77494
- Home prices YoY
- -32.5%
- Rents YoY
- -3.5%
- Active inventory
- 1015
- Price-to-rent
- 9.5×
Monthly cashflow live
- Estimated rent
- $2,624 high interval (Pro) →
- Mortgage (P&I)
- −$1,573
- Tax from tax record
- −$733 /mo · $8,794/yr
- Insurance
- −$125
- HOA
- −$108
- Vacancy / Maint / Mgmt
- −$551
- Net cashflow
- $-466
Break-even live
UW: 25.0% down · 7.5% · 30yr · 1.5% tax · 5.0% vac · 8.0% maint · 8.0% mgmt
Financing live
Cash to close
- Down payment
- $74,998
- Closing costs
- $9,000
- Reserves months
- —
- Total cash needed
- —
Loan-product check · same deal, 3 products live
Conventional
25% down · 7.5% · 30yr
- Down + closing
- —
- Monthly P&I
- —
- Monthly cashflow
- —
- DSCR
- —
- Eligible?
- —
Personal DTI + credit; lowest rate.
DSCR
20% down · 8.5% · 30yr
- Down + closing
- —
- Monthly P&I
- —
- Monthly cashflow
- —
- DSCR
- —
- Eligible?
- —
No personal income docs; deal must DSCR.
Hard money
10% down · 12.0% · 12mo
- Down + closing
- —
- Monthly P&I
- —
- Monthly cashflow
- —
- DSCR
- —
- Eligible?
- —
Short-term bridge; refi at stabilization.
Rent comps 12 comps
| Address | Beds | Baths | Sqft | Rent | $/sqft | DOM | Units | Dist |
|---|---|---|---|---|---|---|---|---|
| 29418 Sydney Stone Ln Katy, TX | 4.0 | 3.0 | 2571 | $3,490 | $1.36 | 43d | 1 | 0.12mi |
| 3615 Texas Heritage Pkwy Katy, TX | 1.0–3.0 | 1.0–2.0 | 1028 | $2,366 | $2.30 | 1d | 38 | 0.33mi |
| 3711 Daintree Park Dr Katy, TX | 3.0 | 2.0 | 1892 | $2,101 | $1.11 | 19d | 1 | 0.46mi |
| 29403 Cayman Canyon Way Katy, TX | 3.0–5.0 | 2.0 | 1679 | $2,132 | $1.27 | 1d | 17 | 0.59mi |
| 29202 Jarvis Bay Pass Katy, TX | 4.0 | 2.0 | 1563 | $2,200 | $1.41 | 5d | 1 | 0.87mi |
| 30131 Ousel Falls Ln Brookshire, TX | 3.0 | 2.0 | 1574 | $2,150 | $1.37 | 43d | 1 | 0.99mi |
| 30375 Centipede Grove Ln Brookshire, TX | 4.0 | 3.0 | 2400 | $2,900 | $1.21 | 43d | 1 | 1.11mi |
| 3551 Shearwater St Katy, TX | 4.0 | 2.5 | 2054 | $2,500 | $1.22 | 43d | 1 | 1.18mi |
| 3702 Mirabeau Dr Katy, TX | 2.0–4.0 | 2.5 | 1875 | $3,102 | $1.65 | 1d | 1 | 1.29mi |
| 3714 Sloane Peak Ln Fulshear, TX | 3.0–4.0 | 2.0–2.5 | 1713 | $2,170 | $1.27 | 1d | 25 | 1.31mi |
| 28100 Tamarron Pkwy Katy, TX | 1.0–3.0 | 1.0–2.0 | 1007 | $2,321 | $2.30 | 3d | 26 | 1.42mi |
| 29655 Jordan Crossing Blvd Brookshire, TX | 1.0–3.0 | 1.0–2.0 | 1044 | $2,434 | $2.33 | 1d | 30 | 1.48mi |
HOA detail
- Monthly dues
- $108 · $1,296/yr
- Likely covers
- waterpoolgym
Listing history 15 events
-
2026-06-18days on market $299,990 Active 93 DOM
-
2026-06-17days on market $299,990 Active 92 DOM
-
2026-06-16days on market $299,990 Active 91 DOM
-
2026-06-15days on market $299,990 Active 90 DOM
-
2026-06-13days on market $299,990 Active 88 DOM
-
2026-06-10days on market $299,990 Active 84 DOM
-
2026-06-08days on market $299,990 Active 83 DOM
-
2026-06-07days on market $299,990 Active 82 DOM
-
2026-06-04days on market $299,990 Active 79 DOM
-
2026-06-03days on market $299,990 Active 78 DOM
-
2026-06-02days on market $299,990 Active 77 DOM
-
2026-06-01days on market $299,990 Active 76 DOM
-
2026-05-31days on market $299,990 Active 75 DOM
-
2026-05-17price $309,000 769-char remark
Show marketing remark (769 chars)
One-story home featuring 4 bedrooms, 2 baths, and 2 car garage. The entry opens to the guest bedrooms, bath with linen closet. Center kitchen includes breakfast bar with beautiful counter tops and stainless steel appliances. Open concept floorplan boasts large combined family room and dining area. The primary suite features a sloped ceiling and attractive primary bath with dual vanities, water closet and walk-in closet. Covered patio, ready for the week-end BBQ's! Tank-less water heater! Express Homes makes it too easy to find your perfect home! Tamarron offers everything you are looking for in a family friendly community- resort pool, splash-pad, fitness center, lakes & walking trails all included and ready for you!Call today to schedule an appointment!
-
2026-03-17$317,000 Active 769-char remark
Show marketing remark (769 chars)
One-story home featuring 4 bedrooms, 2 baths, and 2 car garage. The entry opens to the guest bedrooms, bath with linen closet. Center kitchen includes breakfast bar with beautiful counter tops and stainless steel appliances. Open concept floorplan boasts large combined family room and dining area. The primary suite features a sloped ceiling and attractive primary bath with dual vanities, water closet and walk-in closet. Covered patio, ready for the week-end BBQ's! Tank-less water heater! Express Homes makes it too easy to find your perfect home! Tamarron offers everything you are looking for in a family friendly community- resort pool, splash-pad, fitness center, lakes & walking trails all included and ready for you!Call today to schedule an appointment!
ⓘ Source: listings_history table (triggers on properties + properties_extension) + one-shot
backfill from property_details.listing_events for pre-trigger history.
Tax reassessment forecast TX · Resets to sale price
- Current annual tax
- $8,794 · $733/mo
- Projected year-2 tax
- $8,794 · $733/mo
- Expected delta
- $0/yr ($0/mo · 0.0%)
ⓘ Screening estimate from a state-policy table — verify with the county assessor before closing.
Climate risk First Street
- Flood 3/10 Moderate FEMA zone X (unshaded) · 20% chance over 30 yrs
- Wildfire 4/10 Moderate
- Heat 9/10 Extreme 7 d/yr ≥110°F today · 22 d/yr by 30 yrs out
- Wind 9/10 Extreme 99% chance of damaging wind over 30 yrs
- Air quality 2/10 Low 1 unhealthy d/yr today · 1 by 30 yrs out
Nearby sold comps map
Loading sold comps map…
Walkable amenities ~0.75 mi
Loading nearby amenities…
Taxation est. · year 1
- Rental income
- $31,491
- − Mortgage interest
- −$16,804
- − Property taxes
- −$8,794
- − Insurance
- −$1,500
- − Repairs & maintenance
- −$2,519
- − Management
- −$2,519
- − HOA
- −$1,296
- − Depreciation
- −$8,727
- Taxable loss
- −$10,669
- Est. tax savings @ 24.0%
- +$2,560
- After-tax cash flow
- $-3,030/yr
For passive investors: Depreciation is non-cash, so a rental often shows a tax loss while cash-flowing — sheltering income. Rental losses are passive: they offset passive income freely, and up to $25,000/yr can offset ordinary (W-2) income if you actively participate and your MAGI is under $100k (phasing out to $0 by $150k); unused losses carry forward. On sale, claimed depreciation is recaptured at up to 25%, and gains may owe capital-gains tax (a 1031 exchange can defer both). Figures are a year-1 estimate at your 24.0% rate — not tax advice; consult a CPA.
Condition & rehab AI · 13 photos
This one-story home is in good condition with a good condition score of 80. It has a good kitchen, bathrooms, roof, exterior, flooring, interior walls/paint, and systems. The home is ready for move-in and has a good curb appeal. The highest-ROI updates would be to paint the exterior and trim the landscaping to enhance curb appeal and improve property value.
Value-add opportunities
- Resale Paint exterior — Enhances curb appeal
- Rental Trim landscaping — Improves curb appeal and enhances property value
Renovation cost estimate screening
Value-add ROI direction
- Resale Paint exterior — Enhances curb appeal ↑
- Rental Trim landscaping — Improves curb appeal and enhances property value ↑
ⓘ Cost ranges are severity-bucket heuristics (US national rule-of-thumb). Get contractor quotes + a written scope before underwriting a rehab budget.
Schools (NCES district)
- District
- Lamar CISD
- NCES district ID
- 4826580
- Math proficiency
- 50% ▼ -12.00%
- Reading proficiency
- 53% ▼ -4.00%
- Median HH income
- $75,213
- Composite
- 46.43/100
- National rank
- #2452
- State rank
- #116 of 826 in TX
Livability — Fulshear
- Score
- 69/100
- State rank
- #430
- US rank
- #8901
Category grades
Schools grade is shown separately in the Schools card above.
Census & demographics
- County
- Fort Bend County · 836,777 people
- City population
- 41,324
- Metro
- Houston-The Woodlands-Sugar Land, TX
- Population (ZIP)
- 140,157
- Household income
- $148,720
- Rent vs Own
- Severe rent burden
- 3390.0
Population outlook (Fort Bend County) Hauer SSP2
- Today (2025)
- 1,004,526 people
- By 2030
- 1,153,104 · +14.8%
- By 2040
- 1,453,718 · +44.7%
- By 2050
- 1,753,781 · +74.6%
- By 2075
- 2,455,772 · +144.5%
- By 2100
- 2,930,528 · +191.7%
Race, ethnicity, and origin ACS 2023
- Neighborhood character
- Highly diverse neighborhood (Simpson 0.73)
- Race & ethnicity
- White 39% Hispanic / Latino 25% Asian 24% Two or more races 18% Black 8%
- Hispanic origin (detail)
- Mexican 8% Cuban 1%
- Common ancestry
- Romanian 2% Lithuanian 2% Italian 2%
- Foreign-born
- 39% · Canada, China, Vietnam
- Languages at home
- 54% English-only · Spanish 20% Other Indo-European 8% Other Asian/Pacific 5%
Political lean MEDSL · Fort Bend
- 2024 margin
- Toss-up / Even · D 49.5% · R 47.9% · Other 2.6%
- 2008→2024 swing
- +4.0pp toward D · 2008: -2.4pp · 2024: 1.6pp
- All cycles
- 2024: D+1.6 2020: D+10.6 2016: D+6.6 2012: R+6.8 2008: R+2.4
Not yet ingested
- Civics
- —
Market trends
- HPI YoY
- ▼ -110.62%
- Current HPI
- 229.7189
- Rent YoY
- ▼ -3.53%
- Metro
- Houston-The Woodlands-Sugar Land, TX
- State GDP YoY
- ▲ 3.95%
- F500 in state
- 110
Industry mix (Fortune 500 HQ in TX)
| Industry | F500 HQs | Revenue |
|---|---|---|
| Energy | 16 | $1,198B |
|
||
| Technology | 5 | $198B |
|
||
| Engineering / Construction | 4 | $72B |
|
||
| Energy Services | 3 | $60B |
|
||
| Utilities | 3 | $41B |
|
||
| Healthcare | 2 | $330B |
|
||
Price history
-2.5% since first listed2 events — show timeline
- 2026-05-17 Price Changed $309,000 HARMLS
- 2026-03-17 Listed $317,000 HARMLS
Property tax history
+20.0%/yrLatest (2025): $8,794 · +47.6% YoY. Source: county tax records.
Cash-flow waterfall
monthlySold comps — $/sqft
last 12 mo · ≤1 miLoading sold comps…