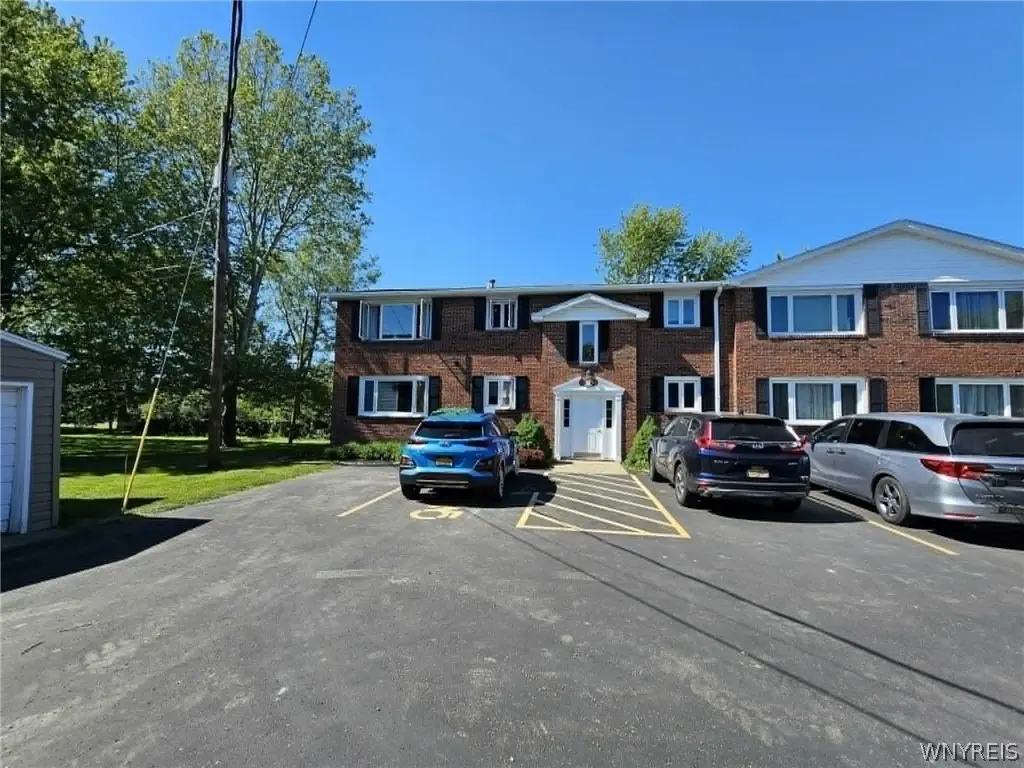
1050 Reserve Rd #3 · West Seneca, NY
Flood risk 5/10 · Moderate
- FEMA flood zone
- X (unshaded)
- Chance of flooding over 30 yrs
- 0.66%
- Est. flood insurance / yr
- $473 – $860
Fire risk 2/10 · Minimal
- Est. fire insurance / yr
- $691 – $1,283
Heat risk 2/10 · Minimal
- Hot days now (above 91°F)
- 7 days/yr
- Hot days in 30 yrs
- 16 days/yr
Wind risk 1/10 · Minimal
- Chance of severe wind over 30 yrs
- —
Air-quality risk 2/10 · Minimal
- Unhealthy air days now
- 1 days/yr
- Unhealthy air days in 30 yrs
- 2 days/yr
Risk factors via First Street. Map © Google.
Why this score? — see what drove the D grade
The composite is a weighted blend of 9 inputs, each scored 0–100. Each bar is that input's sub-score; the figure is the points it added to the 100-point composite (weight × sub-score).
- Cash flow +9.7/30.0
- ARV discount +7.5/15.0
- 1% rule +5.9/10.0
- Schools +5.8/10.0
- Livability +4.0/5.0
- DSCR +2.7/10.0
- Rent growth +2.5/5.0
- Condition / age +2.5/5.0
- Appreciation +0.0/10.0
$144,900
🖨 Deal sheet 📄 Offer letter ✓ Due diligence
Listing remarks MLS
Why rent when you can own?! This cozy 2nd floor end-unit condo features a bright/updated kitchen, central living room, 2 sizable bedrooms w/ closet built-ins, and a full bathroom w/ tile shower/tub. There are newer vinyl windows throughout, AC 24', and Furnace 21'. The basement houses your private 10'x15' storage room and coin/phone app operated laundry. HOA pays for snow removal, water/sewer bill, common area maintenance, and trash collection. Showings start Fri 11/8 @ 12pm. Open House Sat. 11/9 1pm-3pm. Offers will be reviewed Wed. 11/13 @ 12pm.
Key facts
- Large closets
- Updated kitchen
- Updated cabinetry
Tags
Property features AI
Finance
- Other: Resale property; Pets not allowed
- HOA & community: Association: Andruschat; Association fee $325 monthly; Fee covers common area maintenance, common area insurance, insurance, reserve fund, sewer, snow removal, trash, and water
Exterior
- Parking: No garage; Open parking available
- Utilities: Public water (connected); Sewer connected; Cable available
- Home design: Single-story brick home; Existing structure
- Construction: Brick construction; Asphalt roof
- Exterior features: Rectangular lot (approx. 33 x 30)
Interior
- Kitchen: Dishwasher; Disposal; Microwave; Gas water heater
- Bedrooms: 2 bedrooms on the main level
- Flooring: Carpet; Ceramic tile; Laminate; Varies
- Bathrooms: 1 full bathroom on the main level
- Heating & cooling: Forced air heating (gas); Central air conditioning
- Interior features: Eat-in kitchen; Separate/formal living room; Bedroom on main level; Full basement
- Laundry & utility: Laundry in basement
Neighborhood map
What this means for you Summary
Snapshot
- This is a 2-bed/1.0-bath condo listed at $145k.
Deal economics
- At list price, monthly cash flow is $-96 ($-1k/yr) — negative.
- To cash-flow at today's rent, offer at most $128k (11.8% below list).
- Meets the 1% rule at list price ($2k rent vs $145k).
- Recommended offer: $128k (11.8% below list) — sets the bar for cash-flow.
- Cap rate 5.5% vs local median 3.7% in West Seneca — top-decile yield for the area; either an underpriced asset or a hidden risk that comps aren't pricing in. Stress-test before assuming the spread holds.
Location & tenants
- Location reads 79/100 on livability (#130 in NY, #2,089 nationally) — a middle-class / working-renter tenant base. Strengths: housing A+, health & safety A+, crime A-; Watch: amenities D, commute F.
- Orchard Park Central School District (suburban): math 57% / reading 73% proficiency, ranked #158 of 590 in NY (top 27%) — acceptable for families but not a draw, mixed tenant base, ~2y average lease; only 8% free/reduced lunch — higher-income household profile.
- Market conditions: 201 active listings in the ZIP; 3 comparable units currently listed for rent nearby; rentals leasing fast (median 2d on market — plan ~1-2 weeks tenant-placement turnaround); 1,244 units permitted in Erie County in 2024 (563 in 5+ unit buildings).
Forward outlook
- Local home prices are declining (-3.0%/yr); year-one equity from $1k of loan paydown is wiped out by about $4k of value loss. Plan a longer hold.
Negotiation context
- Only 6 days on market — expect competitive offers; lowballing is unlikely to land.
- 5 sale attempts since 14y ago with the ask held roughly flat each time — persistent listings suggest the price (not the market) is what's stuck; bring a comps-based counter.
Risks & watch-outs
- Watch-outs: HOA is 21% of rent.
- Climate carrying-cost: moderate flood risk — expect insurance premiums to compound above CPI over the hold.
Questions for the listing agent
- What do current leases actually rent for vs. the listed asking? Can we see a recent rent roll and the last 12 months of T-12 income?
- Built in 1970 — when were the roof, HVAC, electrical panel, plumbing, and water heater last replaced?
- What does the HOA fee cover, when was the last increase, and are there any pending special assessments or reserve-fund shortfalls?
- Any open or pending special assessments — roof, HVAC, plumbing, elevator, façade? What's the per-unit balance and payoff schedule, and is the seller paying it off at close or rolling it to the buyer?
- Is there a deadline driving the sale (1031 exchange, divorce, estate, relocation)? That informs how much negotiation room exists.
- Schools are B-rated — typically a magnet for longer-tenancy family renters. What's the average tenant stay here, and is there a school-zone premium baked into asking?
- The area grade is low — what's the realistic commute time and amenity access for the typical tenant pool here? Any planned neighborhood developments (good or bad) we should know about?
- What's the average days-on-market for RENTAL listings here right now (not sales)? A rising rental-DOM trend means longer vacancies and softer asking-rent achievability than the comps imply.
- What's the recent tenant-quality profile in this submarket — average credit score on applications, eviction rate, late-payment / NSF rate, and stable-employment percentage? A property-management company in the area should have these aggregated.
- How much new apartment / multifamily construction is in the pipeline within 1–3 miles? Heavy new supply (>2% of stock underway) typically softens rents 12–24 months out; light construction supports rent growth.
Investment metrics
- 1% rule
- 1.09% ✓
- Cap rate
- 5.49%
- Cash-on-cash
- -2.85%
- DSCR
- 0.87
- GRM
- 7.6
CMA / ARV
No comps found within radius.
Projected returns pro-forma
-3.0% appreciation · 3.0% rent growth · sell at horizon
- IRR
- -20.8%
- Equity multiple
- 0.28×
- Total profit
- $-29,387
- Equity at exit
- $21,605
- IRR
- -13.7%
- Equity multiple
- 0.20×
- Total profit
- $-32,540
- Equity at exit
- $12,528
Cash invested: $40,572 (down + closing). Projections, not guarantees.
Landlord ↔ Tenant lean methodology
- Overall (STATE)
- 15 Strongly Tenant-Friendly
- State New York
- 15 Strongly Tenant-Friendly · D+10
- County
- — inherits STATE
- City
- — inherits STATE
ZIP-level market 14224
- Active inventory
- 201
- Price-to-rent
- 7.6×
Monthly cashflow live
- Estimated rent
- $1,584 medium interval (Pro) →
- Mortgage (P&I)
- −$760
- Tax from tax record
- −$202 /mo · $2,429/yr
- Insurance
- −$60
- HOA
- −$325
- Vacancy / Maint / Mgmt
- −$333
- Net cashflow
- $-96
Break-even live
UW: 25.0% down · 7.5% · 30yr · 1.5% tax · 5.0% vac · 8.0% maint · 8.0% mgmt
Financing live
Cash to close
- Down payment
- $36,225
- Closing costs
- $4,347
- Reserves months
- —
- Total cash needed
- —
Loan-product check · same deal, 3 products live
Conventional
25% down · 7.5% · 30yr
- Down + closing
- —
- Monthly P&I
- —
- Monthly cashflow
- —
- DSCR
- —
- Eligible?
- —
Personal DTI + credit; lowest rate.
DSCR
20% down · 8.5% · 30yr
- Down + closing
- —
- Monthly P&I
- —
- Monthly cashflow
- —
- DSCR
- —
- Eligible?
- —
No personal income docs; deal must DSCR.
Hard money
10% down · 12.0% · 12mo
- Down + closing
- —
- Monthly P&I
- —
- Monthly cashflow
- —
- DSCR
- —
- Eligible?
- —
Short-term bridge; refi at stabilization.
Rent comps 3 comps
| Address | Beds | Baths | Sqft | Rent | $/sqft | DOM | Units | Dist |
|---|---|---|---|---|---|---|---|---|
| 1420 Southwestern Blvd West Seneca, NY | 2.0 | 1.0 | 930 | $1,485 | $1.60 | 1d | 1 | 0.87mi |
| 1590 Southwestern Blvd Unit C16 Buffalo, NY | 1.0 | 1.0 | 1040 | $1,725 | $1.66 | 1d | 1 | 1.09mi |
| 220 Countryside Ln Orchard Park, NY | 2.0 | 1.0–1.5 | 900 | $1,568 | $1.74 | 1d | 1 | 1.11mi |
HOA detail condo
- Monthly dues
- $325 · $3,900/yr
- Likely covers
- watersewertrashsnow removal
- Assessments
- None detected in remarks — confirm with the listing agent.
Listing history 7 events
-
2026-06-13status $144,900 Pending 6 DOM
-
2026-06-10days on market $144,900 Active 6 DOM
-
2026-06-09days on market $144,900 Active 5 DOM
-
2026-06-08days on market $144,900 Active 4 DOM
-
2026-06-07days on market $144,900 Active 3 DOM
-
2026-06-05remarks 695-char remark
-
2026-06-05$144,900 Active 1 DOM
ⓘ Source: listings_history table (triggers on properties + properties_extension) + one-shot
backfill from property_details.listing_events for pre-trigger history.
Tax reassessment forecast NY · Partial reset (capped growth)
- Current annual tax
- $2,429 · $202/mo
- Projected year-2 tax
- $2,439 · $203/mo
- Expected delta
- +$10/yr (+$1/mo · 0.4%)
ⓘ Screening estimate from a state-policy table — verify with the county assessor before closing.
Climate risk First Street
- Flood 5/10 Major FEMA zone X (unshaded) · 66% chance over 30 yrs
- Wildfire 2/10 Low
- Heat 2/10 Low 7 d/yr ≥91°F today · 16 d/yr by 30 yrs out
- Wind 1/10 Low
- Air quality 2/10 Low 1 unhealthy d/yr today · 2 by 30 yrs out
Nearby sold comps map
Loading sold comps map…
Walkable amenities ~0.75 mi
Loading nearby amenities…
Taxation est. · year 1
- Rental income
- $19,005
- − Mortgage interest
- −$8,117
- − Property taxes
- −$2,429
- − Insurance
- −$724
- − Repairs & maintenance
- −$1,520
- − Management
- −$1,520
- − HOA
- −$3,900
- − Depreciation
- −$4,215
- Taxable loss
- −$3,421
- Est. tax savings @ 24.0%
- +$821
- After-tax cash flow
- $-337/yr
For passive investors: Depreciation is non-cash, so a rental often shows a tax loss while cash-flowing — sheltering income. Rental losses are passive: they offset passive income freely, and up to $25,000/yr can offset ordinary (W-2) income if you actively participate and your MAGI is under $100k (phasing out to $0 by $150k); unused losses carry forward. On sale, claimed depreciation is recaptured at up to 25%, and gains may owe capital-gains tax (a 1031 exchange can defer both). Figures are a year-1 estimate at your 24.0% rate — not tax advice; consult a CPA.
Schools (NCES district)
- District
- Orchard Park Central School District
- NCES district ID
- 3621900
- Math proficiency
- 57% ▼ -13.00%
- Reading proficiency
- 73% ▲ 6.00%
- Median HH income
- $79,354
- Composite
- 57.97/100
- National rank
- #1039
- State rank
- #158 of 590 in NY
Livability — West Seneca
- Score
- 79/100
- State rank
- #130
- US rank
- #2089
Category grades
Schools grade is shown separately in the Schools card above.
Census & demographics
- Census place
- West Seneca, NY
- City population
- 41,101
- Population (ZIP)
- 41,101
Population outlook (Erie County) Hauer SSP2
- Today (2025)
- 933,037 people
- By 2030
- 935,181 · +0.2%
- By 2040
- 928,531 · -0.5%
- By 2050
- 905,725 · -2.9%
- By 2075
- 834,037 · -10.6%
- By 2100
- 708,033 · -24.1%
Race, ethnicity, and origin ACS 2023
- Neighborhood character
- Predominantly White (91%)
- Race & ethnicity
- White 91% Hispanic / Latino 4% Two or more races 3% Black 2%
- Common ancestry
- Romanian 22% Lithuanian 2% Iranian 1%
- Foreign-born
- 2% · Canada
- Languages at home
- 95% English-only · Spanish 2% Russian/Polish/Slavic 1% Arabic 1%
Political lean MEDSL · Erie
- 2024 margin
- Lean D (+9.7) · D 54.8% · R 45.2%
- 2008→2024 swing
- -7.9pp toward R · 2008: 17.5pp · 2024: 9.7pp
- All cycles
- 2024: D+9.7 2020: D+14.7 2016: D+4.8 2012: D+15.6 2008: D+17.5
Not yet ingested
- Civics
- —
Market trends
- HPI YoY
- ▼ -211.03%
- Current HPI
- 303.7523
- Rent YoY
- —
- Metro
- —
- State GDP YoY
- ▲ 2.60%
- F500 in state
- 92
Industry mix (Fortune 500 HQ in NY)
| Industry | F500 HQs | Revenue |
|---|---|---|
| Financial Services | 10 | $950B |
|
||
| Consumer Goods | 9 | $162B |
|
||
| Insurance | 4 | $225B |
|
||
| Telecommunications | 2 | $144B |
|
||
| Pharmaceuticals | 2 | $112B |
|
||
| Media / Entertainment | 2 | $69B |
|
||
Price history
+163.5% since first listed15 events — show timeline
- 2026-06-04 Listed $144,900 WNYREIS
- 2025-02-06 Sold (MLS) $135,000 WNYREIS
- 2025-02-03 Sold (Public Records) $135,000 Public Records
- 2024-11-17 Pending — WNYREIS
- 2024-11-07 Listed $135,000 WNYREIS
- 2020-01-17 Sold (Public Records) $78,000 Public Records
- 2020-01-17 Sold (MLS) $78,000 WNYREIS
- 2019-10-28 Pending — WNYREIS
- 2019-10-24 Relisted — WNYREIS
- 2019-09-24 Pending — WNYREIS
- 2019-09-23 Pending — WNYREIS
- 2019-09-13 Price Changed $79,500 WNYREIS
- 2019-08-28 Listed $81,500 WNYREIS
- 2012-10-01 Listed $52,000 WNYREIS
- 2007-03-23 Sold (Public Records) $55,000 Public Records
Property tax history
+1.5%/yrLatest (2025): $2,429 · +0.4% YoY. Source: county tax records.
Cash-flow waterfall
monthlySold comps — $/sqft
last 12 mo · ≤1 miLoading sold comps…