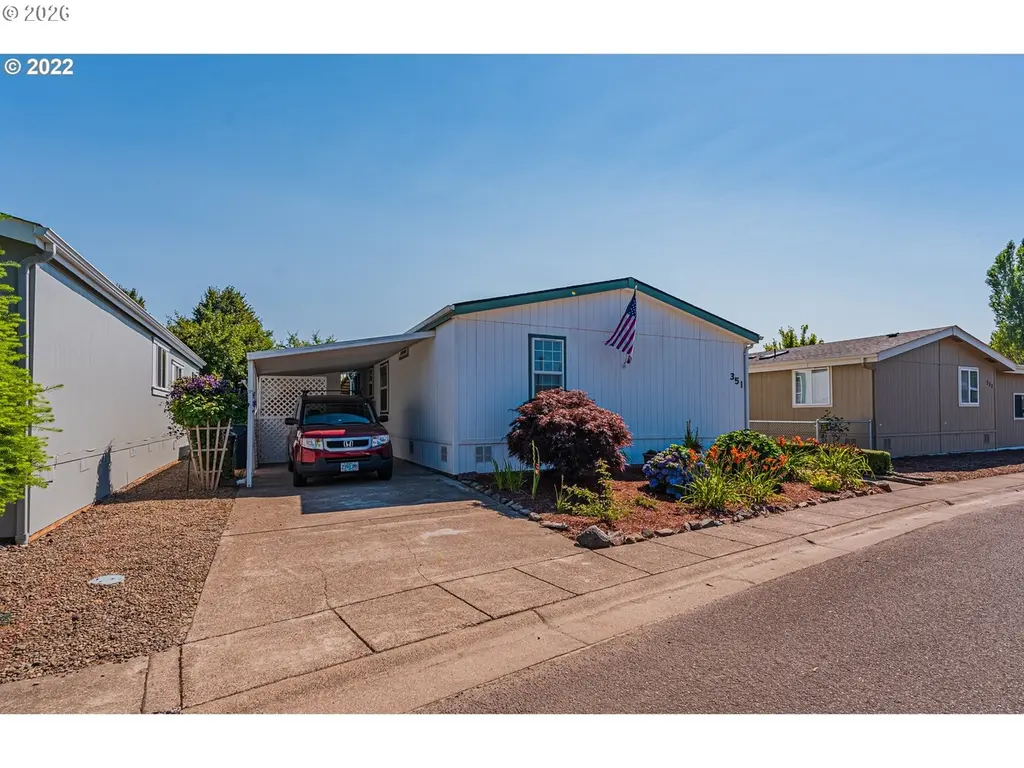
1699 N Terry St #351 · Eugene, OR
Flood risk 7/10 · Major
- FEMA flood zone
- X (unshaded)
- Chance of flooding over 30 yrs
- 0.99%
- Est. flood insurance / yr
- $507 – $1,088
Fire risk 5/10 · Moderate
- Est. fire insurance / yr
- $498 – $926
Heat risk 4/10 · Minor
- Hot days now (above 92°F)
- 7 days/yr
- Hot days in 30 yrs
- 15 days/yr
Wind risk 1/10 · Minimal
- Chance of severe wind over 30 yrs
- —
Air-quality risk 10/10 · Severe
- Unhealthy air days now
- 13 days/yr
- Unhealthy air days in 30 yrs
- 14 days/yr
Risk factors via First Street. Map © Google.
Why this score? — see what drove the B- grade
The composite is a weighted blend of 9 inputs, each scored 0–100. Each bar is that input's sub-score; the figure is the points it added to the 100-point composite (weight × sub-score).
- Cash flow +30.0/30.0
- 1% rule +10.0/10.0
- DSCR +10.0/10.0
- ARV discount +7.6/15.0
- Livability +4.0/5.0
- Rent growth +2.9/5.0
- Condition / age +2.5/5.0
- Schools +2.3/10.0
- Appreciation +0.0/10.0
$128,000
🖨 Deal sheet 📄 Offer letter ✓ Due diligence
Listing remarks MLS
Woodland Park Estates! 1996 Fleetwood in family park with approx. 1296 sq ft, 3 bedrooms & 2 full baths, open floor plan, kitchen with skylight & eating area, spacious master and roomy bathroom. Fenced yard with large deck which half is covered, spacious storage/outbuilding & gate providing access to the park. Home only/No Land. Buyer must have Park Approval. Please do not disturb tenant.
Key facts
- New front porch
- Large covered deck
- New interior paint
Tags
Property features AI
Finance
- Other: Leased land parcel; Paved road access
- Financial info: Land is leased (land-lease community); monthly lot rent applies; Land lease expiration: June 30, 2026
- HOA & community: Community amenities include athletic court, commons, gated access, gym, library, management, pool, recreation facilities, and spa/hot tub
Exterior
- Parking: Carport; Driveway; RV/boat storage
- Security: Security gate
- Utilities: Public water; Public sewer; Electric service
- Home design: Manufactured home in park; Residential property; Updated/remodeled; Single-story (main level living); Security gate
- Construction: Built in 1996; Pillar/post/pier foundation with skirting
- Exterior features: Composition roof; T-111 siding; Covered deck; Fenced yard; Basketball court on property; Park/greenbelt view; Trees; Level lot
Interior
- Kitchen: Dishwasher; Disposal; Free-standing range; Free-standing refrigerator
- Bedrooms: Primary bedroom (main level) with attached bathroom; Second bedroom (main level); Third bedroom (main level)
- Bathrooms: 2 full bathrooms (both on main level)
- Heating & cooling: Forced air heating; Heat pump (heating & cooling)
- Interior features: Laundry area; Vaulted ceilings; Double-pane windows
- Laundry & utility: Laundry included; Electric hot water
Neighborhood map
What this means for you Summary
Snapshot
- This is a 3-bed/2.0-bath manufactured listed at $128k.
Deal economics
- At list price, monthly cash flow is $834 ($10k/yr) — positive.
- The deal already cash-flows at list — no discount required.
- Meets the 1% rule at list price ($2k rent vs $128k).
- Cap rate 14.7% vs local median 2.8% in Eugene — top-decile yield for the area; either an underpriced asset or a hidden risk that comps aren't pricing in. Stress-test before assuming the spread holds.
Location & tenants
- Location reads 81/100 on livability (#52 in OR, #1,587 nationally) — a professional / high-income tenant draw. Strengths: amenities A+, commute A+, health & safety A+; Watch: employment C-, cost of living C-, crime D-.
- Bethel SD 52 (urban): math 18% / reading 34% proficiency, ranked #52 of 58 in OR (top 90%) — low school quality limits family demand, transient renter base, plan for 1-2y turnover.
- Zoned schools: Willamette High School (math 24% / reading 50%, grade F, #85 of 143 statewide, top 61%, 1,516 students, 35% FRL).
- Market conditions: Rents rising (+1.6%/yr); 297 active listings in the ZIP; 13 comparable units currently listed for rent nearby; rentals at typical pace (median 21d on market — plan ~3-4 weeks tenant-placement turnaround); 1,808 units permitted in Lane County in 2024 (972 in 5+ unit buildings).
- This rent runs 45% of the median local income ($58k/yr) — at the standard rent-burdened threshold; future hikes will face affordability resistance.
Forward outlook
- Local home prices are declining (-3.0%/yr); year-one equity from $885 of loan paydown is wiped out by about $4k of value loss. Plan a longer hold.
- Lane County population projected at +15% by 2050 — long-run rental-demand tailwind backs the buy-and-hold thesis.
- At projected returns (-3.0% appreciation + 1.6% rent growth), your $36k cash investment doubles in ~5 years — after that, you're playing with house money.
Negotiation context
- Only 3 days on market — expect competitive offers; lowballing is unlikely to land.
- 2 sale attempts since 10y ago with the ask held roughly flat each time — persistent listings suggest the price (not the market) is what's stuck; bring a comps-based counter.
- Current owner paid $34k; list at $128k implies a 275% gain — meaningful room to come down on a strong offer.
Risks & watch-outs
- Watch-outs: flood insurance adds $66/mo.
- Climate carrying-cost: major flood risk; moderate wildfire risk — expect insurance premiums to compound above CPI over the hold.
Questions for the listing agent
- What's the actual annual flood-insurance premium (NFIP or private), and is the property in a SFHA with mandatory coverage?
- Is there a deadline driving the sale (1031 exchange, divorce, estate, relocation)? That informs how much negotiation room exists.
- Schools are B-rated — typically a magnet for longer-tenancy family renters. What's the average tenant stay here, and is there a school-zone premium baked into asking?
- Crime grade is D in this area — have there been break-ins, vandalism, or insurance claims at this property in the last 3 years? What carrier currently insures it and at what premium?
- What's the average days-on-market for RENTAL listings here right now (not sales)? A rising rental-DOM trend means longer vacancies and softer asking-rent achievability than the comps imply.
- What's the recent tenant-quality profile in this submarket — average credit score on applications, eviction rate, late-payment / NSF rate, and stable-employment percentage? A property-management company in the area should have these aggregated.
- How much new for-sale + rental construction is in the pipeline within 1–3 miles? Heavy new supply typically softens prices + rents 12–24 months out; constrained supply supports both.
Investment metrics
- 1% rule
- 1.68% ✓
- Cap rate
- 14.73%
- Cash-on-cash
- 30.14%
- DSCR
- 2.34
- GRM
- 4.9
CMA / ARV
- ARV (on-the-fly)
- $128,304
- Comps found
- 12
Show comp detail 12 sales within ~0.75 mi
| Address | Dist | Beds/Ba | Sqft | Sold | Price | $/sf | Match |
|---|---|---|---|---|---|---|---|
| 1699 N Terry St #244 | 0.00mi | 3/2.0 | 1,352 (+4%) | 4mo | $195,000 | $144 | 89 |
| 1699 N Terry St #225 | 0.00mi | 3/2.0 | 1,376 (+6%) | 5mo | $151,500 | $110 | 86 |
| 5268 Olympic Cir | 0.25mi | 3/2.0 | 1,283 (-1%) | 3mo | $333,500 | $260 | 84 |
| 1699 N Terry St #379 | 0.00mi | 3/2.0 | 1,458 (+12%) | 2mo | $145,000 | $99 | 77 |
| 1199 N Terry St #137 | 0.46mi | 3/2.0 | 1,296 (0%) | 3mo | $133,000 | $103 | 76 |
| 1699 N Terry St #43 | 0.00mi | 3/2.0 | 1,480 (+14%) | 0mo | $125,000 | $84 | 76 |
| 5276 Olympic Cir | 0.26mi | 3/2.0 | 1,180 (-9%) | 4mo | $335,000 | $284 | 70 |
| 1400 Candlelight Dr #200 | 0.22mi | 3/2.0 | 1,152 (-11%) | 2mo | $62,500 | $54 | 70 |
| 1400 Candlelight Dr #105 | 0.22mi | 2/2.0 (-1) | 1,176 (-9%) | 0mo | $107,500 | $91 | 69 |
| 1199 N Terry St #404 | 0.46mi | 3/2.0 | 1,196 (-8%) | 3mo | $89,500 | $75 | 63 |
| 1199 N Terry St #113 | 0.46mi | 2/2.0 (-1) | 1,152 (-11%) | 3mo | $90,125 | $78 | 53 |
| 1199 N Terry St #228 | 0.46mi | 2/2.0 (-1) | 1,152 (-11%) | 6mo | $63,000 | $55 | 50 |
Match score weights: distance 35% · size 25% · config 20% · recency 20%. Top-matched comps best support the ARV.
Projected returns pro-forma
-3.0% appreciation · 1.58% rent growth · sell at horizon
- IRR
- 20.5%
- Equity multiple
- 1.82×
- Total profit
- $29,344
- Equity at exit
- $19,085
- IRR
- 27.7%
- Equity multiple
- 3.29×
- Total profit
- $81,909
- Equity at exit
- $11,067
Cash invested: $35,840 (down + closing). Projections, not guarantees.
Landlord ↔ Tenant lean methodology
- Overall (STATE)
- 28 Tenant-Leaning
- State Oregon
- 28 Tenant-Leaning · D+6
- County
- — inherits STATE
- City
- — inherits STATE
ZIP-level market 97402
- Rents YoY
- 1.6%
- Active inventory
- 297
- Price-to-rent
- 4.9×
Monthly cashflow live
- Estimated rent
- $2,155 high interval (Pro) →
- Mortgage (P&I)
- −$671
- Tax from tax record
- −$78 /mo · $935/yr
- Insurance
- −$53
- Flood insurance flood zone
- −$66 /mo · $798/yr
- HOA
- −$0
- Vacancy / Maint / Mgmt
- −$453
- Net cashflow
- $834
Break-even live
UW: 25.0% down · 7.5% · 30yr · 1.5% tax · 5.0% vac · 8.0% maint · 8.0% mgmt
Financing live
Cash to close
- Down payment
- $32,000
- Closing costs
- $3,840
- Reserves months
- —
- Total cash needed
- —
Loan-product check · same deal, 3 products live
Conventional
25% down · 7.5% · 30yr
- Down + closing
- —
- Monthly P&I
- —
- Monthly cashflow
- —
- DSCR
- —
- Eligible?
- —
Personal DTI + credit; lowest rate.
DSCR
20% down · 8.5% · 30yr
- Down + closing
- —
- Monthly P&I
- —
- Monthly cashflow
- —
- DSCR
- —
- Eligible?
- —
No personal income docs; deal must DSCR.
Hard money
10% down · 12.0% · 12mo
- Down + closing
- —
- Monthly P&I
- —
- Monthly cashflow
- —
- DSCR
- —
- Eligible?
- —
Short-term bridge; refi at stabilization.
Rent comps 13 comps
| Address | Beds | Baths | Sqft | Rent | $/sqft | DOM | Units | Dist |
|---|---|---|---|---|---|---|---|---|
| 1635 Hamlet Ln Eugene, OR | 3.0 | 2.5 | 1548 | $2,100 | $1.36 | 13d | 1 | 0.35mi |
| 1625 Hamlet Ln Eugene, OR | 3.0 | 2.5 | 1548 | $2,395 | $1.55 | 21d | 1 | 0.36mi |
| 2077 Lemuria St Eugene, OR | 4.0 | 2.0 | 1400 | $1,995 | $1.43 | 43d | 1 | 0.47mi |
| 2083 Amirante St Eugene, OR | 3.0 | 2.0 | 1250 | $2,295 | $1.84 | 21d | 1 | 0.47mi |
| 2204 Assumption St Eugene, OR | 4.0 | 2.0 | 1488 | $2,300 | $1.55 | 21d | 1 | 0.55mi |
| 2106 Golden Gardens St Eugene, OR | 3.0 | 1.0 | 1410 | $1,995 | $1.41 | 43d | 1 | 0.55mi |
| 1040 Lamplite Ln Eugene, OR | 3.0 | 1.0 | 912 | $1,895 | $2.08 | 43d | 1 | 0.64mi |
| 653 Oakwood Dr Eugene, OR | 3.0 | 2.0 | 1584 | $2,400 | $1.52 | 13d | 1 | 0.94mi |
| 4175 Quest Dr Eugene, OR | 1.0–3.0 | 1.0–2.0 | 983 | $2,095 | $2.13 | 13d | 6 | 1.05mi |
| 4057 Concord St Eugene, OR | 4.0 | 1.0 | 1800 | $2,000 | $1.11 | 43d | 1 | 1.13mi |
| 4075 Aerial Way Eugene, OR | 1.0–2.0 | 1.0–2.0 | 847 | $2,155 | $2.54 | 13d | 24 | 1.15mi |
| 4478 Fergus Ave Eugene, OR | 3.0 | 1.5 | 1120 | $1,695 | $1.51 | 43d | 1 | 1.31mi |
| 3700 Riviera Eugene, OR | 2.0 | 2.0 | 968 | $1,662 | $1.72 | 13d | 2 | 1.44mi |
Listing history 4 events
-
2026-06-14statusdays on market $128,000 Pending 3 DOM
-
2026-06-10remarks 691-char remark
-
2026-06-09remarks 653-char remark
-
2026-06-09$128,000 Active 1 DOM
ⓘ Source: listings_history table (triggers on properties + properties_extension) + one-shot
backfill from property_details.listing_events for pre-trigger history.
Tax reassessment forecast OR · Resets to sale price
- Current annual tax
- $935 · $78/mo
- Projected year-2 tax
- $1,242 · $103/mo
- Expected delta
- +$306/yr (+$26/mo · 32.8%)
ⓘ Screening estimate from a state-policy table — verify with the county assessor before closing.
Climate risk First Street
- Flood 7/10 Severe FEMA zone X (unshaded) · 99% chance over 30 yrs
- Wildfire 5/10 Major
- Heat 4/10 Moderate 7 d/yr ≥92°F today · 15 d/yr by 30 yrs out
- Wind 1/10 Low
- Air quality 10/10 Extreme 13 unhealthy d/yr today · 14 by 30 yrs out
Nearby sold comps map
Loading sold comps map…
Walkable amenities ~0.75 mi
Loading nearby amenities…
Taxation est. · year 1
- Rental income
- $25,863
- − Mortgage interest
- −$7,170
- − Property taxes
- −$935
- − Insurance
- −$1,438
- − Repairs & maintenance
- −$2,069
- − Management
- −$2,069
- − Depreciation
- −$3,724
- Taxable income
- $8,459
- Est. tax owed @ 24.0%
- −$2,030
- After-tax cash flow
- $7,974/yr
For passive investors: Depreciation is non-cash, so a rental often shows a tax loss while cash-flowing — sheltering income. Rental losses are passive: they offset passive income freely, and up to $25,000/yr can offset ordinary (W-2) income if you actively participate and your MAGI is under $100k (phasing out to $0 by $150k); unused losses carry forward. On sale, claimed depreciation is recaptured at up to 25%, and gains may owe capital-gains tax (a 1031 exchange can defer both). Figures are a year-1 estimate at your 24.0% rate — not tax advice; consult a CPA.
Schools (NCES district)
- District
- Bethel SD 52
- NCES district ID
- 4102040
- Math proficiency
- 18% ▼ -14.00%
- Reading proficiency
- 34% ▼ -14.00%
- Median HH income
- $47,860
- Composite
- 22.62/100
- National rank
- #8066
- State rank
- #52 of 58 in OR
Livability — Eugene
- Score
- 81/100
- State rank
- #52
- US rank
- #1587
Category grades
Schools grade is shown separately in the Schools card above.
Census & demographics
- Census place
- Eugene, OR
- County
- Lane County · 310,476 people
- City population
- 215,212
- Metro
- Eugene-Springfield, OR
- Population (ZIP)
- 53,823
- Household income
- $57,658
- Rent vs Own
- Severe rent burden
- 3142.0
Population outlook (Lane County) Hauer SSP2
- Today (2025)
- 391,933 people
- By 2030
- 405,860 · +3.6%
- By 2040
- 429,386 · +9.6%
- By 2050
- 452,016 · +15.3%
- By 2075
- 508,825 · +29.8%
- By 2100
- 531,208 · +35.5%
Race, ethnicity, and origin ACS 2023
- Neighborhood character
- Predominantly White (72%)
- Race & ethnicity
- White 72% Hispanic / Latino 17% Two or more races 11% Asian 2% Black 2%
- Hispanic origin (detail)
- Mexican 12%
- Common ancestry
- Italian 4% Lithuanian 3% Portuguese 3%
- Foreign-born
- 7% · Canada, China, Vietnam
- Languages at home
- 88% English-only · Spanish 9% Other Indo-European 1%
Political lean MEDSL · Lane
- 2024 margin
- Strong D (+23.1) · D 60.0% · R 36.9% · Other 3.1%
- 2008→2024 swing
- -4.3pp toward R · 2008: 27.4pp · 2024: 23.1pp
- All cycles
- 2024: D+23.1 2020: D+24.3 2016: D+18.9 2012: D+23.4 2008: D+27.4
Not yet ingested
- Civics
- —
Market trends
- HPI YoY
- ▼ -437.20%
- Current HPI
- 298.1167
- Rent YoY
- ▲ 1.58%
- Metro
- Eugene-Springfield, OR
- State GDP YoY
- ▲ 2.05%
- F500 in state
- 2
Industry mix (Fortune 500 HQ in OR)
| Industry | F500 HQs | Revenue |
|---|---|---|
| Consumer Goods | 1 | $51B |
|
||
Price history
+228.2% since first listed4 events — show timeline
- 2026-06-09 Listed $128,000 RMLS
- 2016-04-01 Sold (MLS) $34,100 RMLS
- 2016-02-24 Pending — RMLS
- 2016-01-29 Listed $39,000 RMLS
Property tax history
+1.9%/yrLatest (2025): $935 · +2.6% YoY. Source: county tax records.
Cash-flow waterfall
monthlySold comps — $/sqft
last 12 mo · ≤1 miLoading sold comps…