 20-Plex
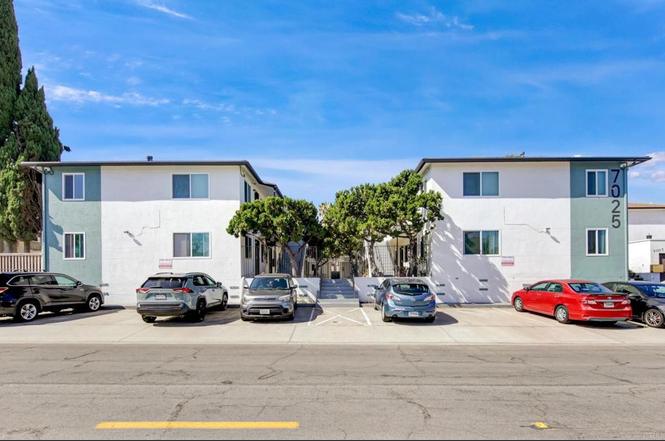
7025 Boulevard Dr · La Mesa, CA
Flood risk 6/10 · Moderate
- FEMA flood zone
- X (unshaded)
- Chance of flooding over 30 yrs
- 0.75%
- Est. flood insurance / yr
- $507 – $1,088
Fire risk 1/10 · Minimal
- Est. fire insurance / yr
- $659 – $1,223
Heat risk 4/10 · Minor
- Hot days now (above 91°F)
- 7 days/yr
- Hot days in 30 yrs
- 18 days/yr
Wind risk 1/10 · Minimal
- Chance of severe wind over 30 yrs
- —
Air-quality risk 3/10 · Minor
- Unhealthy air days now
- 4 days/yr
- Unhealthy air days in 30 yrs
- 4 days/yr
Risk factors via First Street. Map © Google.
Why this score? — see what drove the B- grade
The composite is a weighted blend of 9 inputs, each scored 0–100. Each bar is that input's sub-score; the figure is the points it added to the 100-point composite (weight × sub-score).
- Cash flow +30.0/30.0
- DSCR +10.0/10.0
- 1% rule +7.7/10.0
- ARV discount +7.5/15.0
- Livability +3.7/5.0
- Rent growth +2.7/5.0
- Condition / age +2.5/5.0
- Schools +2.2/10.0
- Appreciation +0.0/10.0
$5,450,000
🖨 Deal sheet 📄 Offer letter ✓ Due diligence
Multi-family units
County records classify this as Multi-Family (5+ Unit). Listing-text estimate: 20 units. confirmed
5+ unit building — per-unit beds/baths from public records are typically unavailable; the breakdown below (if shown) is an estimate from the listing text.
Listing remarks
7025 Boulevard Dr offers a renovated, turnkey, and desirable 20-unit garden style asset with immediate cashflow, remaining rental upside, and all major infrastructure system improvements. The property is ideally situated near major transportation corridors, steps away from the amenity and retail filled University Ave, and provides seasoned investors with the “Golden Standard” Class B location asset known to provide the strongest aggregate return and operational profile. Current ownership has completed significant capital improvements, eliminating all deferred maintenance and substantially reducing future expenses. Improvements include renovation of 18 units, major electrical sys
Key facts
- Renovated
- Dual-pane windows
- New pitched roofs
Tags
Property features AI
Finance
- Other: Building area approximately 12,356; Zoning: R3-MU; Lot density approximately 21–25 units per acre; Number of leased units: 20; Lot size source: Public records
- Financial info: Total of 20 residential units; Gross scheduled income: $463,138; Gross income: $463,138; Net operating income: $282,881; Operating expenses: $167,413; Expenses include taxes ($70,242), insurance ($14,008), water & sewer ($12,871), electric ($9,070), and trash ($5,763); Rent control applies
Exterior
- Parking: 20 uncovered parking spaces (total 20 parking spaces)
- Utilities: Public sewer; One separate water meter; One separate gas meter; 21 separate electric meters
- Home design: Attached property; Two-story buildings; Multiple buildings on site (2)
- Exterior features: No pool; Community features include curbs, hiking and a lake
Interior
- Bedrooms: Units include 1- and 2-bedroom layouts
- Bathrooms: Units include 1- and 4-bath configurations
- Interior features: Street-level entry; Entry located on street
- Laundry & utility: On-site laundry area
Neighborhood map
What this means for you Summary
Snapshot
- This is a 20 × 24-bed/32.0-bath units multifamily listed at $5.45M.
Deal economics
- At list price, monthly cash flow is $23k ($270k/yr) — positive. Per door: $1k/mo.
- The deal already cash-flows at list — no discount required.
- Meets the 1% rule at list price ($69k rent vs $5.45M).
- Cap rate 11.3% vs local median 2.0% in La Mesa — top-decile yield for the area; either an underpriced asset or a hidden risk that comps aren't pricing in. Stress-test before assuming the spread holds.
Location & tenants
- Location reads 74/100 on livability (#137 in CA, #4,758 nationally) — a middle-class / working-renter tenant base. Strengths: amenities A+, commute A+, employment B+; Watch: crime C-, health & safety C-, cost of living F.
- Lemon Grove (suburban): math 25% / reading 25% proficiency, ranked #389 of 517 in CA (top 75%) — low school quality limits family demand, transient renter base, plan for 1-2y turnover; 65% free/reduced lunch — lower-income household profile, screen leases tightly.
- Market conditions: Rents flat; 118 active listings in the ZIP; high-income renter base; 11,759 units permitted in San Diego County in 2024 (7,244 in 5+ unit buildings).
- At $69,277/mo this rent would consume 721% of the median local household income ($115k/yr) (locally 1065% of renters already pay >50% of income on rent) — very limited rent-growth headroom before tenants either downsize or default.
Forward outlook
- Local home prices are declining (-3.0%/yr); year-one equity from $38k of loan paydown is wiped out by about $164k of value loss. Plan a longer hold.
- San Diego County population projected at +20% by 2050 — long-run rental-demand tailwind backs the buy-and-hold thesis.
- At projected returns (-3.0% appreciation + 0.8% rent growth), your $1.53M cash investment doubles in ~9 years — after that, you're playing with house money.
Negotiation context
- Only 7 days on market — expect competitive offers; lowballing is unlikely to land.
- 5 sale attempts since 2y ago with the ask held roughly flat each time — persistent listings suggest the price (not the market) is what's stuck; bring a comps-based counter.
- Current owner paid $4.10M; 33% above their basis — modest negotiation headroom, anchor on the comps not their cost.
Risks & watch-outs
- Watch-outs: built in 1956 — expect roof / HVAC / electrical / plumbing capex.
- Climate carrying-cost: major flood risk — expect insurance premiums to compound above CPI over the hold.
Questions for the listing agent
- Can we see the unit-by-unit rent roll, current vacancy, and any below-market leases? What's the average tenancy length?
- What capital expenditures (roof, boiler, parking lot, exteriors) have been made in the last 5 years, and what's planned in the next 2?
- Built in 1956 — when were the roof, HVAC, electrical panel, plumbing, and water heater last replaced?
- Is there a deadline driving the sale (1031 exchange, divorce, estate, relocation)? That informs how much negotiation room exists.
- Schools are B-rated — typically a magnet for longer-tenancy family renters. What's the average tenant stay here, and is there a school-zone premium baked into asking?
- What's the average days-on-market for RENTAL listings here right now (not sales)? A rising rental-DOM trend means longer vacancies and softer asking-rent achievability than the comps imply.
- What's the recent tenant-quality profile in this submarket — average credit score on applications, eviction rate, late-payment / NSF rate, and stable-employment percentage? A property-management company in the area should have these aggregated.
- How much new apartment / multifamily construction is in the pipeline within 1–3 miles? Heavy new supply (>2% of stock underway) typically softens rents 12–24 months out; light construction supports rent growth.
Investment metrics
- 1% rule
- 1.27% ✓
- Cap rate
- 11.26%
- Cash-on-cash
- 17.73%
- DSCR
- 1.79
- GRM
- 6.6
CMA / ARV
No comps found within radius.
Projected returns pro-forma
-3.0% appreciation · 0.8% rent growth · sell at horizon
- IRR
- 6.9%
- Equity multiple
- 1.26×
- Total profit
- $400,171
- Equity at exit
- $812,613
- IRR
- 14.4%
- Equity multiple
- 2.05×
- Total profit
- $1,598,531
- Equity at exit
- $471,216
Cash invested: $1,526,000 (down + closing). Projections, not guarantees.
Landlord ↔ Tenant lean methodology
- Overall (STATE)
- 18 Strongly Tenant-Friendly
- State California
- 18 Strongly Tenant-Friendly · D+13
- County
- — inherits STATE
- City
- — inherits STATE
ZIP-level market 91941
- Rents YoY
- 0.8%
- Active inventory
- 118
- Price-to-rent
- 131.1×
Monthly cashflow live
- Estimated rent
- $69,277 medium interval (Pro) →
- Mortgage (P&I)
- −$28,580
- Tax from tax record
- −$1,336 /mo · $16,032/yr
- Insurance
- −$2,271
- HOA
- −$0
- Vacancy / Maint / Mgmt
- −$14,548
- Net cashflow
- $22,542
Break-even live
20-unit breakdown (identical units grouped — click to expand)
| Units | Beds | Baths | Est. rent |
|---|---|---|---|
| 20× units | 24 | 32 | $69,280 |
| #1 | 24 | 32 | $3,464 |
| #2 | 24 | 32 | $3,464 |
| #3 | 24 | 32 | $3,464 |
| #4 | 24 | 32 | $3,464 |
| #5 | 24 | 32 | $3,464 |
| #6 | 24 | 32 | $3,464 |
| #7 | 24 | 32 | $3,464 |
| #8 | 24 | 32 | $3,464 |
| #9 | 24 | 32 | $3,464 |
| #10 | 24 | 32 | $3,464 |
| #11 | 24 | 32 | $3,464 |
| #12 | 24 | 32 | $3,464 |
| #13 | 24 | 32 | $3,464 |
| #14 | 24 | 32 | $3,464 |
| #15 | 24 | 32 | $3,464 |
| #16 | 24 | 32 | $3,464 |
| #17 | 24 | 32 | $3,464 |
| #18 | 24 | 32 | $3,464 |
| #19 | 24 | 32 | $3,464 |
| #20 | 24 | 32 | $3,464 |
| Total (20 units) | $69,277 | ||
UW: 25.0% down · 7.5% · 30yr · 1.5% tax · 5.0% vac · 8.0% maint · 8.0% mgmt
Financing live
Cash to close
- Down payment
- $1,362,500
- Closing costs
- $163,500
- Reserves months
- —
- Total cash needed
- —
Loan-product check · same deal, 3 products live
Conventional
25% down · 7.5% · 30yr
- Down + closing
- —
- Monthly P&I
- —
- Monthly cashflow
- —
- DSCR
- —
- Eligible?
- —
Personal DTI + credit; lowest rate.
DSCR
20% down · 8.5% · 30yr
- Down + closing
- —
- Monthly P&I
- —
- Monthly cashflow
- —
- DSCR
- —
- Eligible?
- —
No personal income docs; deal must DSCR.
Hard money
10% down · 12.0% · 12mo
- Down + closing
- —
- Monthly P&I
- —
- Monthly cashflow
- —
- DSCR
- —
- Eligible?
- —
Short-term bridge; refi at stabilization.
Listing history 6 events
-
2026-06-18days on market $5,450,000 Active 7 DOM
-
2026-06-17days on market $5,450,000 Active 6 DOM
-
2026-06-16days on market $5,450,000 Active 5 DOM
-
2026-06-15days on market $5,450,000 Active 4 DOM
-
2026-06-13remarks 687-char remark
-
2026-06-13$5,450,000 Active 2 DOM
ⓘ Source: listings_history table (triggers on properties + properties_extension) + one-shot
backfill from property_details.listing_events for pre-trigger history.
Tax reassessment forecast CA · Resets to sale price
- Current annual tax
- $16,032 · $1,336/mo
- Projected year-2 tax
- $41,420 · $3,452/mo
- Expected delta
- +$25,388/yr (+$2,116/mo · 158.4%)
ⓘ Screening estimate from a state-policy table — verify with the county assessor before closing.
Climate risk First Street
- Flood 6/10 Major FEMA zone X (unshaded) · 75% chance over 30 yrs
- Wildfire 1/10 Low
- Heat 4/10 Moderate 7 d/yr ≥91°F today · 18 d/yr by 30 yrs out
- Wind 1/10 Low
- Air quality 3/10 Moderate 4 unhealthy d/yr today · 4 by 30 yrs out
Nearby sold comps map
Loading sold comps map…
Walkable amenities ~0.75 mi
Loading nearby amenities…
Taxation est. · year 1
- Rental income
- $831,324
- − Mortgage interest
- −$305,285
- − Property taxes
- −$16,032
- − Insurance
- −$27,250
- − Repairs & maintenance
- −$66,506
- − Management
- −$66,506
- − Depreciation
- −$158,545
- Taxable income
- $191,200
- Est. tax owed @ 24.0%
- −$45,888
- After-tax cash flow
- $224,611/yr
For passive investors: Depreciation is non-cash, so a rental often shows a tax loss while cash-flowing — sheltering income. Rental losses are passive: they offset passive income freely, and up to $25,000/yr can offset ordinary (W-2) income if you actively participate and your MAGI is under $100k (phasing out to $0 by $150k); unused losses carry forward. On sale, claimed depreciation is recaptured at up to 25%, and gains may owe capital-gains tax (a 1031 exchange can defer both). Figures are a year-1 estimate at your 24.0% rate — not tax advice; consult a CPA.
Schools (NCES district)
- District
- Lemon Grove
- NCES district ID
- 0621330
- Math proficiency
- 25% ▼ -9.00%
- Reading proficiency
- 25% ▼ -21.00%
- Median HH income
- $54,160
- Composite
- 22.46/100
- National rank
- #8104
- State rank
- #389 of 517 in CA
Livability — La Mesa
- Score
- 74/100
- State rank
- #137
- US rank
- #4758
Category grades
Schools grade is shown separately in the Schools card above.
Census & demographics
- Census place
- La Mesa, CA
- County
- San Diego County · 3,178,799 people
- City population
- 74,642
- Metro
- San Diego-Chula Vista-Carlsbad, CA
- Population (ZIP)
- 33,218
- Household income
- $115,381
- Rent vs Own
- Severe rent burden
- 1065.0
Population outlook (San Diego County) Hauer SSP2
- Today (2025)
- 3,678,185 people
- By 2030
- 3,856,546 · +4.8%
- By 2040
- 4,171,407 · +13.4%
- By 2050
- 4,421,607 · +20.2%
- By 2075
- 4,831,599 · +31.4%
- By 2100
- 4,832,502 · +31.4%
Race, ethnicity, and origin ACS 2023
- Neighborhood character
- Diverse neighborhood (Simpson 0.62)
- Race & ethnicity
- White 56% Hispanic / Latino 26% Two or more races 15% Black 7% Asian 5%
- Hispanic origin (detail)
- Mexican 20% Puerto Rican 2%
- Common ancestry
- Lithuanian 3% Slovak 2% Italian 2%
- Foreign-born
- 11% · Canada, Vietnam, China
- Languages at home
- 80% English-only · Spanish 13% Other Indo-European 1% Tagalog/Filipino 1%
Political lean MEDSL · San Diego
- 2024 margin
- D (+16.8) · D 56.9% · R 40.1% · Other 2.9%
- 2008→2024 swing
- +6.6pp toward D · 2008: 10.2pp · 2024: 16.8pp
- All cycles
- 2024: D+16.8 2020: D+22.8 2016: D+17.8 2012: D+5.1 2008: D+10.2
Not yet ingested
- Civics
- —
Market trends
- HPI YoY
- ▼ -765.56%
- Current HPI
- 367.2935
- Rent YoY
- ▲ 0.80%
- Metro
- San Diego-Chula Vista-Carlsbad, CA
- State GDP YoY
- ▲ 3.21%
- F500 in state
- 116
Industry mix (Fortune 500 HQ in CA)
| Industry | F500 HQs | Revenue |
|---|---|---|
| Technology | 27 | $1,492B |
|
||
| Financial Services | 3 | $174B |
|
||
| Retail | 3 | $44B |
|
||
| Insurance | 3 | $26B |
|
||
| Media / Entertainment | 2 | $115B |
|
||
| Pharmaceuticals / Biotech | 2 | $62B |
|
||
Price history
+311328.6% since first listed10 events — show timeline
- 2026-06-11 Listed $5,450,000 CRMLS
- 2025-04-10 Sold (Public Records) $4,100,000 Public Records
- 2025-03-07 Rental Removed $2,300 LEASESTAR
- 2025-03-07 Listed for Rent $2,300 LEASESTAR
- 2024-12-16 Rental Removed $1,450 LEASESTAR
- 2024-12-08 Rental Removed $1,450 RENTALBEAST
- 2024-12-08 Listed for Rent $1,450 RENTALBEAST
- 2024-11-19 Listed for Rent $1,450 LEASESTAR
- 2024-04-08 Rental Removed $1,750 APPFOLIO
- 2024-03-13 Listed for Rent $1,750 APPFOLIO
Property tax history
+4.8%/yrLatest (2025): $16,032 · +10.3% YoY. Source: county tax records.
Cash-flow waterfall
monthlySold comps — $/sqft
last 12 mo · ≤1 miLoading sold comps…