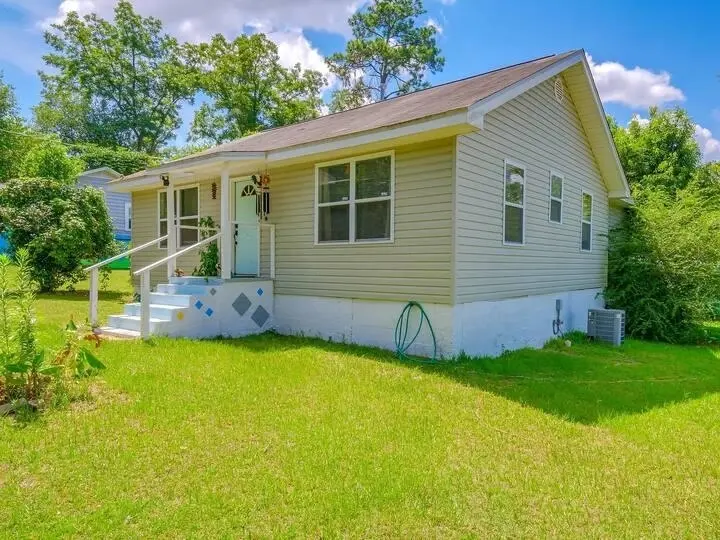
447 W 6th Ave · Tallahassee, FL
Flood risk 1/10 · Minimal
- FEMA flood zone
- X (unshaded)
- Chance of flooding over 30 yrs
- 0.0%
- Est. flood insurance / yr
- $507 – $1,088
Fire risk 1/10 · Minimal
- Est. fire insurance / yr
- $947 – $1,759
Heat risk 8/10 · Major
- Hot days now (above 108°F)
- 7 days/yr
- Hot days in 30 yrs
- 19 days/yr
Wind risk 9/10 · Severe
- Chance of severe wind over 30 yrs
- 99.0%
Air-quality risk 5/10 · Moderate
- Unhealthy air days now
- 7 days/yr
- Unhealthy air days in 30 yrs
- 7 days/yr
Risk factors via First Street. Map © Google.
Why this score? — see what drove the D+ grade
The composite is a weighted blend of 9 inputs, each scored 0–100. Each bar is that input's sub-score; the figure is the points it added to the 100-point composite (weight × sub-score).
- Cash flow +14.1/30.0
- ARV discount +11.9/15.0
- DSCR +4.3/10.0
- Schools +4.3/10.0
- Livability +4.3/5.0
- 1% rule +3.6/10.0
- Rent growth +3.3/5.0
- Condition / age +2.5/5.0
- Appreciation +0.0/10.0
$242,900
🖨 Deal sheet (PDF) 📄 Offer letter ✓ Due diligence
Listing remarks MLS
Charming Midtown home located in the desirable Levy Park area of Tallahassee. Great opportunity for an owner occupant or investor. Situated on a large corner lot, comprised of two platted lots (Lots 1 & 2). The property offers great yard space for outdoor activities and entertaining. Hardwood flooring and natural lighting throughout. Large primary bedroom is currently being used as an art studio. Local shops, restaurants and bars within walking distance, and close to downtown amenities.
Key facts
- Kitchen remodeled
- New water heater
- Level corner lot
Tags
Property features AI
Exterior
- Parking: On-street parking
- Utilities: Public sewer; Electric service
- Home design: Single-story; Vinyl siding
- Construction: Vinyl siding construction
- Exterior features: Fully fenced yard; Paved road access
Interior
- Kitchen: Oven; Range; Dishwasher; Refrigerator
- Bedrooms: Bedroom 2 (13x10); Bedroom 3 (13x8)
- Flooring: Hardwood; Tile
- Bathrooms: 1 full bathroom
- Heating & cooling: Electric heating; Central air conditioning; Ceiling fan(s)
- Interior features: Hardwood and tile flooring; Ceiling fan(s)
- Laundry & utility: Washer; Dryer
Neighborhood map
What this means for you Summary
Snapshot
- This is a 3-bed/1.0-bath single-family listed at $243k.
Deal economics
- At list price, monthly cash flow is $35 ($420/yr) — positive.
- The deal already cash-flows at list — no discount required.
- To meet the 1% rule (rent ≥ 1% of price), the offer needs to be $210k (13.5% below list).
- Recommended offer: $210k (13.5% below list) — sets the bar for 1% rule.
- Cap rate 6.5% vs local median 4.2% in Tallahassee — top-decile yield for the area; either an underpriced asset or a hidden risk that comps aren't pricing in. Stress-test before assuming the spread holds.
Location & tenants
- Location reads 86/100 on livability (#19 in FL, #429 nationally) — a professional / high-income tenant draw. Strengths: amenities A+, commute A+, health & safety A+; Watch: employment D.
- Leon (urban): math 48% / reading 53% proficiency, ranked #33 of 73 in FL (top 45%) — acceptable for families but not a draw, mixed tenant base, ~2y average lease.
- Zoned schools: Ruediger Elementary School (math 30% / reading 30%, grade F, #1,882 of 2,144 statewide, top 88%, 484 students, 72% FRL); Raa Middle School (math 42% / reading 51%, grade D+, #297 of 571 statewide, top 52%, 855 students, 49% FRL); Leon High School (math 52% / reading 60%, grade C, #131 of 667 statewide, top 20%, 1,935 students, 37% FRL).
- Market conditions: Rents rising (+3.1%/yr); 238 active listings in the ZIP; 40 comparable units currently listed for rent nearby; rentals at typical pace (median 23d on market — plan ~3-4 weeks tenant-placement turnaround); 1,765 units permitted in Leon County in 2024 (975 in 5+ unit buildings).
- This rent runs 40% of the median local income ($62k/yr) — at the standard rent-burdened threshold; future hikes will face affordability resistance.
Forward outlook
- Local home prices are declining (-3.0%/yr); year-one equity from $2k of loan paydown is wiped out by about $7k of value loss. Plan a longer hold.
- Leon County population projected at +23% by 2050 — long-run rental-demand tailwind backs the buy-and-hold thesis.
Negotiation context
- It's been on market 85 days — a 6% lower offer ($228k) is reasonable based on typical stale-listing flexibility.
- 4 sale attempts since 13y ago with the ask held roughly flat each time — persistent listings suggest the price (not the market) is what's stuck; bring a comps-based counter.
Risks & watch-outs
- Watch-outs: built in 1949 — expect roof / HVAC / electrical / plumbing capex.
- Climate carrying-cost: severe wind risk, 99% chance of damaging wind over 30y; extreme-heat days projected 7→19/yr by 2055 (HVAC capex compounding) — expect insurance premiums to compound above CPI over the hold.
Questions for the listing agent
- It's been on market 85 days. Have you received any prior offers? Is the seller open to a 14% concession, seller financing, or rate buy-down credit?
- Built in 1949 — when were the roof, HVAC, electrical panel, plumbing, and water heater last replaced?
- Why hasn't it sold? Are there any deal-killer items the seller is aware of (foundation, flood, title, zoning, code violations)?
- Is there a deadline driving the sale (1031 exchange, divorce, estate, relocation)? That informs how much negotiation room exists.
- Schools are B-rated — typically a magnet for longer-tenancy family renters. What's the average tenant stay here, and is there a school-zone premium baked into asking?
- The area grade is low — what's the realistic commute time and amenity access for the typical tenant pool here? Any planned neighborhood developments (good or bad) we should know about?
- What's the average days-on-market for RENTAL listings here right now (not sales)? A rising rental-DOM trend means longer vacancies and softer asking-rent achievability than the comps imply.
- What's the recent tenant-quality profile in this submarket — average credit score on applications, eviction rate, late-payment / NSF rate, and stable-employment percentage? A property-management company in the area should have these aggregated.
- How much new for-sale + rental construction is in the pipeline within 1–3 miles? Heavy new supply typically softens prices + rents 12–24 months out; constrained supply supports both.
Investment metrics
- 1% rule
- 0.86% ✗
- Cap rate
- 6.47%
- Cash-on-cash
- 0.62%
- DSCR
- 1.03
- GRM
- 9.6
CMA / ARV
- ARV (on-the-fly)
- $268,960
- Comps found
- 12
Show comp detail 12 sales within ~0.75 mi
| Address | Dist | Beds/Ba | Sqft | Sold | Price | $/sf | Match |
|---|---|---|---|---|---|---|---|
| 1304 Gibbs Dr | 0.27mi | 3/2.0 | 1,277 (-3%) | 5mo | $272,000 | $213 | 75 |
| 1415 Jackson St | 0.18mi | 3/2.0 | 1,248 (-5%) | 8mo | $305,000 | $244 | 73 |
| 439 Shephard St | 0.04mi | 3/1.0 | 1,116 (-15%) | 3mo | $225,000 | $202 | 71 |
| 730 W 7th Ave | 0.35mi | 3/2.0 | 1,268 (-3%) | 10mo | $260,000 | $205 | 66 |
| 1423 N Duval St | 0.34mi | 2/1.0 (-1) | 1,240 (-6%) | 6mo | $232,500 | $188 | 65 |
| 735 Westcott St | 0.36mi | 3/2.0 | 1,399 (+7%) | 7mo | $285,500 | $204 | 63 |
| 416 Beard St | 0.71mi | 3/2.0 | 1,307 (-0%) | 2mo | $335,000 | $256 | 60 |
| 1218 N Duval St | 0.25mi | 3/2.0 | 1,180 (-10%) | 9mo | $400,000 | $339 | 60 |
| 509 N Copeland St | 0.63mi | 3/3.0 | 1,271 (-3%) | 1mo | $272,500 | $214 | 56 |
| 1714 Monticello Dr | 0.60mi | 3/2.0 | 1,376 (+5%) | 5mo | $190,000 | $138 | 56 |
| 807 Goodbread Ln | 0.35mi | 2/1.0 (-1) | 1,119 (-15%) | 6mo | $68,000 | $61 | 49 |
| 1115 N Woodward Ave | 0.63mi | 3/2.0 | 1,496 (+14%) | 8mo | $235,000 | $157 | 37 |
Match score weights: distance 35% · size 25% · config 20% · recency 20%. Top-matched comps best support the ARV.
Projected returns pro-forma
-3.0% appreciation · 3.12% rent growth · sell at horizon
- IRR
- -15.2%
- Equity multiple
- 0.46×
- Total profit
- $-36,879
- Equity at exit
- $36,217
- IRR
- -6.4%
- Equity multiple
- 0.59×
- Total profit
- $-28,205
- Equity at exit
- $21,002
Cash invested: $68,012 (down + closing). Projections, not guarantees.
Landlord ↔ Tenant lean methodology
- Overall (STATE)
- 87 Strongly Landlord-Friendly
- State Florida
- 87 Strongly Landlord-Friendly · R+3
- County
- — inherits STATE
- City
- — inherits STATE
ZIP-level market 32303
- Rents YoY
- 3.1%
- Active inventory
- 238
- Price-to-rent
- 9.6×
Monthly cashflow live
- Estimated rent
- $2,101 high interval (Pro) →
- Mortgage (P&I)
- −$1,274
- Tax from tax record
- −$250 /mo · $2,996/yr
- Insurance
- −$101
- HOA
- −$0
- Vacancy / Maint / Mgmt
- −$441
- Net cashflow
- $35
Break-even live
Sensitivity live
| Price | -10% $172 | -5% $104 | +0% $35 | +5% $-34 | +10% $-103 |
|---|---|---|---|---|---|
| Rent | -10% $-131 | -5% $-48 | +0% $35 | +5% $118 | +10% $201 |
| Rate | -1.0pp $157 | -0.5pp $97 | base $35 | +0.5pp $-28 | +1.0pp $-92 |
UW: 25.0% down · 7.5% · 30yr · 1.5% tax · 5.0% vac · 8.0% maint · 8.0% mgmt
Financing live
Cash to close
- Down payment
- $60,725
- Closing costs
- $7,287
- Reserves months
- —
- Total cash needed
- —
Loan-product check · same deal, 3 products live
Conventional
25% down · 7.5% · 30yr
- Down + closing
- —
- Monthly P&I
- —
- Monthly cashflow
- —
- DSCR
- —
- Eligible?
- —
Personal DTI + credit; lowest rate.
DSCR
20% down · 8.5% · 30yr
- Down + closing
- —
- Monthly P&I
- —
- Monthly cashflow
- —
- DSCR
- —
- Eligible?
- —
No personal income docs; deal must DSCR.
Hard money
10% down · 12.0% · 12mo
- Down + closing
- —
- Monthly P&I
- —
- Monthly cashflow
- —
- DSCR
- —
- Eligible?
- —
Short-term bridge; refi at stabilization.
Rent comps 40 comps
| Address | Beds | Baths | Sqft | Rent | $/sqft | DOM | Units | Dist |
|---|---|---|---|---|---|---|---|---|
| 828 N Duval St Tallahassee, FL | 3.0 | 2.5 | 1498 | $2,600 | $1.74 | 23d | 1 | 0.43mi |
| 412 W Brevard St Unit 412 Tallahassee, FL | 3.0 | 2.0 | 900 | $800 | $0.89 | 23d | 1 | 0.49mi |
| 1935 Dawsey St Unit 1935-2 Tallahassee, FL | 2.0 | 1.0 | 875 | $975 | $1.11 | 15d | 1 | 0.68mi |
| 1916 Nannette Dr Unit 1916 Tallahassee, FL | 2.0 | 1.0 | 1000 | $1,100 | $1.10 | 15d | 1 | 0.69mi |
| 1313 N Gadsden St Unit 2 Tallahassee, FL | 3.0 | 1.0 | 1678 | $3,500 | $2.09 | 23d | 1 | 0.70mi |
| 1004 Volusia St Tallahassee, FL | 4.0 | 2.0 | 1360 | $1,800 | $1.32 | 15d | 1 | 0.70mi |
| 440 N Monroe St Tallahassee, FL | 3.0 | 1.0–3.0 | 1311 | $3,850 | $2.94 | 15d | 15 | 0.76mi |
| 859 W Brevard St Tallahassee, FL | 4.0 | 4.0 | 1500 | $1,900 | $1.27 | 15d | 1 | 0.77mi |
| 847 W Georgia St Tallahassee, FL | 4.0 | 4.0 | 1500 | $1,900 | $1.27 | 15d | 1 | 0.82mi |
| 415 N Gadsden St Tallahassee, FL | 1.0–2.0 | 1.0–1.5 | 990 | $1,575 | $1.59 | 23d | 6 | 0.89mi |
| 406 Glenview Dr Unit 11 Tallahassee, FL | 2.0 | 1.0 | 896 | $1,100 | $1.23 | 15d | 1 | 0.95mi |
| 1101 Washington Ct #1 Tallahassee, FL | 2.0 | 1.0 | 950 | $1,050 | $1.11 | 15d | 1 | 0.97mi |
| 1643 Fernando Dr #2 Tallahassee, FL | 2.0 | 2.0 | 1000 | $1,650 | $1.65 | 23d | 1 | 0.98mi |
| 1329 Nylic St #1 Tallahassee, FL | 3.0 | 3.0 | 1275 | $1,800 | $1.41 | 23d | 1 | 1.01mi |
| 712 Shell St Tallahassee, FL | 3.0 | 2.0 | 1601 | $2,400 | $1.50 | 23d | 1 | 1.03mi |
| 382 E Bradford Rd Tallahassee, FL | 3.0 | 3.0 | 1302 | $2,200 | $1.69 | 23d | 1 | 1.07mi |
| 1107 Basin St Unit A Tallahassee, FL | 3.0 | 2.0 | 1215 | $2,400 | $1.98 | 23d | 1 | 1.09mi |
| 2000 N Meridian Rd Tallahassee, FL | 1.0–3.0 | 1.0–2.0 | 1174 | $1,395 | $1.19 | 15d | 22 | 1.10mi |
| 503 E Call St Tallahassee, FL | 4.0 | 2.0 | 1875 | $3,850 | $2.05 | 23d | 1 | 1.10mi |
| 743 E 9th Ave Tallahassee, FL | 2.0 | 1.0 | 900 | $1,500 | $1.67 | 15d | 1 | 1.11mi |
| 608 Talaflo St Tallahassee, FL | 4.0 | 2.0 | 1830 | $2,200 | $1.20 | 15d | 1 | 1.14mi |
| 1325 W Tharpe St Tallahassee, FL | 1.0–3.0 | 1.0–4.0 | 937 | $1,676 | $1.79 | 15d | 21 | 1.16mi |
| 1537 Payne St Unit 1 Tallahassee, FL | 2.0 | 2.0 | 900 | $1,990 | $2.21 | 23d | 1 | 1.17mi |
| 1537 Payne St Tallahassee, FL | 3.0 | 2.5 | 1850 | $2,890 | $1.56 | 23d | 1 | 1.18mi |
| 1531 Payne St #1 Tallahassee, FL | 2.0 | 2.0 | 900 | $2,049 | $2.28 | 23d | 1 | 1.20mi |
| 1531 Payne St Tallahassee, FL | 3.0 | 2.5 | 1850 | $2,949 | $1.59 | 23d | 1 | 1.20mi |
| 1531 Payne St #1 Tallahassee, FL | 2.0 | 2.0 | 900 | $1,990 | $2.21 | 15d | 1 | 1.20mi |
| 1533 Payne St Unit 1 Tallahassee, FL | 2.0 | 2.0 | 900 | $1,990 | $2.21 | 23d | 1 | 1.21mi |
| 1533 Payne St Unit 1 Tallahassee, FL | 2.0 | 2.0 | 900 | $1,990 | $2.21 | 15d | 1 | 1.21mi |
| 1533 Payne St Tallahassee, FL | 3.0 | 2.5 | 1850 | $2,890 | $1.56 | 23d | 1 | 1.21mi |
| 1533 Payne St Tallahassee, FL | 3.0 | 2.5 | 1850 | $2,890 | $1.56 | 15d | 1 | 1.21mi |
| 1535 Payne St Unit 1 Tallahassee, FL | 2.0 | 2.0 | 900 | $1,990 | $2.21 | 23d | 1 | 1.21mi |
| 1535 Payne St Tallahassee, FL | 3.0 | 2.5 | 1850 | $2,890 | $1.56 | 23d | 1 | 1.21mi |
| 1545 Payne St Unit 4 Tallahassee, FL | 2.0 | 2.0 | 900 | $1,990 | $2.21 | 23d | 1 | 1.22mi |
| 1545 Payne St Unit 2 Tallahassee, FL | 3.0 | 2.5 | 1850 | $2,890 | $1.56 | 23d | 1 | 1.22mi |
| 1541 Payne St Unit 3 Tallahassee, FL | 2.0 | 2.0 | 900 | $1,990 | $2.21 | 23d | 1 | 1.22mi |
| 1541 Payne St Unit 2 Tallahassee, FL | 3.0 | 2.5 | 1850 | $2,890 | $1.56 | 23d | 1 | 1.22mi |
| 1549 Payne St Unit 2 Tallahassee, FL | 3.0 | 2.5 | 1850 | $2,890 | $1.56 | 23d | 1 | 1.22mi |
| 1549 Payne St Unit 4 Tallahassee, FL | 2.0 | 2.0 | 900 | $1,990 | $2.21 | 23d | 1 | 1.22mi |
| 1553 Payne St Unit 1 Tallahassee, FL | 3.0 | 2.5 | 1850 | $2,949 | $1.59 | 23d | 1 | 1.22mi |
Listing history 27 events
-
2026-06-22days on market $242,900 Active 85 DOM
-
2026-06-18days on market $242,900 Active 82 DOM
-
2026-06-17days on market $242,900 Active 81 DOM
-
2026-06-16days on market $242,900 Active 80 DOM
-
2026-06-15days on market $242,900 Active 79 DOM
-
2026-06-14days on market $242,900 Active 77 DOM
-
2026-06-10days on market $242,900 Active 74 DOM
-
2026-06-09days on market $242,900 Active 73 DOM
-
2026-06-08days on market $242,900 Active 72 DOM
-
2026-06-07pricedays on market $242,900 Active 71 DOM
-
2026-06-05days on market $244,900 Active 68 DOM
-
2026-06-03days on market $244,900 Active 67 DOM
-
2026-06-02days on market $244,900 Active 66 DOM
-
2026-06-01days on market $244,900 Active 65 DOM
-
2026-05-31days on market $244,900 Active 64 DOM
-
2026-05-30days on market $244,900 Active 63 DOM
-
2026-04-20price $244,900
-
2026-03-28$255,000 Active
-
2023-08-10soldstatus $228,000 Closed 497-char remark
Show marketing remark (497 chars)
Charming Midtown home located in the desirable Levy Park area of Tallahassee. Great opportunity for an owner occupant or investor. Situated on a large corner lot, comprised of two platted lots (Lots 1 & 2). The property offers great yard space for outdoor activities and entertaining. Hardwood flooring and natural lighting throughout. Large primary bedroom is currently being used as an art studio. Local shops, restaurants and bars within walking distance, and close to downtown amenities.
-
2023-07-10historical Active Under Contract 497-char remark
Show marketing remark (497 chars)
Charming Midtown home located in the desirable Levy Park area of Tallahassee. Great opportunity for an owner occupant or investor. Situated on a large corner lot, comprised of two platted lots (Lots 1 & 2). The property offers great yard space for outdoor activities and entertaining. Hardwood flooring and natural lighting throughout. Large primary bedroom is currently being used as an art studio. Local shops, restaurants and bars within walking distance, and close to downtown amenities.
-
2023-07-01$230,000 Active 497-char remark
Show marketing remark (497 chars)
Charming Midtown home located in the desirable Levy Park area of Tallahassee. Great opportunity for an owner occupant or investor. Situated on a large corner lot, comprised of two platted lots (Lots 1 & 2). The property offers great yard space for outdoor activities and entertaining. Hardwood flooring and natural lighting throughout. Large primary bedroom is currently being used as an art studio. Local shops, restaurants and bars within walking distance, and close to downtown amenities.
-
2017-01-03soldstatus $135,000
-
2016-12-29soldstatus $135,000 498-char remark
Show marketing remark (498 chars)
Adorable 1949 cottage in popular in-town neighborhood. Newly refinished distressed antique heart pine floors create giving this precious home so much charm! Welcoming front porch, lovely exterior pallet with vintage touches add to the great curb appeal! Roof has been replaced recently as well as thermopane windows through out. This home sits on a DOUBLE lot- great for children, pets gardening and more! Property is completely fenced and waiting for a new family today! More picture coming soon!
-
2016-11-14$145,000 498-char remark
Show marketing remark (498 chars)
Adorable 1949 cottage in popular in-town neighborhood. Newly refinished distressed antique heart pine floors create giving this precious home so much charm! Welcoming front porch, lovely exterior pallet with vintage touches add to the great curb appeal! Roof has been replaced recently as well as thermopane windows through out. This home sits on a DOUBLE lot- great for children, pets gardening and more! Property is completely fenced and waiting for a new family today! More picture coming soon!
-
2015-03-04soldstatus $90,000
-
2015-03-02soldstatus $90,000
-
2013-10-01$90,000
ⓘ Source: listings_history table (triggers on properties + properties_extension) + one-shot
backfill from property_details.listing_events for pre-trigger history.
Tax reassessment forecast FL · Resets to sale price
- Current annual tax
- $2,996 · $250/mo
- Projected year-2 tax
- $2,996 · $250/mo
- Expected delta
- $0/yr ($0/mo · 0.0%)
ⓘ Screening estimate from a state-policy table — verify with the county assessor before closing.
Climate risk First Street
- Flood 1/10 Low FEMA zone X (unshaded) · 0% chance over 30 yrs
- Wildfire 1/10 Low
- Heat 8/10 Severe 7 d/yr ≥108°F today · 19 d/yr by 30 yrs out
- Wind 9/10 Extreme 99% chance of damaging wind over 30 yrs
- Air quality 5/10 Major 7 unhealthy d/yr today · 7 by 30 yrs out
Nearby sold comps map
Loading sold comps map…
Walkable amenities ~0.75 mi
Loading nearby amenities…
Taxation est. · year 1
- Rental income
- $25,211
- − Mortgage interest
- −$13,606
- − Property taxes
- −$2,996
- − Insurance
- −$1,214
- − Repairs & maintenance
- −$2,017
- − Management
- −$2,017
- − Depreciation
- −$7,066
- Taxable loss
- −$3,706
- Est. tax savings @ 24.0%
- +$890
- After-tax cash flow
- $1,309/yr
For passive investors: Depreciation is non-cash, so a rental often shows a tax loss while cash-flowing — sheltering income. Rental losses are passive: they offset passive income freely, and up to $25,000/yr can offset ordinary (W-2) income if you actively participate and your MAGI is under $100k (phasing out to $0 by $150k); unused losses carry forward. On sale, claimed depreciation is recaptured at up to 25%, and gains may owe capital-gains tax (a 1031 exchange can defer both). Figures are a year-1 estimate at your 24.0% rate — not tax advice; consult a CPA.
Schools (NCES district)
- District
- Leon
- NCES district ID
- 1201110
- Math proficiency
- 48% ▼ -13.00%
- Reading proficiency
- 53% ▼ -5.00%
- Median HH income
- $46,339
- Composite
- 42.84/100
- National rank
- #3131
- State rank
- #33 of 73 in FL
Livability — Tallahassee
- Score
- 86/100
- State rank
- #19
- US rank
- #429
Category grades
Schools grade is shown separately in the Schools card above.
Census & demographics
- Census place
- Tallahassee, FL
- County
- Leon County · 294,472 people
- City population
- 294,472
- Metro
- Tallahassee, FL
- Population (ZIP)
- 49,785
- Household income
- $62,275
- Rent vs Own
- Severe rent burden
- 2919.0
Population outlook (Leon County) Hauer SSP2
- Today (2025)
- 315,507 people
- By 2030
- 330,677 · +4.8%
- By 2040
- 358,465 · +13.6%
- By 2050
- 386,804 · +22.6%
- By 2075
- 465,480 · +47.5%
- By 2100
- 519,959 · +64.8%
Race, ethnicity, and origin ACS 2023
- Neighborhood character
- Diverse neighborhood (Simpson 0.63)
- Race & ethnicity
- White 50% Black 34% Hispanic / Latino 8% Two or more races 8% Asian 3%
- Hispanic origin (detail)
- Mexican 2% Puerto Rican 1% Cuban 2%
- Common ancestry
- Slovak 2% Italian 1% Lithuanian 1%
- Foreign-born
- 8% · Canada, Vietnam, China
- Languages at home
- 89% English-only · Spanish 5% Arabic 1% French/Haitian/Cajun 1%
Political lean MEDSL · Leon
- 2024 margin
- Strong D (+21.8) · D 60.3% · R 38.5% · Other 1.2%
- 2008→2024 swing
- -2.5pp toward R · 2008: 24.3pp · 2024: 21.8pp
- All cycles
- 2024: D+21.8 2020: D+28.3 2016: D+25.1 2012: D+23.6 2008: D+24.3
Not yet ingested
- Civics
- —
Market trends
- HPI YoY
- ▼ -255.24%
- Current HPI
- 241.3131
- Rent YoY
- ▲ 3.12%
- Metro
- Tallahassee, FL
- State GDP YoY
- ▲ 3.28%
- F500 in state
- 36
Industry mix (Fortune 500 HQ in FL)
| Industry | F500 HQs | Revenue |
|---|---|---|
| Industrial Technology | 2 | $29B |
|
||
| Insurance | 2 | $17B |
|
||
| Retail | 1 | $60B |
|
||
| Technology Distribution | 1 | $58B |
|
||
| Homebuilding | 1 | $35B |
|
||
| Technology Manufacturing | 1 | $35B |
|
||
Price history
+172.1% since first listed11 events — show timeline
- 2026-04-20 Price Changed $244,900 CATRS
- 2026-03-28 Listed $255,000 CATRS
- 2023-08-10 Sold (MLS) $228,000 CATRS
- 2023-07-10 Contingent — CATRS
- 2023-07-01 Listed $230,000 CATRS
- 2017-01-03 Sold (Public Records) $135,000 Public Records
- 2016-12-29 Sold (MLS) $135,000 CATRS
- 2016-11-14 Listed $145,000 CATRS
- 2015-03-04 Sold (Public Records) $90,000 Public Records
- 2015-03-02 Sold (MLS) $90,000 CATRS
- 2013-10-01 Listed $90,000 CATRS
Property tax history
+7.9%/yrLatest (2025): $2,996 · -12.3% YoY. Source: county tax records.
Cash-flow waterfall
monthlySold comps — $/sqft
last 12 mo · ≤1 miLoading sold comps…