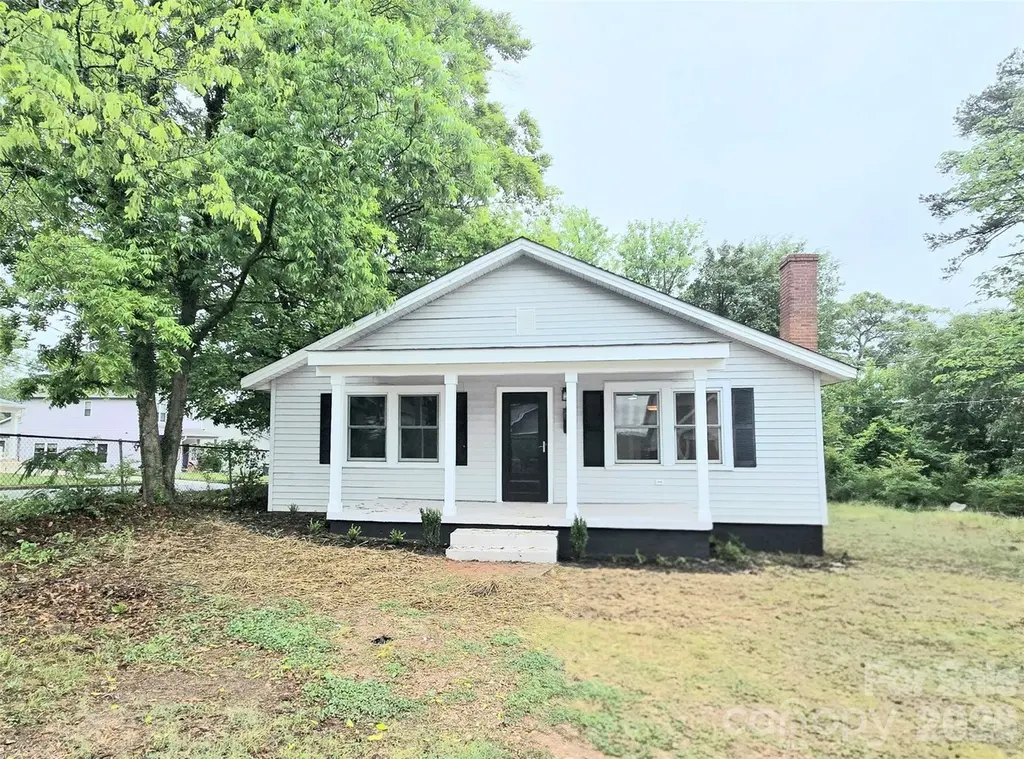
357 8th Avenue Dr SW · Hickory, NC
Flood risk 1/10 · Minimal
- FEMA flood zone
- X (unshaded)
- Chance of flooding over 30 yrs
- 0.0%
- Est. flood insurance / yr
- $507 – $1,088
Fire risk 3/10 · Minor
- Est. fire insurance / yr
- $906 – $1,684
Heat risk 5/10 · Moderate
- Hot days now (above 103°F)
- 7 days/yr
- Hot days in 30 yrs
- 17 days/yr
Wind risk 2/10 · Minimal
- Chance of severe wind over 30 yrs
- 2.0%
Air-quality risk 3/10 · Minor
- Unhealthy air days now
- 2 days/yr
- Unhealthy air days in 30 yrs
- 2 days/yr
Risk factors via First Street. Map © Google.
Why this score? — see what drove the D+ grade
The composite is a weighted blend of 9 inputs, each scored 0–100. Each bar is that input's sub-score; the figure is the points it added to the 100-point composite (weight × sub-score).
- Cash flow +15.4/30.0
- ARV discount +10.3/15.0
- DSCR +4.7/10.0
- Schools +3.6/10.0
- Livability +3.6/5.0
- Rent growth +3.5/5.0
- 1% rule +3.2/10.0
- Condition / age +2.5/5.0
- Appreciation +0.0/10.0
$204,250
🖨 Deal sheet (PDF) 📄 Offer letter ✓ Due diligence
Listing remarks
Welcome to 357 8th Avenue Dr SW in Hickory, a refreshed 3-bedroom, 1-bath home offering 1,442 sq. ft. and several meaningful updates buyers will appreciate. The home features a new roof completed in April 2026, new flooring, and fresh interior paint throughout, giving it a clean and move-in-ready feel. The kitchen has been updated with new cabinets, new sink, dishwasher, microwave, and stove, creating a bright and functional space for everyday living. The bathroom also includes a new vanity, toilet, tub, and surround. With important improvements already completed, this home is a great option for buyers looking for value, comfort, and convenience in Hickory. Agent related to seller. Schedule
Key facts
- New flooring
- New cabinets
- New sink
Tags
Property features AI
Finance
- HOA & community: No HOA
Exterior
- Parking: Driveway
- Utilities: City water; Public sewer; Cable available; Electricity connected
- Home design: Single-family residential; One level
- Construction: Site-built construction; Vinyl exterior; Crawl space foundation
- Exterior features: Lot dimensions roughly 126 x 65 x 107 x 18 x 61; Roads are dirt, gravel and paved; Publicly maintained road
Interior
- Kitchen: Dishwasher; Electric range; Microwave
- Bedrooms: 3 bedrooms on the main level
- Bathrooms: 1 full bathroom on the main level
- Heating & cooling: Central heating; Electric heating; Forced air; Heat pump; Central air; Ceiling fan(s)
- Interior features: 9 total rooms; Fireplace
- Laundry & utility: Utility room laundry
Neighborhood map
What this means for you Summary
Snapshot
- This is a 3-bed/1.0-bath single-family listed at $204k.
Deal economics
- At list price, monthly cash flow is $77 ($926/yr) — positive.
- The deal already cash-flows at list — no discount required.
- To meet the 1% rule (rent ≥ 1% of price), the offer needs to be $167k (18.2% below list).
- Recommended offer: $167k (18.2% below list) — sets the bar for 1% rule.
- Cap rate 6.7% vs local median 3.0% in Hickory — top-decile yield for the area; either an underpriced asset or a hidden risk that comps aren't pricing in. Stress-test before assuming the spread holds.
Location & tenants
- Location reads 71/100 on livability (#92 in NC) — a middle-class / working-renter tenant base. Strengths: cost of living A+, housing A+, health & safety A+; Watch: crime F, amenities F, commute F.
- Hickory City Schools (urban): math 43% / reading 44% proficiency, ranked #95 of 178 in NC (top 53%) — families likely to look elsewhere, expect single-tenant / working-renter base with shorter leases.
- Zoned schools: Viewmont Elementary (math 32% / reading 33%, grade F, #897 of 1,410 statewide, top 64%, 530 students, 78% FRL); Grandview Middle (math 40% / reading 37%, grade F, #244 of 475 statewide, top 53%, 400 students, 78% FRL); Hickory High (math 44% / reading 56%, grade D+, #309 of 535 statewide, top 58%, 1,014 students, 62% FRL) — zoned schools average 73% FRL vs 57% district-wide (16 pts higher); higher-poverty schools than district average — tighter screening recommended.
- Market conditions: Rents rising fast (+4.2%/yr); 211 active listings in the ZIP; 9 comparable units currently listed for rent nearby; rentals at typical pace (median 15d on market — plan ~3-4 weeks tenant-placement turnaround); 2,016 units permitted in Catawba County in 2024 (255 in 5+ unit buildings).
- This rent runs 32% of the median local income ($62k/yr) — at the standard rent-burdened threshold; future hikes will face affordability resistance.
Forward outlook
- Local home prices are declining (-3.0%/yr); year-one equity from $1k of loan paydown is wiped out by about $6k of value loss. Plan a longer hold.
- Catawba County population projected to shrink 7% by 2050 — rents likely to lag national; underwrite the cash flow, not the appreciation.
Negotiation context
- It's been on market 24 days — a 2% lower offer ($201k) is reasonable based on typical stale-listing flexibility.
Risks & watch-outs
- Watch-outs: built in 1947 — expect roof / HVAC / electrical / plumbing capex.
- Climate carrying-cost: extreme-heat days projected 7→17/yr by 2055 (HVAC capex compounding) — expect insurance premiums to compound above CPI over the hold.
Questions for the listing agent
- Built in 1947 — when were the roof, HVAC, electrical panel, plumbing, and water heater last replaced?
- Is there a deadline driving the sale (1031 exchange, divorce, estate, relocation)? That informs how much negotiation room exists.
- Crime grade is F in this area — have there been break-ins, vandalism, or insurance claims at this property in the last 3 years? What carrier currently insures it and at what premium?
- The area grade is low — what's the realistic commute time and amenity access for the typical tenant pool here? Any planned neighborhood developments (good or bad) we should know about?
- What's the average days-on-market for RENTAL listings here right now (not sales)? A rising rental-DOM trend means longer vacancies and softer asking-rent achievability than the comps imply.
- What's the recent tenant-quality profile in this submarket — average credit score on applications, eviction rate, late-payment / NSF rate, and stable-employment percentage? A property-management company in the area should have these aggregated.
- How much new for-sale + rental construction is in the pipeline within 1–3 miles? Heavy new supply typically softens prices + rents 12–24 months out; constrained supply supports both.
Investment metrics
- 1% rule
- 0.82% ✗
- Cap rate
- 6.75%
- Cash-on-cash
- 1.62%
- DSCR
- 1.07
- GRM
- 10.2
CMA / ARV
- ARV (on-the-fly)
- $217,600
- Comps found
- 12
Show comp detail 12 sales within ~0.75 mi
| Address | Dist | Beds/Ba | Sqft | Sold | Price | $/sf | Match |
|---|---|---|---|---|---|---|---|
| 932 3rd Street Pl SW | 0.04mi | 3/2.0 | 1,420 (+4%) | 12mo | $200,000 | $141 | 76 |
| 804 3rd Street Pl SW | 0.11mi | 3/2.5 | 1,270 (-7%) | 4mo | $155,000 | $122 | 74 |
| 760 3rd Street Pl SW | 0.13mi | 3/2.5 | 1,270 (-7%) | 10mo | $180,000 | $142 | 69 |
| 945 3rd Street Pl SW | 0.08mi | 3/2.0 | 1,217 (-10%) | 13mo | $195,000 | $160 | 64 |
| 432 4th Street Pl SW | 0.46mi | 3/2.0 | 1,303 (-4%) | 12mo | $255,000 | $196 | 58 |
| 836 7th Ave SW | 0.61mi | 3/2.0 | 1,261 (-7%) | 3mo | $245,000 | $194 | 53 |
| 331 5th Ave SE | 0.73mi | 3/1.5 | 1,334 (-2%) | 11mo | $200,000 | $150 | 51 |
| 1449 4th St SW | 0.59mi | 3/2.5 | 1,472 (+8%) | 3mo | $258,000 | $175 | 50 |
| 1231 2nd St SE | 0.63mi | 3/1.5 | 1,170 (-14%) | 2mo | $190,000 | $162 | 44 |
| 1177 2nd Street Pl SE | 0.61mi | 4/3.0 (+1) | 1,486 (+9%) | 4mo | $219,000 | $147 | 40 |
| 713 3rd St SE | 0.64mi | 2/1.0 (-1) | 1,215 (-11%) | 10mo | $152,500 | $126 | 39 |
| 737 8th St SW | 0.52mi | 4/2.0 (+1) | 1,552 (+14%) | 8mo | $270,000 | $174 | 36 |
Match score weights: distance 35% · size 25% · config 20% · recency 20%. Top-matched comps best support the ARV.
Projected returns pro-forma
-3.0% appreciation · 4.16% rent growth · sell at horizon
- IRR
- -12.6%
- Equity multiple
- 0.54×
- Total profit
- $-26,286
- Equity at exit
- $30,454
- IRR
- -2.1%
- Equity multiple
- 0.85×
- Total profit
- $-8,589
- Equity at exit
- $17,660
Cash invested: $57,190 (down + closing). Projections, not guarantees.
Landlord ↔ Tenant lean methodology
- Overall (STATE)
- 85 Strongly Landlord-Friendly
- State North Carolina
- 85 Strongly Landlord-Friendly · R+3
- County
- — inherits STATE
- City
- — inherits STATE
ZIP-level market 28602
- Home prices YoY
- -13.6%
- Rents YoY
- 4.2%
- Active inventory
- 211
- Price-to-rent
- 10.2×
Monthly cashflow live
- Estimated rent
- $1,671 high interval (Pro) →
- Mortgage (P&I)
- −$1,071
- Tax from tax record
- −$87 /mo · $1,039/yr
- Insurance
- −$85
- HOA
- −$0
- Vacancy / Maint / Mgmt
- −$351
- Net cashflow
- $77
Break-even live
Sensitivity live
| Price | -10% $193 | -5% $135 | +0% $77 | +5% $19 | +10% $-38 |
|---|---|---|---|---|---|
| Rent | -10% $-55 | -5% $11 | +0% $77 | +5% $143 | +10% $209 |
| Rate | -1.0pp $180 | -0.5pp $129 | base $77 | +0.5pp $24 | +1.0pp $-30 |
UW: 25.0% down · 7.5% · 30yr · 1.5% tax · 5.0% vac · 8.0% maint · 8.0% mgmt
Financing live
Cash to close
- Down payment
- $51,062
- Closing costs
- $6,128
- Reserves months
- —
- Total cash needed
- —
Loan-product check · same deal, 3 products live
Conventional
25% down · 7.5% · 30yr
- Down + closing
- —
- Monthly P&I
- —
- Monthly cashflow
- —
- DSCR
- —
- Eligible?
- —
Personal DTI + credit; lowest rate.
DSCR
20% down · 8.5% · 30yr
- Down + closing
- —
- Monthly P&I
- —
- Monthly cashflow
- —
- DSCR
- —
- Eligible?
- —
No personal income docs; deal must DSCR.
Hard money
10% down · 12.0% · 12mo
- Down + closing
- —
- Monthly P&I
- —
- Monthly cashflow
- —
- DSCR
- —
- Eligible?
- —
Short-term bridge; refi at stabilization.
Rent comps 9 comps
| Address | Beds | Baths | Sqft | Rent | $/sqft | DOM | Units | Dist |
|---|---|---|---|---|---|---|---|---|
| 119 8th Avenue Dr SE Hickory, NC | 3.0 | 2.5 | 1298 | $1,665 | $1.28 | 15d | 1 | 0.41mi |
| 133 8th Avenue Dr SE Hickory, NC | 3.0 | 2.5 | 1298 | $1,695 | $1.31 | 15d | 1 | 0.43mi |
| 183 8th Avenue Dr SE Hickory, NC | 3.0 | 2.5 | 1300 | $1,675 | $1.29 | 15d | 1 | 0.47mi |
| 1051 3rd St SE Unit 1069 Hickory, NC | 2.0 | 1.5 | 963 | $1,325 | $1.38 | 15d | 1 | 0.57mi |
| 1620 2nd St SW Hickory, NC | 3.0 | 1.0 | 1054 | $1,350 | $1.28 | 5d | 1 | 0.88mi |
| 1 N Center St Hickory, NC | 1.0–2.0 | 1.0–2.0 | 991 | $2,344 | $2.36 | 15d | 6 | 0.90mi |
| 1131 3rd Ave SW Hickory, NC | 2.0 | 1.5 | 1024 | $1,100 | $1.07 | 15d | 1 | 1.05mi |
| 735 8th Avenue Ct SE Hickory, NC | 3.0 | 2.0 | 1334 | $1,795 | $1.35 | 23d | 1 | 1.10mi |
| 723 Highland Ave SE Hickory, NC | 2.0 | 1.0 | 985 | $1,500 | $1.52 | 23d | 1 | 1.28mi |
Listing history 17 events
-
2026-06-21days on market $204,250 Active 24 DOM
-
2026-06-19days on market $204,250 Active 22 DOM
-
2026-06-18days on market $204,250 Active 21 DOM
-
2026-06-17days on market $204,250 Active 20 DOM
-
2026-06-16days on market $204,250 Active 19 DOM
-
2026-06-15pricedays on market $204,250 Active 18 DOM
-
2026-06-14days on market $215,000 Active 16 DOM
-
2026-06-13days on market $215,000 Active 15 DOM
-
2026-06-10days on market $215,000 Active 13 DOM
-
2026-06-09days on market $215,000 Active 12 DOM
-
2026-06-08days on market $215,000 Active 11 DOM
-
2026-06-07days on market $215,000 Active 10 DOM
-
2026-06-05days on market $215,000 Active 7 DOM
-
2026-06-02days on market $215,000 Active 5 DOM
-
2026-05-31days on market $215,000 Active 3 DOM
-
2026-05-30days on market $215,000 Active 2 DOM
-
2026-05-28$215,000 Active
ⓘ Source: listings_history table (triggers on properties + properties_extension) + one-shot
backfill from property_details.listing_events for pre-trigger history.
Tax reassessment forecast NC · Resets to sale price
- Current annual tax
- $1,039 · $87/mo
- Projected year-2 tax
- $1,675 · $140/mo
- Expected delta
- +$636/yr (+$53/mo · 61.2%)
ⓘ Screening estimate from a state-policy table — verify with the county assessor before closing.
Climate risk First Street
- Flood 1/10 Low FEMA zone X (unshaded) · 0% chance over 30 yrs
- Wildfire 3/10 Moderate
- Heat 5/10 Major 7 d/yr ≥103°F today · 17 d/yr by 30 yrs out
- Wind 2/10 Low 2% chance of damaging wind over 30 yrs
- Air quality 3/10 Moderate 2 unhealthy d/yr today · 2 by 30 yrs out
Nearby sold comps map
Loading sold comps map…
Walkable amenities ~0.75 mi
Loading nearby amenities…
Taxation est. · year 1
- Rental income
- $20,050
- − Mortgage interest
- −$11,441
- − Property taxes
- −$1,039
- − Insurance
- −$1,021
- − Repairs & maintenance
- −$1,604
- − Management
- −$1,604
- − Depreciation
- −$5,942
- Taxable loss
- −$2,601
- Est. tax savings @ 24.0%
- +$624
- After-tax cash flow
- $1,551/yr
For passive investors: Depreciation is non-cash, so a rental often shows a tax loss while cash-flowing — sheltering income. Rental losses are passive: they offset passive income freely, and up to $25,000/yr can offset ordinary (W-2) income if you actively participate and your MAGI is under $100k (phasing out to $0 by $150k); unused losses carry forward. On sale, claimed depreciation is recaptured at up to 25%, and gains may owe capital-gains tax (a 1031 exchange can defer both). Figures are a year-1 estimate at your 24.0% rate — not tax advice; consult a CPA.
Schools (NCES district)
- District
- Hickory City Schools
- NCES district ID
- 3702190
- Math proficiency
- 43% ▲ 2.00%
- Reading proficiency
- 44% ▼ -1.00%
- Median HH income
- $38,399
- Composite
- 36.29/100
- National rank
- #4700
- State rank
- #95 of 178 in NC
Livability — Hickory
- Score
- 71/100
- State rank
- #92
- US rank
- #6361
Category grades
Schools grade is shown separately in the Schools card above.
Census & demographics
- Census place
- Hickory, NC
- County
- Catawba County · 105,763 people
- City population
- 84,442
- Metro
- Hickory-Lenoir-Morganton, NC
- Population (ZIP)
- 31,113
- Household income
- $62,048
- Rent vs Own
- Severe rent burden
- 642.0
Population outlook (Catawba County) Hauer SSP2
- Today (2025)
- 156,513 people
- By 2030
- 155,267 · -0.8%
- By 2040
- 151,110 · -3.5%
- By 2050
- 145,524 · -7.0%
- By 2075
- 134,047 · -14.4%
- By 2100
- 119,424 · -23.7%
Race, ethnicity, and origin ACS 2023
- Neighborhood character
- Predominantly White (70%)
- Race & ethnicity
- White 70% Black 12% Hispanic / Latino 10% Two or more races 7% Asian 6%
- Hispanic origin (detail)
- Mexican 7%
- Common ancestry
- Slovak 3% Italian 3% Iranian 2%
- Foreign-born
- 6% · Canada, Dominican Republic
- Languages at home
- 88% English-only · Spanish 7% Other Asian/Pacific 4%
Political lean MEDSL · Catawba
- 2024 margin
- Solid R (+38.0) · D 30.6% · R 68.6%
- 2008→2024 swing
- -13.0pp toward R · 2008: -25.0pp · 2024: -38.0pp
- All cycles
- 2024: R+38.0 2020: R+37.0 2016: R+38.0 2012: R+29.6 2008: R+25.0
Not yet ingested
- Civics
- —
Market trends
- HPI YoY
- ▼ -41.01%
- Current HPI
- 259.947
- Rent YoY
- ▲ 4.16%
- Metro
- Hickory-Lenoir-Morganton, NC
- State GDP YoY
- ▲ 3.28%
- F500 in state
- 26
Industry mix (Fortune 500 HQ in NC)
| Industry | F500 HQs | Revenue |
|---|---|---|
| Financial Services | 2 | $213B |
|
||
| Retail | 2 | $95B |
|
||
| Industrial Conglomerate | 1 | $38B |
|
||
| Metals / Steel | 1 | $35B |
|
||
| Utilities | 1 | $30B |
|
||
| Industrial Machinery | 1 | $19B |
|
||
Price history
1 event — show timeline
- 2026-05-28 Listed $215,000 CANOPYMLS as Distributed by MLS Grid
Property tax history
+6.4%/yrLatest (2024): $1,039 · +0.0% YoY. Source: county tax records.
Cash-flow waterfall
monthlySold comps — $/sqft
last 12 mo · ≤1 miLoading sold comps…